Energy production in December of 2021
In December 2021, among the main energy products of industries above designated size, coal, oil and gas increased in varying degrees, except that the power generation decreased year-on-year. In 2021, the production of raw coal, crude oil and electricity accelerated over the previous year, and the growth rate of natural gas production slowed down.
I. Raw Coal, Crude Oil and Natural Gas Production and Relevant Information
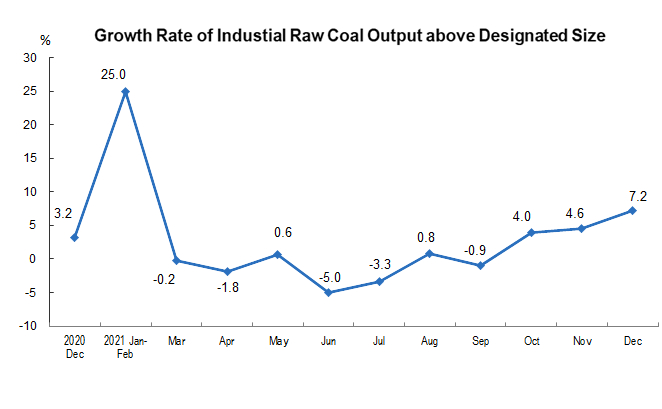
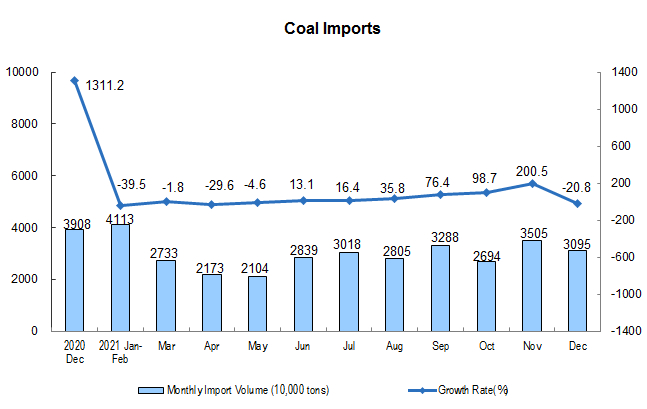
Raw coal production continued to accelerate, and imports changed from increase to decrease. With the continuous promotion of the policy of increasing production and ensuring supply, 380 million tons of raw coal were produced in December, with a year-on-year increase of 7.2 percent, 2.6 percentage points faster than the previous month, 10.7 percent higher than the same period in 2019, an average increase of 5.2 percent in two years, and an average daily output of 12.41 million tons; 30.95 million tons of coal were imported, a year-on-year decrease of 20.8 percent.
In 2021, 4.07 billion tons of raw coal were produced, an increase of 4.7 percent over the previous year, an increase of 5.6 percent over 2019, and an average increase of 2.8 percent over the two years; 320 million tons of coal were imported, an increase of 6.6 percent over the previous year.
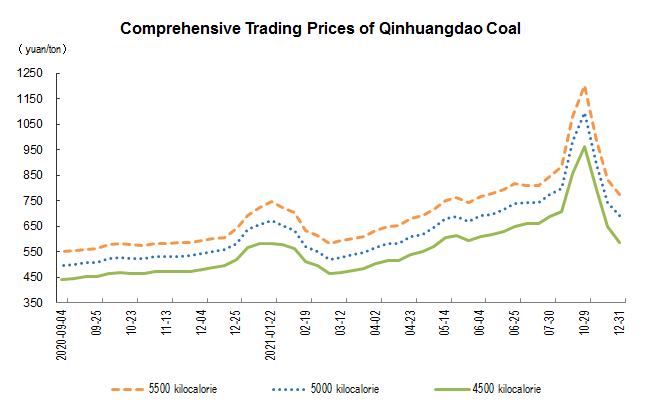
Coal prices fell. On December 31, the comprehensive transaction prices of 5500, 5000 and 4500 kcal thermal coal in Qinhuangdao Port were 773, 692 and 584 yuan per ton respectively, down 213, 199 and 208 yuan respectively compared with November 26.
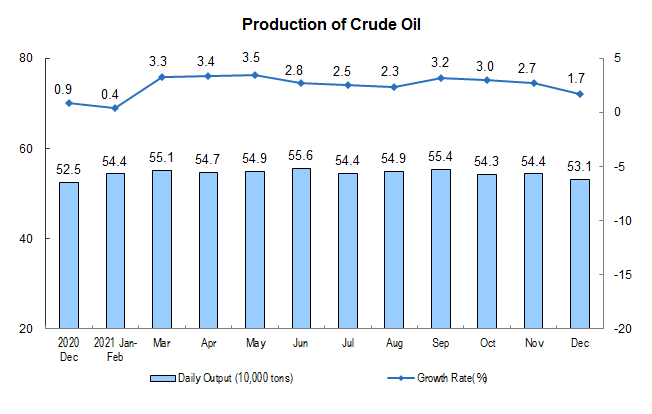
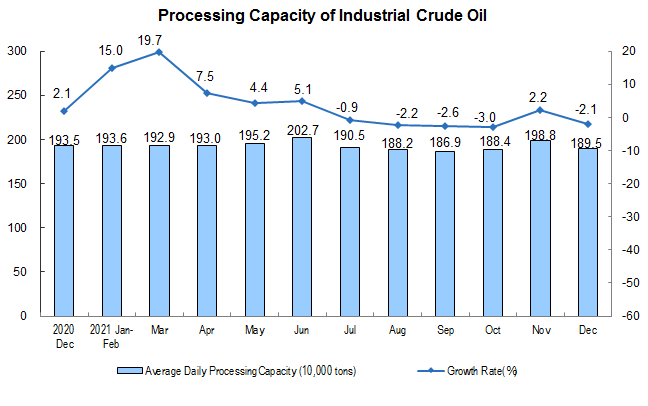
The growth rate of crude oil production fell slightly, and the processing capacity changed from increase to decrease. In December, it produced 16.47 million tons of crude oil, a year-on-year increase of 1.7 percent, a slowdown of 1.0 percentage point over the previous month, an increase of 2.6 percent over the same period in 2019, an average increase of 1.3 percent over the two years, and an average daily output of 531,000 tons; the crude oil processed was 58.73 million tons, a year-on-year decrease of 2.1 percent, an increase of 2.2 percent in last month, a decrease of 0.1 percent over the same period in 2019, an average decrease of 0.1 percent in two years, and an average daily processing of 1.895 million tons.
In 2021, 198.98 million tons of crude oil were produced, an increase of 2.4 percent over the previous year, an increase of 4.0 percent over 2019, and an average increase of 2.0 percent over the two years; 703.55 million tons of crude oil were processed, an increase of 4.3 percent over the previous year, 7.4 percent over 2019, and an average increase of 3.6 percent over the two years.
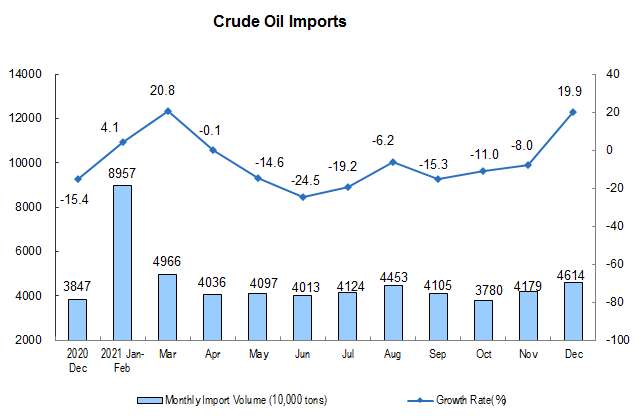
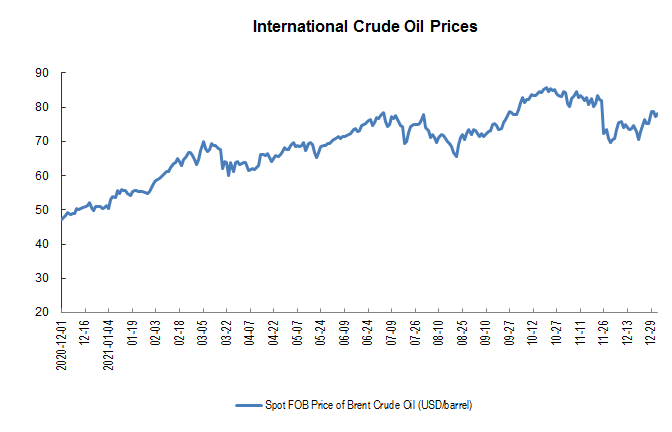
Crude oil imports have changed from decline to increase, and international crude oil prices have risen. In December, the imported crude oil was 46.14 million tons, an increase of 19.9 percent year-on-year and a decrease of 8.0 percent in last month; in 2021, 512.98 million tons of crude oil were imported, a decrease of 5.4 percent over the previous year. On December 31, the spot FOB price of Brent crude oil was 77.24 USD per barrel, up 9.0 percent from 70.86 USD per barrel on November 30.
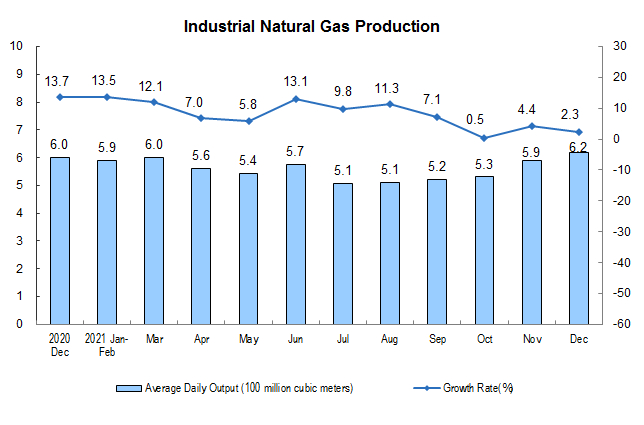
Natural gas production slowed down. In December, the production of natural gas was 19.2 billion cubic meters, a year-on-year increase of 2.3 percent, a slowdown of 2.1 percentage points over the previous month, an increase of 16.4 percent over the same period in 2019, an average increase of 7.9 percent over the two years, and an average daily output of 620 million cubic meters.
In 2021, 205.3 billion cubic meters of natural gas were produced, an increase of 8.2 percent over the previous year, an increase of 18.8 percent over 2019, and an average increase of 9.0 percent over the two years.
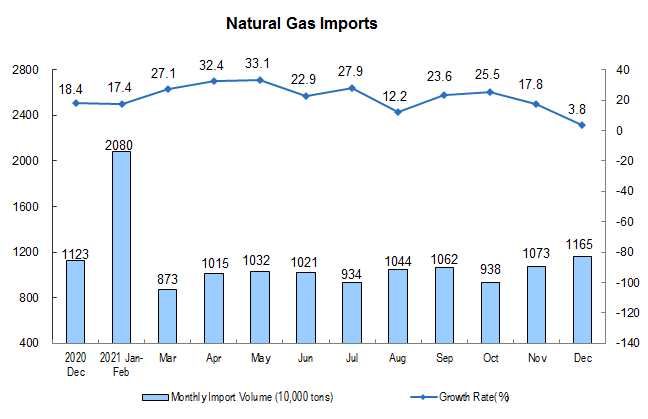
The growth rate of natural gas imports fell. In December, the imported natural gas was 11.65 million tons, a year-on-year increase of 3.8 percent, and the growth rate was 14.0 percentage points lower than that of the previous month. In 2021, 121.36 million tons of natural gas were imported, an increase of 19.9 percent over the previous year.
II. Electric Power Production
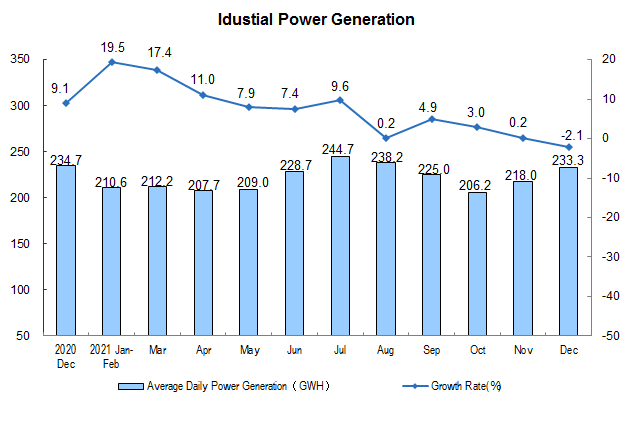
Power production decreased year-on-year. In December, the power generation was 723.4 billion kwh, a year-on-year decrease of 2.1 percent, an increase of 0.2 percent last month, an increase of 6.8 percent over the same period in 2019, an average increase of 3.4 percent in two years, and an average daily power generation of 23.33 billion kwh. In 2021, 8,112.2 billion kwh of power generation was generated, an increase of 8.1 percent over the previous year, an increase of 11.0 percent over 2019, and an average increase of 5.4 percent over the two years.
In terms of varieties, in December, the decline of thermal power and hydropower increased compared with the previous month, the growth rate of wind power and nuclear power accelerated, and the growth rate of solar power slowed down. Among them, thermal power decreased by 4.9 percent year-on-year, 2.4 percentage points higher than that of the previous month, with an average increase of 1.9 percent in the two years; hydropower decreased by 6.8 percent, and the decline expanded by 4.9 percentage points, with an average growth of 1.9 percent in the two years; wind power increased by 30.1 percent, 2.4 percentage points faster than the previous month, with an average growth of 18.0 percent in the two years; nuclear power increased by 5.7 percent, 1.6 percentage points faster than the previous month, with an average growth of 5.9 percent in the two years; solar power generation increased by 18.8 percent, 3.9 percentage points slower than the previous month, with an average growth of 13.8 percent in the two years.
Annotations:
1. Explanatory Notes
Average daily product output: It is calculated by dividing the total output of Industrial Enterprises above the designated size announced in that month by the calendar days of that month.
2. Statistical Coverage
The statistical caliber of the output data in the report is above the designated size of industry, and the statistical scope is industrial enterprises with annual main business income of more than 20 million yuan.
Because the scope of Industrial Enterprises above the designated size changes every year, in order to ensure that this year's data is comparable with the previous year's, the same period used to calculate the growth rate of various indicators such as product output is consistent with the statistical scope of enterprises in this period, and there is a caliber difference between the data released last year.
3. Data Source
Import data comes from the General Administration of Customs, of which December data are express data; coal price data comes from China Coal Market Network; crude oil price data comes from the United States Energy Information Agency (EIA).
4. Conversion relationship of natural gas units: 1 ton is equal to 1380 cubic meters.
5. The two-year average growth rate refers to the growth rate calculated by geometric average method based on the corresponding number of the same period in 2019.