Producer Prices in the Industrial Sector for September 2021
In September 2021, Producer Price Index (PPI) for manufactured goods rose by 10.7 percent year-on-year and 1.2 percent month-on-month. The purchasing price index for manufactured goods increased by 14.3 percent year-on-year and 1.1 percent month-on-month. In the first nine months, on average, the producer price of industrial products increased by 6.7 percent over the same period last year, and the purchasing price of industrial products increased by 9.3 percent.
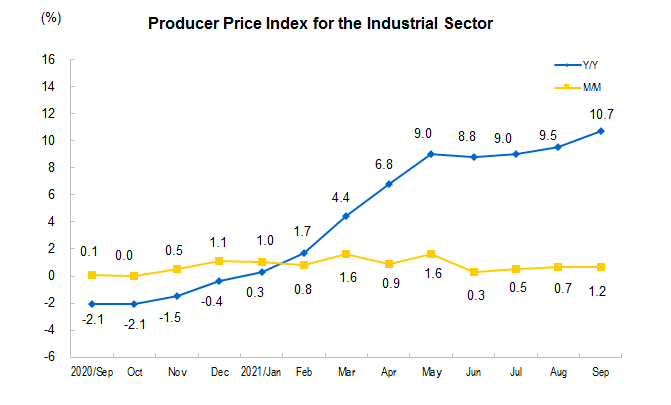

1. Year-on-Year Changes of Prices of Different Categories
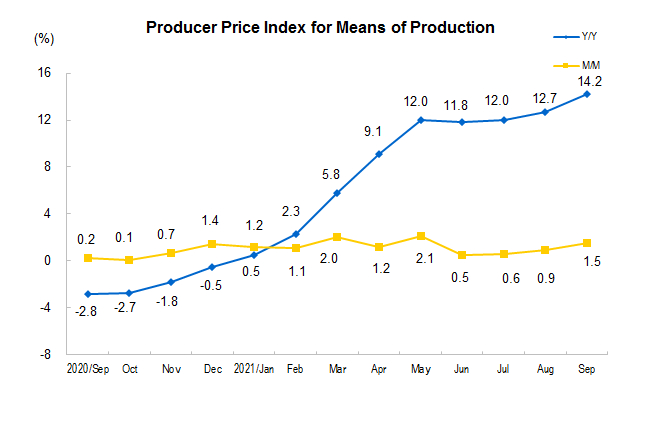
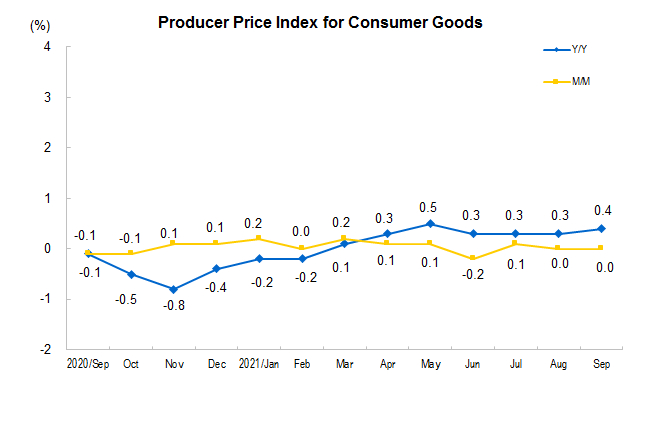
Among the PPI for manufactured goods, the price of means of production increased by 14.2 percent, affecting the overall level of producer prices of industrial producers up by about 10.60 percentage points. Among them, the price of mining industry increased by 49.4 percent, the price of raw material industry increased by 20.4 percent, and the price of processing industry increased by 8.9 percent. The price of means of consumer goods rose by 0.4 percent, affecting the overall level of producer prices of industrial producers up by about 0.11 percentage point. Among them, food prices rose by 0.7 percent, clothing and general daily necessities prices rose by 0.4 percent, and durable consumer goods prices rose by 0.2 percent.
Among the purchasing prices of industrial producers, the prices of fuel and power increased by 30.3 percent, the prices of ferrous metal materials increased by 23.3 percent, the prices of non-ferrous metal materials and wires increased by 22.6 percent, and the prices of chemical raw materials increased by 20.7 percent.
2. Month-on-Month Changes of Prices of Different Categories
Among the producer prices of industrial producers, the price of means of production increased by 1.5 percent, affecting the overall level of producer prices of industrial producers up by about 1.16 percentage points. Among them, the price of mining industry increased by 5.5 percent, the price of raw material industry increased by 1.9 percent, and the price of processing industry increased by 0.9 percent. The price of means of consumer goods was flat. Among them, the prices of food and general daily necessities decreased by 0.1 percent, the prices of clothing increased by 0.2 percent, and the prices of durable consumer goods were flat.
Among the purchase prices of industrial producers, the prices of fuel and power increased by 3.9 percent, the prices of non-ferrous metal materials and wires increased by 1.7 percent, and the prices of chemical raw materials increased by 1.0 percent; The price of ferrous metal materials decreased by 0.9 percent.
Price Indexes for the Industrial Sector in September
| | M/M(%) | Y/Y(%) | Jan-Sep |
| Y/Y(%) | |||
| | | | |
| I. Producer Price Indices | 1.2 | 10.7 | 6.7 |
| Means of production | 1.5 | 14.2 | 8.9 |
| Mining and quarrying | 5.5 | 49.4 | 26.7 |
| Raw materials | 1.9 | 20.4 | 13.2 |
| Processing | 0.9 | 8.9 | 5.6 |
| Means of subsistence | 0.0 | 0.4 | 0.2 |
| Food | -0.1 | 0.7 | 1.5 |
| Clothing | 0.2 | 0.4 | -0.6 |
| Articles for daily use | -0.1 | 0.4 | 0.2 |
| Durable consumer goods | 0.0 | 0.2 | -0.8 |
| II. Purchaser Price Indices | 1.1 | 14.3 | 9.3 |
| Fuel and Power | 3.9 | 30.3 | 14.1 |
| Ferrous Metals | -0.9 | 23.3 | 20.9 |
| Non-ferrous Metal Materials and Wires | 1.7 | 22.6 | 20.1 |
| Chemical Raw Materials | 1.0 | 20.7 | 12.3 |
| Wood and Pulp | -0.1 | 7.2 | 4.9 |
| Building Materials and Non-metallic | 2.2 | 7.9 | 2.8 |
| Other Industrial Raw Materials and Semi-products | 0.3 | 4.9 | 2.7 |
| Agricultural and Sideline Products | -0.2 | 2.6 | 4.9 |
| Textile Raw Materials | 0.7 | 7.6 | 3.5 |
| III. Producer Price Indices of Major Industries | | | |
| Mining and Washing of Coal | 12.1 | 74.9 | 31.0 |
| Extraction of Petroleum and Natural Gas | -0.9 | 43.6 | 32.6 |
| Mining of Ferrous Metal Ores | -8.7 | 29.4 | 39.5 |
| Mining of Non-Ferrous Metal Ores | 1.0 | 11.7 | 13.3 |
| Mining and Processing of Nonmetal Ores | 0.4 | 3.8 | 2.1 |
| Processing of Food from Agricultural Products | -0.1 | 2.5 | 4.3 |
| Manufacture of Foods | 0.2 | 2.2 | 1.3 |
| Manufacture of Wines, Beverage and Refined Tea | 0.0 | 1.4 | 1.8 |
| Manufacture of Cigarettes and Tobacco | 0.0 | 0.6 | 0.5 |
| Manufacture of Textile | 0.4 | 7.4 | 2.5 |
| Manufacture of Textile Wearing Apparel and Ornament | 0.2 | 0.4 | -0.4 |
| Processing of Timbers, Manufacture of Wood, Bamboo, Rattan, Palm, and Straw Products | 0.4 | 1.8 | 0.7 |
| Manufacture of Paper and Paper Products | 0.1 | 5.5 | 4.5 |
| Printing, Reproduction of Recording Media | -0.1 | 0.9 | 0.2 |
| Processing of Petroleum, Coking, Processing of Nucleus Fuel | 3.3 | 40.5 | 22.0 |
| Manufacture of Chemical Raw Material and Chemical Products | 2.0 | 25.5 | 16.0 |
| Manufacture of Medicines | -0.3 | -0.8 | -0.5 |
| Manufacture of Chemical Fibers | -1.3 | 23.8 | 13.8 |
| Manufacture of Rubber and Plastics Products | 0.1 | 4.5 | 2.4 |
| Manufacture of Non-metallic Mineral Products | 2.9 | 5.1 | 1.0 |
| Manufacture and Processing of Ferrous Metals | 1.8 | 34.9 | 27.7 |
| Manufacture and Processing of Non-Ferrous Metals | 2.9 | 24.6 | 21.8 |
| Manufacture of Fabricated Metal Products | 0.7 | 9.0 | 5.7 |
| Manufacture of General- Purpose Machinery | 0.2 | 2.4 | 1.0 |
| Manufacture of Motor Vehicles | 0.2 | -0.2 | -0.6 |
| Manufacture of Railway Locomotives, Building of Ships and Boats, Manufacture of Air and Spacecrafts and Other Transportation Equipments | 0.1 | 0.9 | 0.4 |
| Manufacture of Computer, Communication Equipment and Other Electronic Equipment | 0.0 | 1.4 | -0.7 |
| Production and Supply of Electric Power and Heat Power | 0.4 | 0.2 | -0.7 |
| Production and Distribution of Gas | 2.5 | 8.5 | 3.1 |
| Production and Distribution of Water | 0.0 | 1.3 | 1.0 |
| | | | |
Annotations:
1. Explanatory Notes
Producer Price Index for manufactured goods consists of producer price index and purchaser price index.
The industrial producer price index reflects the trend and level of prices change when the products are sold for the first time.
The industrial purchaser price index reflects the trend and level of prices change for the products purchased by the industrial enterprises as intermediate inputs.
2. Statistical Coverage
The factory price survey of industrial producers covers the prices of industrial products in 40 major industrial categories and more than 1300 basic categories; the purchase price survey of industrial producers covers the prices of industrial products in 9 major categories and more than 800 basic categories.
3. Survey Methods
The industrial producer price survey adopts the method of combining key survey with typical survey, involving more than 40000 industrial enterprises in China.
4. Statistical Standard
Industrial Classification is based on the “Industrial Classification for National Economic Activities” (GB/T4754-2017).
5. Data Description
Due to "rounding-off", sometimes the aggregate data is the same as the high or low value of the classified data.
6. Base Period Rotation
According to the provisions of the statistical system, China's industrial producer price statistical survey has a base period rotation every five years, and the price index with 2020 as the base period will be compiled and released from January 2021. Compared with the previous round of base period, the survey classification catalogue, representative specifications and survey enterprises in the new base period have been adjusted, and the classification weight has also changed to reflect the latest changes in the industrial production structure. It is estimated that the average impact of base period rotation on the year-on-year index of each month is about 0.05 percentage point, which is within the statistical acceptable range.