Total Retail Sales of Consumer Goods Went Up by 8.5 percent from January to July 2021
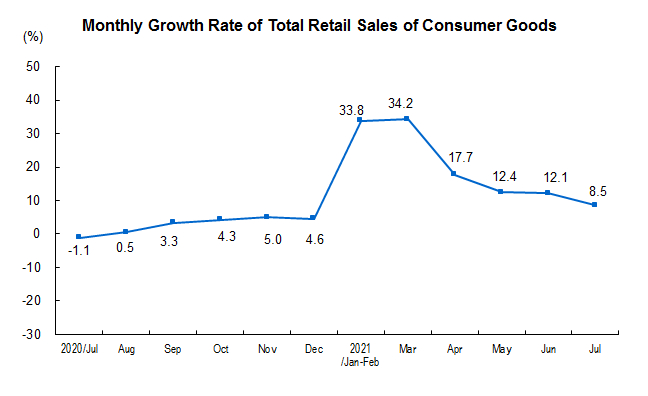
In July, the total retail sales of social consumer goods was 3,492.5 billion yuan, an increase of 8.5 percent year-on-year; the growth rate was 7.2 percent higher than that in July 2019, and the average growth rate in the two years was 3.6 percent. Among them, the retail sales of consumer goods other than automobiles reached 3,157.8 billion yuan, an increase of 9.7 percent. Excluding price factors, the total retail sales of social consumer goods actually increased by 6.4 percent in July.
From January to July, the total retail sales of social consumer goods reached 24,682.9 billion yuan, a year-on-year increase of 20.7 percent, and the average growth rate in the two years was 4.3 percent. Among them, the retail sales of consumer goods other than automobiles reached 22,163.1 billion yuan, an increase of 20.2 percent.
According to the location of business units, in July, the retail sales of urban consumer goods reached 3,037.9 billion yuan, a year-on-year increase of 8.4 percent; the retail sales of rural consumer goods reached 454.7 billion yuan, an increase of 8.8 percent. From January to July, the retail sales of urban consumer goods reached 21,447.6 billion yuan, a year-on-year increase of 20.9 percent; the retail sales of rural consumer goods reached 3,235.3 billion yuan, an increase of 19.4 percent.
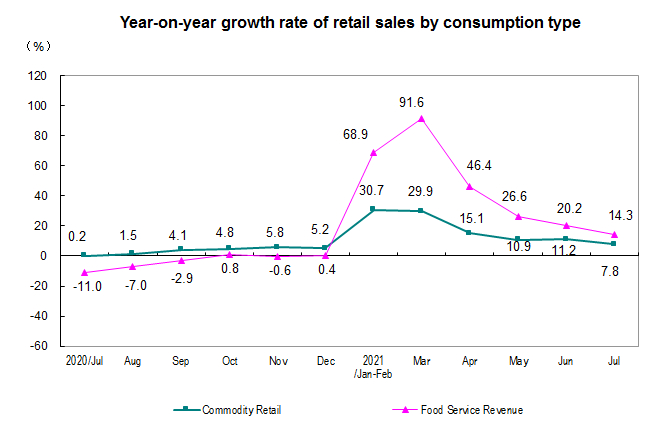
By type of consumption, in July, retail sales of goods reached 3,117.4 billion yuan, an increase of 7.8 percent year-on-year; catering revenue was 375.1 billion yuan, an increase of 14.3 percent. From January to July, the retail sales of commodities reached 22,136.6 billion yuan, an increase of 18.7 percent year-on-year; catering revenue was 2,546.3 billion yuan, an increase of 42.3 percent.
From January to July, the national on-line retail sales reached 7,110.8 billion yuan, a year-on-year increase of 21.9 percent. Among them, the online retail sales of physical goods reached 5,813 billion yuan, an increase of 17.6 percent, accounting for 23.6 percent of the total retail sales of social consumer goods; Among the online retail sales of physical goods, food, clothing and consumer goods increased by 23.7, 21.6 and 15.8 percent respectively.
Total Retail Sales of Consumer Goods in July 2021
| | | |
| ||||
| tem | July | Jan-Jul | |||||
| Absolute Value (100 million yuan) | Y/Y (%) | Absolute Value (100 million yuan) | Y/Y (%) | ||||
| | | | | | |||
| Total Retail Sales of Consumer Goods | 8.5 | 246829 | 20.7 | ||||
| Of Which: Retail Sales of the Enterprises (units) excluding automobiles | 31578 | 9.7 | 221631 | 20.2 | |||
| Of Which: Retail Sales of the Enterprises (units) above Designated Size | 12425 | 8.5 | 91259 | 23.6 | |||
| Of Which: Online Retail Sales of Physical Goods | - | - | 58130 | 17.6 | |||
| Grouped by Different Areas | | | | | |||
| City | 30379 | 8.4 | 214476 | 20.9 | |||
| At and Below County Level | 4547 | 8.8 | 32353 | 19.4 | |||
| Grouped by Consumption Patterns | | | | | |||
| Catering Services | 3751 | 14.3 | 25463 | 42.3 | |||
| Of which: Income of Catering Services of the Enterprises (units) above Designated Size | 896 | 20.7 | 5842 | 49.5 | |||
| Retail Sales of Goods | 31174 | 7.8 | 221366 | 18.7 | |||
| Of which: Income of Retail Sales of Goods of the Enterprises (units) above Designated Size | 11529 | 7.7 | 85417 | 22.2 | |||
| Of which: Grain, Oil, Foodstuff | 1246 | 11.3 | 9291 | 10.6 | |||
| Beverages, | 233 | 20.8 | 1587 | 27.9 | |||
| Tobacco and Liquor | 325 | 15.1 | 2588 | 29.6 | |||
| Garments, Footwear, Hats, Knitwear | 945 | 7.5 | 7673 | 29.8 | |||
| Cosmetics | 239 | 2.8 | 2158 | 23.4 | |||
| Gold, Silver and Jewelry | 203 | 14.3 | 1730 | 52.8 | |||
| Commodities | 551 | 13.1 | 4110 | 21.5 | |||
| Household Appliances and AV Equipment | 741 | 8.2 | 5165 | 17.6 | |||
| Traditional Chinese and Western Medicines | 456 | 8.6 | 3248 | 10.9 | |||
| Cultural and Office Appliances | 303 | 14.8 | 2132 | 21.7 | |||
| Furniture | 138 | 11.0 | 917 | 26.7 | |||
| Communication Appliances | 387 | 0.1 | 3376 | 22.4 | |||
| Petroleum and Related Products | 1753 | 22.7 | 11382 | 21.9 | |||
| Automobile | 3347 | -1.8 | 25198 | 25.0 | |||
| Building and Decoration Materials | 157 | 11.6 | 1038 | 29.2 | |||
| | | | | | |||
| Notes: 1. The growth rate in this table are all nominal growth rate without deducting the price factor. 2. For parts of data, the total is not equal to the total of sub-items due to round-off. | |||||||
Annotations:
1. Explanatory Notes
Total Retail Sales of Consumer Goods: refers to the sales of physical commodity or the income of catering services sold or provided by enterprises (units) to individuals, social organizations for non-production and non-operation purposes.
Online Retail Sales: refers to the sales of goods and services got through public online trading platform (including self-built websites and third-party platform). Goods and services include physical goods and non-physical goods (such as virtual product, services).
The total retail sales of consumer goods include online retail sales of physical goods, excludes online retail sales of non-physical goods.
2. Statistical Coverage
The corporate enterprises, industrial activity units or self-employed individuals which retail goods or provide catering services. Enterprises (units) above designated size refer to those wholesale enterprises (units) with an annual revenue from primary business of 20 million yuan and above, those retail enterprises (units) with an annual revenue from primary business of 5 million yuan and above, and those hotel and catering enterprises (units) with an annual revenue from primary business of 2 million yuan and above.
As the scope of wholesale and retail enterprises, accommodation and catering enterprises (units) above the designated size changes every year, the same period used to calculate the growth rate of retail sales per unit of consumer goods above the designated size is consistent with the statistical range of enterprises (units) in this period, and there is a caliber difference from the data released last year in order to ensure that the current year's data are comparable with the previous years. The main reasons are as follows: some enterprises (units) reach the designated size and are included in the scope of the investigation every year, at the same time, some enterprises (units) withdraw from the scope of the investigation because their scale is smaller than the designated size, and there are also the effects of newly opened enterprises, bankruptcy, note (revocation) enterprises (units).
3. Survey Methods
All enterprises (units) above designated size are surveyed, while the data of enterprises (units) below designated size are collected by sampling survey.
4. Month-on-Month Figure Revision
According to the auto-revision function of the seasonal adjustment model, the growth rate of the total retail sales of consumer goods since July 2020 was revised. The revised figures and figures are as follows:
| The Month-on-Month Growth Rate of Total Retail Sales of Consumer Goods | |
| Months | Growth Rate (%) |
| | |
| 2020- July | 0.24 |
| August | 0.68 |
| September | 3.58 |
| October | 0.23 |
| November | 1.15 |
| December | 0.83 |
| 2021-January | -0.15 |
| February | 0.84 |
| March | 0.75 |
| April | 0.05 |
| May | 0.64 |
| June | 0.48 |
| July | -0.13 |
| | |