Households' Income and Consumption Expenditure in the First Half Year of 2021
I. Households' Income
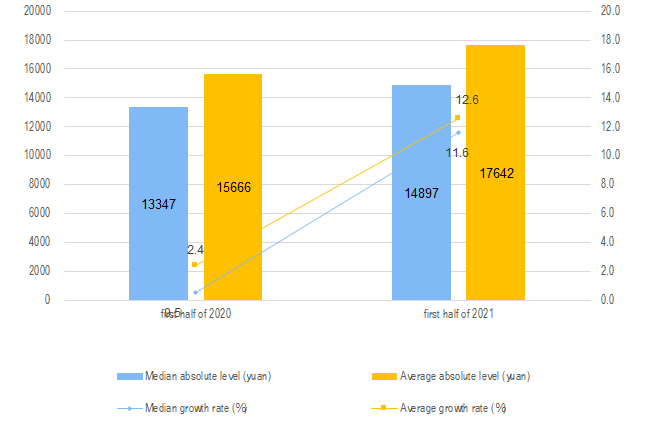
In the first half of the year, the per capita disposable income of residents in China was 17,642 yuan, a nominal increase of 12.6 percent over the same period of last year. After deducting the price factor, the actual increase was 12.0 percent, which was higher, mainly due to the low base in the first half of last year; it was 15.4 percent higher than that in the first half of 2019, with an average growth of 7.4 percent in two years. After deducting the price factor, the average real growth in two years was 5.2 percent, slightly lower than the economic growth in the same period. The growth of residents' income was basically synchronized with the economic growth.
From the perspective of urban and rural areas, the per capita disposable income of urban residents was 24,125 yuan, an increase of 11.4 percent (unless otherwise specified below, it was the nominal growth rate on a year-on-year basis). After deducting the price factor, the actual growth rate was 10.7 percent; the per capita disposable income of rural residents was 9,248 yuan, an increase of 14.6 percent. After deducting the price factor, the actual increase was 14.1 percent.
In the first half of the year, the median per capita disposable income of Chinese residents was 14,897 yuan, an increase of 11.6 percent, and the median was 84.4 percent of the average. Among them, the median per capita disposable income of urban residents was 21,517 yuan, an increase of 9.7 percent, and the median was 89.2 percent of the average; the median per capita disposable income of rural residents was 7,956 yuan, an increase of 19.1 percent, and the median was 86.0 percent of the average.
According to the source of income, in the first half of the year, the per capita wage income of residents in China was 10,104 yuan, an increase of 12.1 percent, accounting for 57.3 percent of disposable income; the net operating income per capita was 2,752 yuan, an increase of 17.5 percent, accounting for 15.6 percent of disposable income; the net income of per capita property was 1,582 yuan, an increase of 15.0 percent, accounting for 9.0 percent of disposable income; the net transfer income per capita was 3,204 yuan, an increase of 9.0 percent, accounting for 18.2 percent of disposable income.
II. Consumption Expenditure of Households
In the first half of the year, the per capita consumption expenditure of residents in China was 11,471 yuan, a nominal increase of 18.0 percent over the same period of last year. After deducting the price factor, the actual increase was 17.4 percent, an increase of 11.0 percent over the first half of 2019, an average increase of 5.4 percent in two years, and an average real increase of 3.2 percent after deducting the price factor.
In terms of urban and rural areas, the per capita consumption expenditure of urban residents was 14,566 yuan, an increase of 16.7 percent. After deducting the price factor, the actual increase was 16.0 percent; the per capita consumption expenditure of rural residents was 7,464 yuan, an increase of 20.2 percent. After deducting the price factor, the actual increase was 19.7 percent.
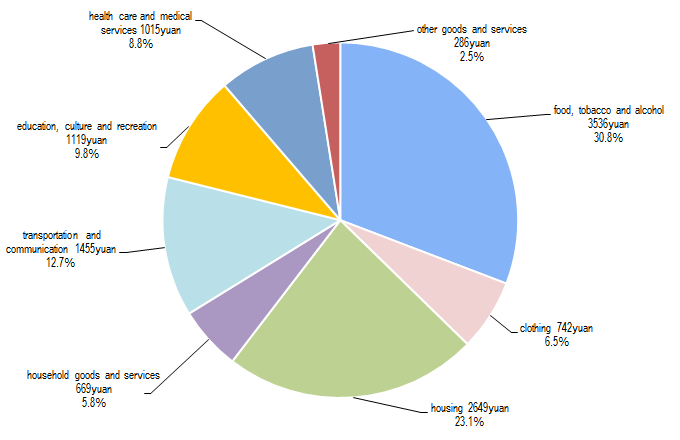
In the first half of the year, the per capita consumption expenditure of food, tobacco and alcohol was 3,536 yuan, an increase of 14.2 percent, accounting for 30.8 percent of the per capita consumption expenditure; the per capita clothing consumption expenditure was 742 yuan, an increase of 21.4 percent, accounting for 6.5 percent of the per capita consumption expenditure; the per capita residential consumption expenditure was 2,649 yuan, an increase of 7.5 percent, accounting for 23.1 percent of the per capita consumption expenditure; the per capita consumption expenditure on daily necessities and services was 669 yuan, up 15.1 percent, accounting for 5.8 percent of the per capita consumption expenditure; the per capita consumption expenditure on transportation and communication was 1,455 yuan, an increase of 17.5 percent, accounting for 12.7 percent of the per capita consumption expenditure; the per capita consumption expenditure on education, culture and entertainment was 1,119 yuan, up 68.5 percent, accounting for 9.8 percent of the per capita consumption expenditure; the per capita health care consumption expenditure was 1,015 yuan, an increase of 19.7 percent, accounting for 8.8 percent of the per capita consumption expenditure; the per capita consumption expenditure on other goods and services was 286 yuan, an increase of 33.0 percent, accounting for 2.5 percent of the per capita consumption expenditure.
| Table 1 Income and Expenditure Nationwide in the First Half Year of 2021 |
| ||||||||||||||||||||||||||||||||||||||||||||||||||||||||||||||||||||||||||||||||||||||||||||||||||||||||||||||||||||||||||||||||||||||||||||||||||||||||||||||||||||||||||||||||||||||||||||||||||||||||||||||||||||||||||||||||||
| Item | Absolute Value ( yuan) | Y/Y(%) |
| ||||||||||||||||||||||||||||||||||||||||||||||||||||||||||||||||||||||||||||||||||||||||||||||||||||||||||||||||||||||||||||||||||||||||||||||||||||||||||||||||||||||||||||||||||||||||||||||||||||||||||||||||||||||||||||||||
| | | | | |
| ||||||||||||||||||||||||||||||||||||||||||||||||||||||||||||||||||||||||||||||||||||||||||||||||||||||||||||||||||||||||||||||||||||||||||||||||||||||||||||||||||||||||||||||||||||||||||||||||||||||||||||||||||||||||||||||
| Total Per Capita Income Nationwide | 17642 | 12.6(12.0) | |||||||||||||||||||||||||||||||||||||||||||||||||||||||||||||||||||||||||||||||||||||||||||||||||||||||||||||||||||||||||||||||||||||||||||||||||||||||||||||||||||||||||||||||||||||||||||||||||||||||||||||||||||||||||||||||||
| Grouped by Permanent Residence | | | |||||||||||||||||||||||||||||||||||||||||||||||||||||||||||||||||||||||||||||||||||||||||||||||||||||||||||||||||||||||||||||||||||||||||||||||||||||||||||||||||||||||||||||||||||||||||||||||||||||||||||||||||||||||||||||||||
| Urban Households | 24125 | 11.4(10.7) | |||||||||||||||||||||||||||||||||||||||||||||||||||||||||||||||||||||||||||||||||||||||||||||||||||||||||||||||||||||||||||||||||||||||||||||||||||||||||||||||||||||||||||||||||||||||||||||||||||||||||||||||||||||||||||||||||
| Rural Households | 9248 | 14.6(14.1) | |||||||||||||||||||||||||||||||||||||||||||||||||||||||||||||||||||||||||||||||||||||||||||||||||||||||||||||||||||||||||||||||||||||||||||||||||||||||||||||||||||||||||||||||||||||||||||||||||||||||||||||||||||||||||||||||||
| Grouped by Income Source | | | |||||||||||||||||||||||||||||||||||||||||||||||||||||||||||||||||||||||||||||||||||||||||||||||||||||||||||||||||||||||||||||||||||||||||||||||||||||||||||||||||||||||||||||||||||||||||||||||||||||||||||||||||||||||||||||||||
| Income of Wages and Salaries | 10104 | 12.1 | |||||||||||||||||||||||||||||||||||||||||||||||||||||||||||||||||||||||||||||||||||||||||||||||||||||||||||||||||||||||||||||||||||||||||||||||||||||||||||||||||||||||||||||||||||||||||||||||||||||||||||||||||||||||||||||||||
| Net Business Income | 2752 | 17.5 | |||||||||||||||||||||||||||||||||||||||||||||||||||||||||||||||||||||||||||||||||||||||||||||||||||||||||||||||||||||||||||||||||||||||||||||||||||||||||||||||||||||||||||||||||||||||||||||||||||||||||||||||||||||||||||||||||
| Net Income from Property | 1582 | 15.0 | |||||||||||||||||||||||||||||||||||||||||||||||||||||||||||||||||||||||||||||||||||||||||||||||||||||||||||||||||||||||||||||||||||||||||||||||||||||||||||||||||||||||||||||||||||||||||||||||||||||||||||||||||||||||||||||||||
| Net Income from Transfer | 3204 | 9.0 | |||||||||||||||||||||||||||||||||||||||||||||||||||||||||||||||||||||||||||||||||||||||||||||||||||||||||||||||||||||||||||||||||||||||||||||||||||||||||||||||||||||||||||||||||||||||||||||||||||||||||||||||||||||||||||||||||
| Total Per Capita Income Nationwide Median | 14897 | 11.6 | |||||||||||||||||||||||||||||||||||||||||||||||||||||||||||||||||||||||||||||||||||||||||||||||||||||||||||||||||||||||||||||||||||||||||||||||||||||||||||||||||||||||||||||||||||||||||||||||||||||||||||||||||||||||||||||||||
| Grouped by Permanent Residence | | | |||||||||||||||||||||||||||||||||||||||||||||||||||||||||||||||||||||||||||||||||||||||||||||||||||||||||||||||||||||||||||||||||||||||||||||||||||||||||||||||||||||||||||||||||||||||||||||||||||||||||||||||||||||||||||||||||
| Urban Households | 21517 | 9.7 | |||||||||||||||||||||||||||||||||||||||||||||||||||||||||||||||||||||||||||||||||||||||||||||||||||||||||||||||||||||||||||||||||||||||||||||||||||||||||||||||||||||||||||||||||||||||||||||||||||||||||||||||||||||||||||||||||
| Rural Households | 7956 | 19.1 | |||||||||||||||||||||||||||||||||||||||||||||||||||||||||||||||||||||||||||||||||||||||||||||||||||||||||||||||||||||||||||||||||||||||||||||||||||||||||||||||||||||||||||||||||||||||||||||||||||||||||||||||||||||||||||||||||
| Total Per Capita Expenditure Nationwide | 11471 | 18.0(17.4) | |||||||||||||||||||||||||||||||||||||||||||||||||||||||||||||||||||||||||||||||||||||||||||||||||||||||||||||||||||||||||||||||||||||||||||||||||||||||||||||||||||||||||||||||||||||||||||||||||||||||||||||||||||||||||||||||||
| Grouped by Permanent Residence | | | |||||||||||||||||||||||||||||||||||||||||||||||||||||||||||||||||||||||||||||||||||||||||||||||||||||||||||||||||||||||||||||||||||||||||||||||||||||||||||||||||||||||||||||||||||||||||||||||||||||||||||||||||||||||||||||||||
| Urban Households | 14566 | 16.7(16.0) | |||||||||||||||||||||||||||||||||||||||||||||||||||||||||||||||||||||||||||||||||||||||||||||||||||||||||||||||||||||||||||||||||||||||||||||||||||||||||||||||||||||||||||||||||||||||||||||||||||||||||||||||||||||||||||||||||
| Rural Households | 7464 | 20.2(19.7) | |||||||||||||||||||||||||||||||||||||||||||||||||||||||||||||||||||||||||||||||||||||||||||||||||||||||||||||||||||||||||||||||||||||||||||||||||||||||||||||||||||||||||||||||||||||||||||||||||||||||||||||||||||||||||||||||||
| Grouped by Consumption Category | | | |||||||||||||||||||||||||||||||||||||||||||||||||||||||||||||||||||||||||||||||||||||||||||||||||||||||||||||||||||||||||||||||||||||||||||||||||||||||||||||||||||||||||||||||||||||||||||||||||||||||||||||||||||||||||||||||||
| Food, tobacco and liquor | 3536 | 14.2 | |||||||||||||||||||||||||||||||||||||||||||||||||||||||||||||||||||||||||||||||||||||||||||||||||||||||||||||||||||||||||||||||||||||||||||||||||||||||||||||||||||||||||||||||||||||||||||||||||||||||||||||||||||||||||||||||||
| Clothing | 742 | 21.4 | |||||||||||||||||||||||||||||||||||||||||||||||||||||||||||||||||||||||||||||||||||||||||||||||||||||||||||||||||||||||||||||||||||||||||||||||||||||||||||||||||||||||||||||||||||||||||||||||||||||||||||||||||||||||||||||||||
| Residence | 2649 | 7.5 | |||||||||||||||||||||||||||||||||||||||||||||||||||||||||||||||||||||||||||||||||||||||||||||||||||||||||||||||||||||||||||||||||||||||||||||||||||||||||||||||||||||||||||||||||||||||||||||||||||||||||||||||||||||||||||||||||
| Household facilities, articles and services | 669 | 15.1 | |||||||||||||||||||||||||||||||||||||||||||||||||||||||||||||||||||||||||||||||||||||||||||||||||||||||||||||||||||||||||||||||||||||||||||||||||||||||||||||||||||||||||||||||||||||||||||||||||||||||||||||||||||||||||||||||||
| Transportation and telecommunication | 1455 | 17.5 | |||||||||||||||||||||||||||||||||||||||||||||||||||||||||||||||||||||||||||||||||||||||||||||||||||||||||||||||||||||||||||||||||||||||||||||||||||||||||||||||||||||||||||||||||||||||||||||||||||||||||||||||||||||||||||||||||
| Education, culture and recreation | 1119 | 68.5 | |||||||||||||||||||||||||||||||||||||||||||||||||||||||||||||||||||||||||||||||||||||||||||||||||||||||||||||||||||||||||||||||||||||||||||||||||||||||||||||||||||||||||||||||||||||||||||||||||||||||||||||||||||||||||||||||||
| Health care and medical services | 1015 | 19.7 | |||||||||||||||||||||||||||||||||||||||||||||||||||||||||||||||||||||||||||||||||||||||||||||||||||||||||||||||||||||||||||||||||||||||||||||||||||||||||||||||||||||||||||||||||||||||||||||||||||||||||||||||||||||||||||||||||
| Miscellaneous goods and services | 286 | 33.0 | |||||||||||||||||||||||||||||||||||||||||||||||||||||||||||||||||||||||||||||||||||||||||||||||||||||||||||||||||||||||||||||||||||||||||||||||||||||||||||||||||||||||||||||||||||||||||||||||||||||||||||||||||||||||||||||||||
| | | | |||||||||||||||||||||||||||||||||||||||||||||||||||||||||||||||||||||||||||||||||||||||||||||||||||||||||||||||||||||||||||||||||||||||||||||||||||||||||||||||||||||||||||||||||||||||||||||||||||||||||||||||||||||||||||||||||
| Notes:
| |||||||||||||||||||||||||||||||||||||||||||||||||||||||||||||||||||||||||||||||||||||||||||||||||||||||||||||||||||||||||||||||||||||||||||||||||||||||||||||||||||||||||||||||||||||||||||||||||||||||||||||||||||||||||||||||||||
| |||||||||||||||||||||||||||||||||||||||||||||||||||||||||||||||||||||||||||||||||||||||||||||||||||||||||||||||||||||||||||||||||||||||||||||||||||||||||||||||||||||||||||||||||||||||||||||||||||||||||||||||||||||||||||||||||||
1. Explanatory Notes
Disposable income of Households refers to the sum of final consumption expenditure and savings that residents can use, that is, the income that residents can use for free disposal, including both cash income and physical income. According to the source of income, disposable income includes wage and salary income, net business income, net property income and net transfer income.
Consumer spending refers to all the expenditures that residents use to meet their daily needs, including both cash and physical consumption. Consumer spending includes eight categories: food, tobacco and alcohol, clothing, housing, daily necessities and services, transportation and communication, education, culture and recreation, medical care and other supplies and services.
The median of the nationwide per capita disposable income of households refers to the per capita disposable income of households which lies in the middle of all surveyed households ranked from low to high on the basis of per capita disposable income level.
The quarterly income and expenditure data do not include the income and consumption of the self-produced and self-used parts of households, and the annual income and expenditure data includes.
The two-year average growth rate refers to the growth rate calculated by geometric average method based on the corresponding number of the same period in 2019.
2. Survey Methods
The national and sub urban and rural households' income and expenditure data comes from the household income and expenditure and living conditions survey organized and implemented by the National Bureau of Statistics, which is released quarterly.
Using stratified, multi-stage, probability sampling method proportional to the size of population, the National Bureau of Statistics randomly selected 160000 households in 1800 counties (cities, districts) of 31 provinces (regions, cities) as survey households.
According to the unified system and method, the survey organizations directly under the National Bureau of statistics will organize the household to record and collect the data of households' income, expenditure, family operation, production and investment; meanwhile, according to the unified questionnaire, collect other surveys such as the employment of household members and labor force, the ownership of housing and durable consumer goods, and the enjoyment of households' basic social and public services. After the completion of data collection, the municipal and county survey organizations use unified methods and data processing procedures to code, review and input the original investigation data, and then directly transmit the basic household data to the National Bureau of Statistics for unified summary and calculation.