Energy production in June of 2021
In June, the production of raw coal above designated size industries decreased year-on-year, the growth rate of natural gas production accelerated, and the growth rate of crude oil and power production fell slightly. Taking June 2019 as the base period, the average growth rate of raw coal production in two years decreased, natural gas production increased rapidly, and crude oil and power production increased steadily.
I. Raw Coal, Crude Oil and Natural Gas Production and Relevant Information
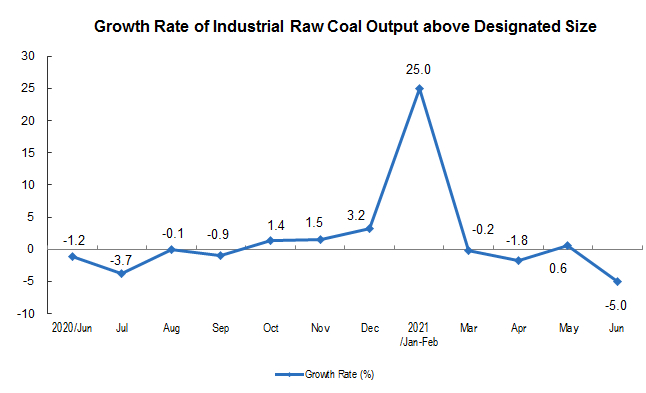
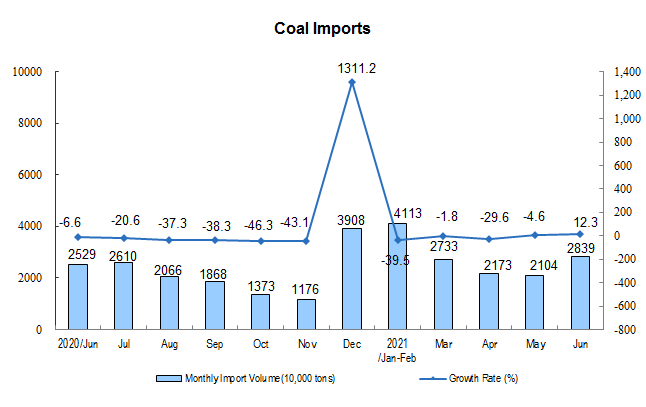
Raw coal production decreased. In June, 320 million tons of raw coal were produced, a year-on-year decrease of 5.0 percent, a year-on-year decrease of 6.1 percent over the same period in 2019, an average decrease of 3.1 percent in two years, and an average daily output of 10.77 million tons; the imported coal was 28.39 million tons, a year-on-year increase of 12.3 percent.
From January to June, 1.95 billion tons of raw coal were produced, with a year-on-year growth of 6.4 percent, a year-on-year growth of 7.1 percent over the same period in 2019, and an average growth of 3.5 percent in two years; the imported coal was 139.56 million tons, a year-on-year decrease of 19.7 percent.
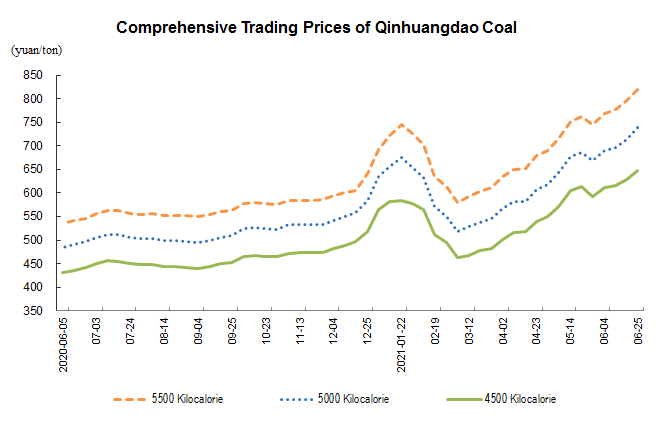
The comprehensive trading price of port coal continued to rise. On June 25, the comprehensive transaction prices of 5500, 5000 and 4500 kcal steam coal in Qinhuangdao Port were 819, 739 and 648 yuan per ton respectively, up 51, 49 and 37 yuan respectively from June 4.
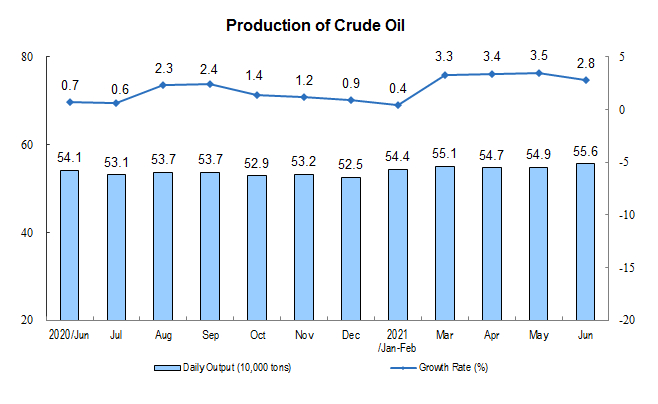
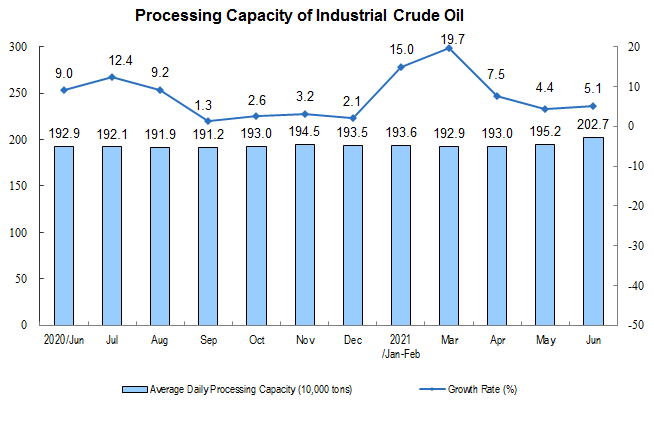
Crude oil production slowed down slightly and processing capacity increased steadily. In June, it produced 16.67 million tons of crude oil, a year-on-year increase of 2.8 percent, a year-on-year increase of 3.5 percent over the same period in 2019, an average increase of 1.7 percent in two years, and an average daily output of 556,000 tons; crude oil processing was 60.82 million tons, a year-on-year increase of 5.1 percent, an increase of 14.5 percent over the same period in 2019, an average increase of 7.0 percent in two years, and an average daily processing of 2.027 million tons.
From January to June, 99.32 million tons of crude oil were produced, a year-on-year increase of 2.4 percent, a year-on-year increase of 4.1 percent over the same period in 2019, and an average increase of 2.0 percent in two years; the crude oil processed was 353.35 million tons, with a year-on-year growth of 10.7 percent, an increase of 11.4 percent over the same period in 2019, and an average growth of 5.5 percent in two years.
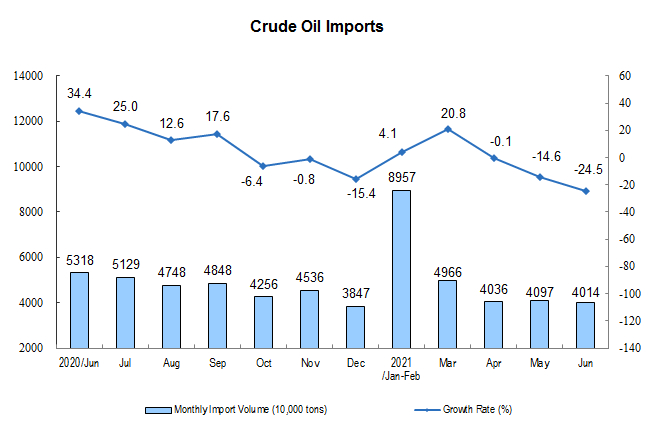
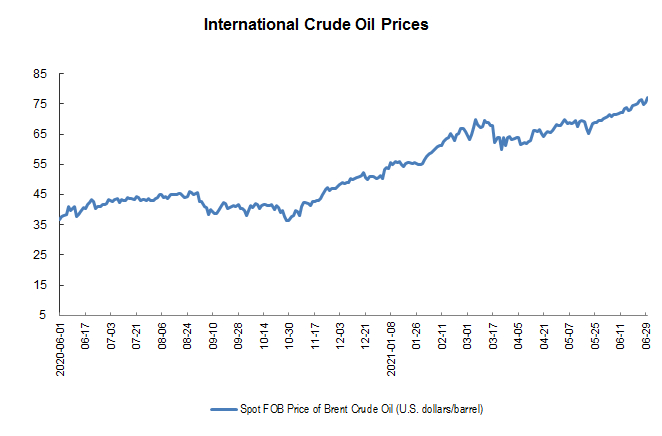
The decline in crude oil imports had expanded, and international crude oil prices continue to rise. In June, the import of crude oil was 40.14 million tons, a year-on-year decrease of 24.5 percent; from January to June, the import of crude oil was 260.66 million tons, a year-on-year decrease of 3.0 percent. On June 30, the spot FOB price of Brent crude oil was 76.94 USD per barrel, up 9.9 percent from 70.03 USD per barrel on June 1.
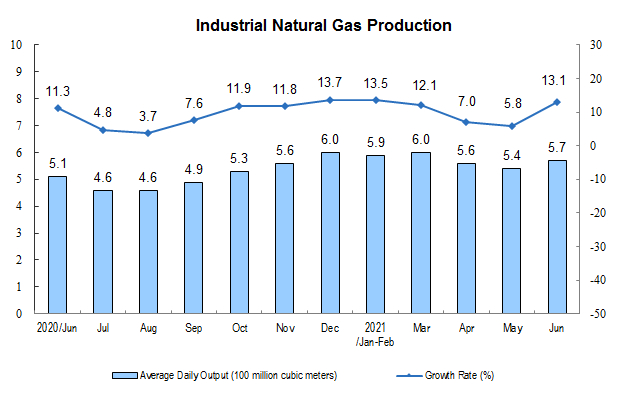
The growth rate of natural gas production accelerated. In June, 17.2 billion cubic meters of natural gas were produced, a year-on-year increase of 13.1 percent, a year-on-year increase of 25.9 percent over the same period in 2019, an average increase of 12.2 percent in two years, and an average daily output of 570 million cubic meters.
From January to June, 104.5 billion cubic meters of natural gas were produced, a year-on-year increase of 10.9 percent, a 22.2 percent increase over the same period in 2019, and an average increase of 10.6 percent in two years.
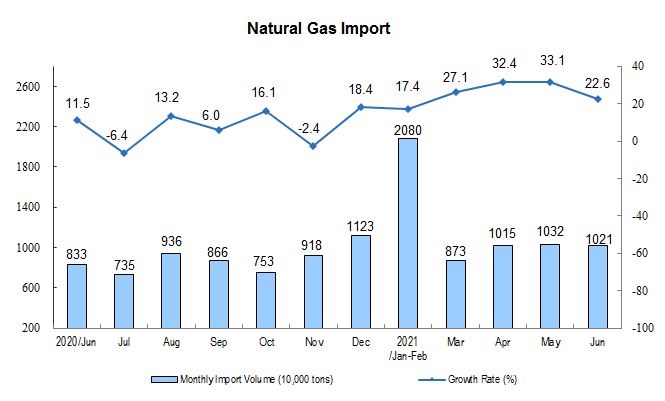
Natural gas imports grew rapidly. In June, 10.21 million tons of natural gas were imported, up 22.6 percent year on year. From January to June, 59.82 million tons of natural gas were imported, a year-on-year increase of 23.8 percent.
II. Electric Power Production
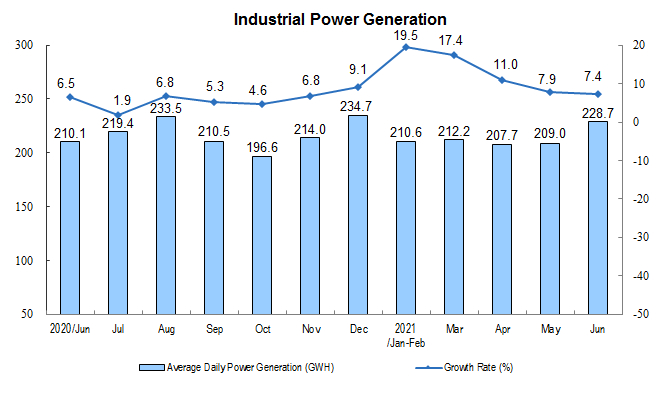
The growth rate of electric power production dropped slightly. In June, 686 billion kwh of electricity was generated, an increase of 7.4 percent over the same period last year, an increase of 14.5 percent over the same period of 2019, an average increase of 7.0 percent in two years, and an average daily power generation of 22.87 billion kwh. From January to June, 3,871.7 billion kwh of electricity was generated, up 13.7 percent year on year, 12.1 percent over the same period in 2019, and 5.9 percent on average in two years.
In terms of varieties, thermal power, nuclear power and solar power all grew rapidly in June, while the growth rate of hydropower turned from positive to negative, while the growth rate of wind power dropped. Among them, thermal power increased by 10.1 percent on a year-on-year basis, taking June 2019 as the base period, with an average growth of 7.7 percent in two years; hydropower decreased by 5.6 percent, with an average growth of 0.5 percent in two years; nuclear power increased by 12.9 percent, with an average growth of 13.3 percent in two years; wind power increased by 12.4 percent, with an average growth of 14.1 percent in two years; solar power generation grew by 12.5 percent, with an average growth of 9.1 percent in two years.
Annotations:
1. Explanatory Notes
Average daily product output: It is calculated by dividing the total output of Industrial Enterprises above the designated size announced in that month by the calendar days of that month.
2. Statistical Coverage
The statistical caliber of the output data in the report is above the designated size of industry, and the statistical scope is industrial enterprises with annual main business income of more than 20 million yuan.
Because the scope of Industrial Enterprises above the designated size changes every year, in order to ensure that this year's data is comparable with the previous year's, the same period used to calculate the growth rate of various indicators such as product output is consistent with the statistical scope of enterprises in this period, and there is a caliber difference between the data released last year.
3. Data Source
Import data comes from the General Administration of Customs, of which March data are express data; coal price data comes from China Coal Market Network; crude oil price data comes from the United States Energy Information Agency (EIA).
4. Conversion relationship of natural gas units: 1 ton is equal to 1380 cubic meters.
5. The two-year average growth rate refers to the growth rate calculated by geometric average method based on the corresponding number of the same period in 2019.