Industrial Production Operation in May 2021
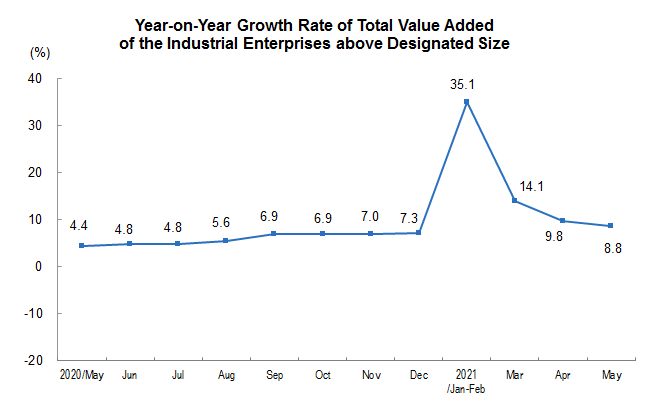
In May, the added value of industries above designated size increased by 8.8 percent year-on-year (the growth rate of added value below was the real growth rate after deducting the price factor), 13.6 percent higher than that of the same period in 2019, with an average growth of 6.6 percent in two years. On a month-on-month basis, in May, the added value of industries above designated size increased by 0.52 percent over the previous month. From January to May, the added value of industries above designated size increased by 17.8 percent year on year, with an average growth of 7.0 percent in two years.
In May, the added value of mining industry increased by 3.2 percent year on year; that of the manufacturing industry grew by 9.0 percent; and that of electricity, heat, gas and water production and supply increased by 11.0 percent.
In terms of economic types, the added value of state-owned holding enterprises increased by 7.7 percent year on year in May; that of joint stock enterprises increased by 8.9 percent, and that of foreign-funded enterprises and enterprises invested by Hong Kong, Macao and Taiwan increased by 8.5 percent; that of private enterprises increased by 9.1 percent.
In terms of industries, in May, the added value of 36 of 41 major industries maintained a year-on-year growth. Agricultural and sideline food processing industry increased by 7.3 percent, textile industry increased by 3.0 percent, chemical raw materials and chemical products manufacturing industry increased by 8.6 percent, non-metallic mineral products industry increased by 7.6 percent, ferrous metal smelting and processing industry increased by 7.7 percent, non-ferrous metal smelting and processing industry increased by 2.9 percent, general equipment manufacturing industry increased by 13.8 percent, special equipment manufacturing industry increased by 5.9 percent, automobile manufacturing industry increased by 0.5 percent, the railway, shipbuilding, aerospace and other transportation equipment manufacturing industry increased by 7.5 percent, the electrical machinery and equipment manufacturing industry increased by 18.7 percent, the computer, communication and other electronic equipment manufacturing industry increased by 12.7 percent, and the power and heat production and supply industry increased by 10.4 percent.
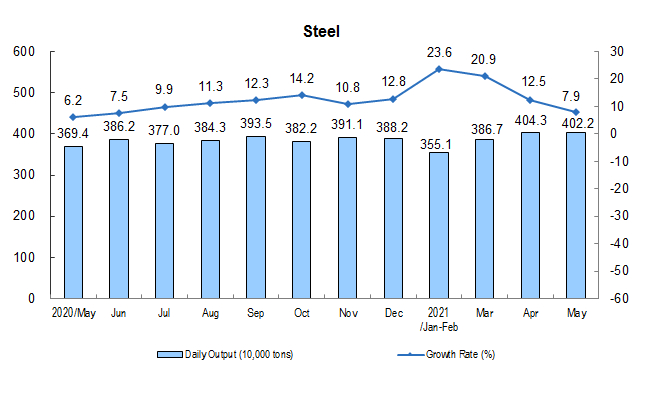
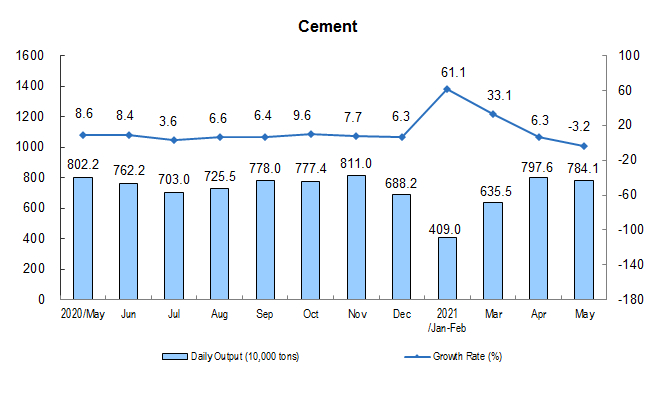
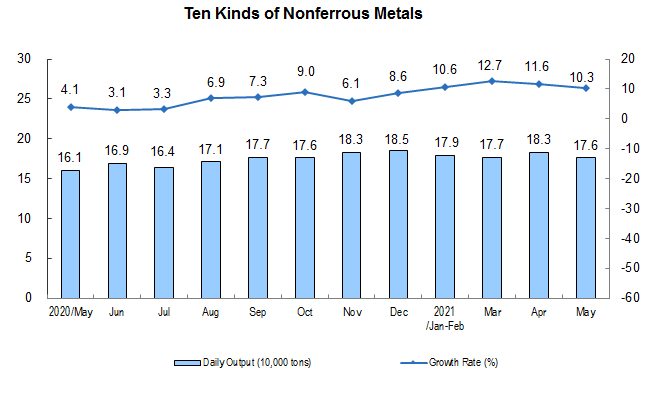
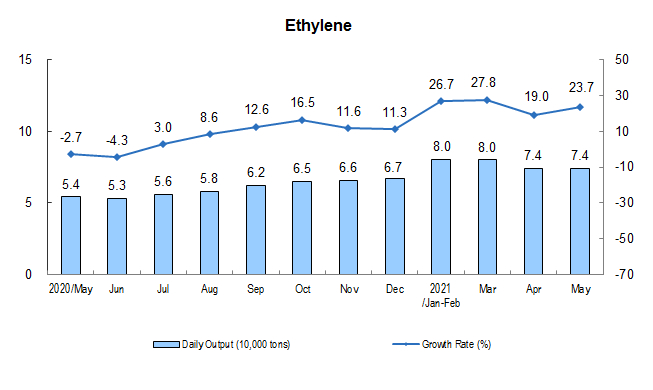
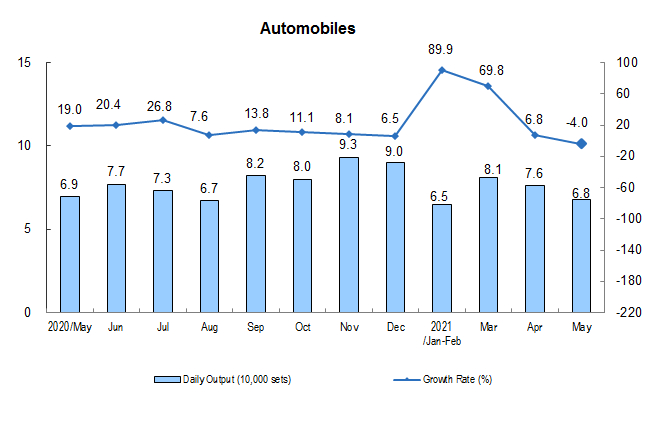
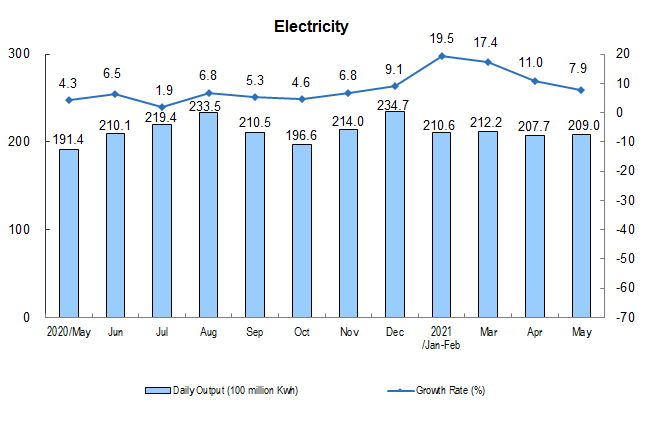
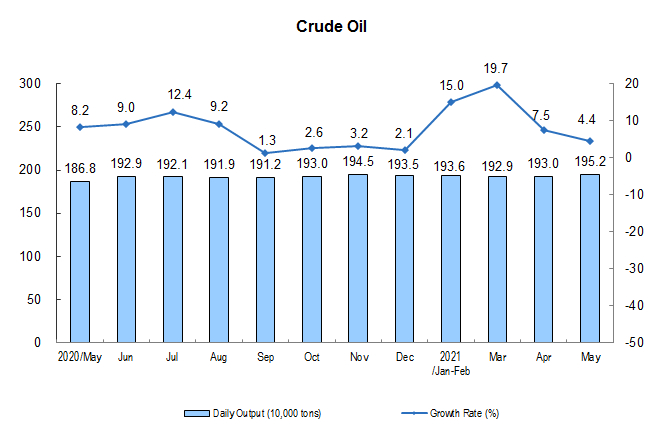
In terms of products, in May, 428 of 612 products increased year on year. 124.69 million tons of steel, a year-on-year increase of 7.9 percent; 243.07 million tons of cement, a decrease of 3.2 percent; 5.45 million tons of ten kinds of non-ferrous metals, an increase of 10.3 percent; 2.28 million tons of ethylene, an increase of 23.7 percent; 2.096 million sets of vehicles, a decrease of 4.0 percent, of which 237,000 new energy vehicles, an increase of 166.3 percent; power generation was 647.8 billion kwh, up 7.9 percent; crude oil processing capacity was 60.5 million tons, an increase of 4.4 percent.
In May, the product sales rate of industrial enterprises was 97.4 percent, down 0.4 percentage point year on year; the value of export delivery of industrial enterprises reached 1,132.6 billion yuan, a nominal increase of 16.9 percent year on year.
Industrial Production Operation of May 2021
| Indicators | May | Jan-May | ||
| Absolute Value | Increase rate Y/Y (%) | Absolute Value | Increase rate Y/Y (%) | |
| | | |||
| Value-added of Industry Above Designated Size | … | 8.8 | … | 17.8 |
| Grouped by Three Sectors | | | | |
| Mining and Quarrying | … | 3.2 | … | 7.4 |
| Manufacturing | … | 9.0 | … | 19.3 |
| Manufacture of high-tech industry | … | 17.5 | … | 23.8 |
| Production and Distribution of Electricity, Heating Power, Gas and Water | … | 11.0 | … | 13.8 |
| Grouped by Status of Registration | | | | |
| State-holding Enterprises | … | 7.7 | … | 13.4 |
| Joint-Stock Enterprises | … | 8.9 | … | 17.5 |
| Enterprises with Funds from Hong Kong, Macao and Taiwan, and Foreign Funded Enterprises | … | 8.5 | … | 19.7 |
| Private Enterprises | … | 9.1 | … | 20.4 |
| The Value-Added of the Main Industrial Sectors | | | | |
| Processing of Food from Agricultural Products | … | 7.3 | … | 10.9 |
| Manufacture of Foods | … | 3.6 | … | 10.7 |
| Manufacture of Textile | … | -3.0 | … | 10.8 |
| Manufacture of Chemical Raw Material and Chemical Products | … | 8.6 | … | 15.6 |
| Manufacture of Medicines | … | 34.0 | … | 28.4 |
| Manufacture of Rubber and Plastics Products | … | 5.1 | … | 20.2 |
| Manufacture of Nonmetal Mineral Products | … | 7.6 | … | 21.7 |
| Manufacture of Ferrous Metal Smelting and Pressing | … | 7.7 | … | 13.4 |
| Manufacture and Processing of Non-Ferrous Metals | … | 2.9 | … | 9.2 |
| Manufacture of Fabricated Metal Products | … | 19.2 | … | 30.5 |
| Manufacture of General Machinery | … | 13.8 | … | 27.2 |
| Manufacture of Special-Purpose Machinery | … | 5.9 | … | 22.6 |
| Manufacture of Motor Vehicles | … | 0.5 | … | 29.3 |
| Manufacture of Railways, Shipbuilding, Aerospace and Other Transportation Equipment | … | 7.5 | … | 17.9 |
| Manufacture of Electric Machinery and Equipment | … | 18.7 | … | 33.5 |
| Manufacture of Computer, Communication Equipment and Other Electronic Equipment | … | 12.7 | … | 21.5 |
| Production and Supply of Electric Power and Heat Power | … | 10.4 | … | 13.4 |
| Output of Major Products | | | | |
| Cloth (100 million meters) | 34 | 6.9 | 151 | 12.3 |
| Sulfuric Acid(100%) (10,000 tons) | 743 | 3.2 | 3838 | 11.2 |
| Caustic Soda(100%) (10,000 tons) | 319 | 4.6 | 1598 | 11.1 |
| Ethylene (10,000 tons) | 228 | 23.7 | 1167 | 25.7 |
| Chemical Fiber (10,000 tons) | 585 | 8.4 | 2755 | 19.2 |
| Cement (10,000 tons) | 24307 | -3.2 | 92242 | 19.2 |
| Plate Glass (10 000 weight boxes) | 8813 | 12.7 | 42191 | 10.9 |
| Pig Iron (10,000 tons) | 7815 | -0.2 | 37990 | 5.4 |
| Crude Steel (10,000 tons) | 9945 | 6.6 | 47310 | 13.9 |
| Steel Products (10,000 tons) | 12469 | 7.9 | 57657 | 16.8 |
| 10 Kinds Of Nonferrous Metals (10,000 tons) | 545 | 10.3 | 2695 | 11.6 |
| Of which: Primary Aluminium (Electrolytic Aluminium) (10,000 tons) | 332 | 11.3 | 1634 | 10.0 |
| Metal-Cutting Machine Tool (10,000 sets) | 6 | 31.8 | 25 | 48.8 |
| Industrial Robot (unit/set) | 29743 | 50.1 | 136405 | 73.2 |
| Automobile (10,000 sets) | 209.6 | -4.0 | 1075.2 | 38.4 |
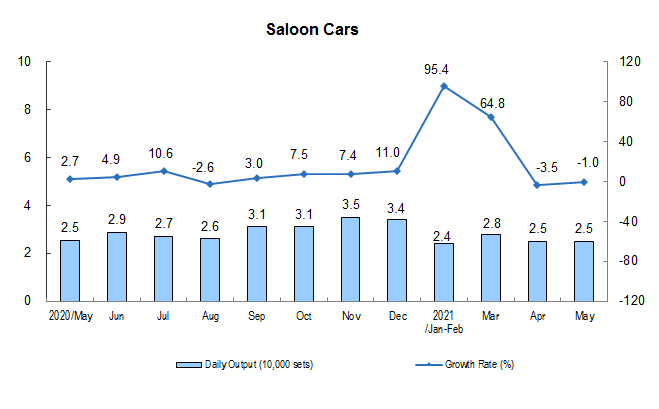
| Of which: Saloon cars (10,000 sets) | 78.0 | -1.0 | 381.9 | 36.9 |
| SUV(10,000 sets) | 71.5 | -2.1 | 384.4 | 41.2 |
| Of which: New Energy Automobile (10,000 sets) | 23.7 | 166.3 | 102 | 238.9 |
| Generator Set (Power Generating Equipment) (10,000 kWh) | 1288 | 10.9 | 5592 | 32.1 |
| Micro Computer Equipment (10,000 sets) | 3614 | 10.8 | 17890 | 47.3 |
| Mobile Phone (10,000 sets) | 13235 | 16.9 | 60662 | 27.8 |
| Of which: Smartphone (10,000 sets) | 10273 | 9.6 | 46269 | 24.1 |
| Integrated Circuit (100 ,000,000 pcs) | 299 | 37.6 | 1399 | 48.3 |
| Raw Coal (10,000 tons) | 32629 | 0.6 | 162100 | 8.8 |
| Coke (10,000 tons) | 3915 | 0.3 | 19818 | 5.9 |
| Crude Oil (10,000 tons) | 1703 | 3.5 | 8265 | 2.2 |
| Crude Processing Volume (10,000 tons) | 6050 | 4.4 | 29274 | 12.0 |
| Natural Gas (100 million Cubic Meters) | 169 | 5.8 | 872 | 10.3 |
| Electricity (100 million kWh) | 6478 | 7.9 | 31772 | 14.9 |
| Thermal Power | 4507 | 5.6 | 23417 | 16.0 |
| Hydro-electric Power | 956 | 12.1 | 3685 | 3.8 |
| Nuclear Power | 343 | 10.2 | 1592 | 13.9 |
| Wind Power | 507 | 20.7 | 2382 | 26.7 |
| Solar Power | 166 | 8.7 | 695 | 7.9 |
| Sales Ratio (%) | 97.4 | -0.4(percentage point) | 97.7 | 0.3(percentage point) |
| Export Delivery Value (100 million yuan) | 11326 | 16.9 | 54463 | 24.9 |
| | | |||
Annotations:
1. Explanation of Indicator.
Growth rate of value added of the industrial enterprises: also known as industrial growth rate, which is used to reflect a certain period of increase or decrease in volume of industrial production indicators of the degree of change. The indicator can be used to estimate the short-term trend of the industrial economy, to judge the extent of the economic boom, and also to be an important reference and basis for the formulation and adjustment of economic policies, and for the implementation of macroeconomic adjustment and control.
Sales ratio: refers to sale value and industrial output value, which reflecting the situation between production and sales of industrial products.
Export delivery value: refers to the foreign trade department of industrial enterprises or self-run (commission) exports (including sold in Hong Kong, Macao and Taiwan), with the price of foreign exchange settlement of product value, and foreign samples, materials processing, component assembly and compensation trade product value.
Daily product output: the total production of the total value added of the industrial enterprises above designated size in the current month divided by number of days in the month.
Two years average growth rate: it refers to the growth rate calculated by geometric average method with the corresponding number of the same period in 2019 as the base.
2. Statistical Coverage.
The standard starting point of industrial enterprises above designated size was 20 million yuan of annual revenue from primary business.
Due to the annual changes of the coverage of industrial enterprises above designated size, and in order to ensure that the data for this year is comparable with that of the previous year, the data of the corresponding period used for calculating the year-on-year growth rates of various indicators such as product output is as consistent with the enterprise statistical coverage of the current period as possible, and there is a difference in caliber from the data published last year. The main reasons are: (1) Coverage changes of statistical units. Each year, some companies will be included in the survey after having reached requisite size, and some will exit the survey due to their smaller size, and there are also influence of new built and starting enterprises, bankruptcies, and companies that have been suspended or sold. (2) There is cross-regional repeated calculation in the output data of some enterprise group (company) products, which has been eliminated according to specific surveys.
3. Survey Methods.
The reports of industrial enterprises above designated size are conducted with complete survey on a monthly basis (Not report for January).
4. Standard on industrial classification
NBS enforces New Standard on Industrial Classification for National Economic Activities" (GB/T 4754-2017). For details, please refer the following link: http://www.stats.gov.cn/tjsj/tjbz/hyflbz.
5. Revision on month-on-month data
The month-on-month growth rate of the total value added of the industrial enterprises above designated size from May 2020 to April 2021 was revised according to the results of automatic revision of seasonal adjustment model. The results are as follows:
| The Month-on-Month Growth Rate of Industrial Production Operation | |
| Months | Growth Rate (%) |
| | |
| 2020-May | 1.25 |
| June | 1.29 |
| July | 0.90 |
| August | 1.02 |
| September | 1.08 |
| October | 0.79 |
| November | 0.60 |
| December | 0.65 |
| 2021-January | 0.66 |
| February | 0.69 |
| March | 0.60 |
| April | 0.52 |
| May | 0.52 |
| | |