Communiqué of the Seventh National Population Census (No. 4)
Communiqué of the Seventh National Population Census[1] (No. 4)
-Sex Composition
National Bureau of Statistics of China
Office of the Leading Group of the State Council
for the Seventh National Population Census
May 11, 2021
Based on the results of the Seventh National Population Census, released as follows are the information of sex composition in 31 provinces, autonomous regions and municipalities directly under the central government (hereinafter referred to as provinces) and the servicemen of the Chinese mainland at 00:00 hours of November 1, 2020.
I. Sex Composition of the National Population
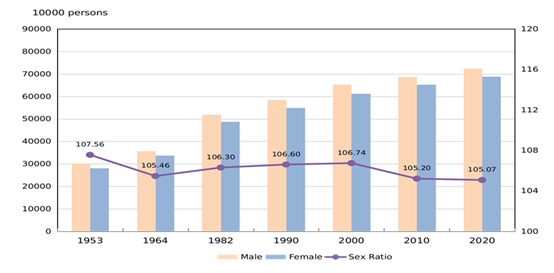
Of the national population[2], 723339956 persons or 51.24 percent were males, while 688438768 persons or 48.76 percent were females. The sex ratio (female=100, male to female) was 105.07, basically the same as the result of the Sixth National Population Census in 2010.
Figure 4-1 Sex Composition of the National Population
in Each Census
II. Sex Composition by Region
Among 31 provinces, there are 2 provinces with a sex ratio below 100, 17 provinces between 100 and 105, 9 provinces between 105 and 110, and 3 provinces above 110.
Table 4-1 Sex Composition by Region
Unit: Percent
| Region | Proportion | sex ratio | |
| Male | Female | ||
|
|
|
|
|
| National | 51.24 | 48.76 | 105.07 |
| Beijing | 51.14 | 48.86 | 104.65 |
| Tianjin | 51.53 | 48.47 | 106.31 |
| Hebei | 50.50 | 49.50 | 102.02 |
| Shanxi | 50.99 | 49.01 | 104.06 |
| Inner Mongolia | 51.04 | 48.96 | 104.26 |
| Liaoning | 49.92 | 50.08 | 99.70 |
| Jilin | 49.92 | 50.08 | 99.69 |
| Heilongjiang | 50.09 | 49.91 | 100.35 |
| Shanghai | 51.77 | 48.23 | 107.33 |
| Jiangsu | 50.78 | 49.22 | 103.15 |
| Zhejiang | 52.16 | 47.84 | 109.04 |
| Anhui | 50.97 | 49.03 | 103.94 |
| Fujian | 51.68 | 48.32 | 106.94 |
| Jiangxi | 51.60 | 48.40 | 106.62 |
| Shandong | 50.66 | 49.34 | 102.67 |
| Henan | 50.15 | 49.85 | 100.60 |
| Hubei | 51.42 | 48.58 | 105.83 |
| Hunan | 51.16 | 48.84 | 104.77 |
| Guangdong | 53.07 | 46.93 | 113.08 |
| Guangxi | 51.70 | 48.30 | 107.04 |
| Hainan | 53.02 | 46.98 | 112.86 |
| Chongqing | 50.55 | 49.45 | 102.21 |
| Sichuan | 50.54 | 49.46 | 102.19 |
| Guizhou | 51.10 | 48.90 | 104.50 |
| Yunnan | 51.73 | 48.27 | 107.16 |
| Tibet | 52.45 | 47.55 | 110.32 |
| Shaanxi | 51.17 | 48.83 | 104.79 |
| Gansu | 50.76 | 49.24 | 103.10 |
| Qinghai | 51.21 | 48.79 | 104.97 |
| Ningxia | 50.94 | 49.06 | 103.83 |
| Xinjiang | 51.66 | 48.34 | 106.85 |
|
|
|
|
|
Notes:
1. All figures in the Communiqué are preliminary results.
2. The national population refers to the population of the 31 provinces, autonomous regions and municipalities directly under the central government and servicemen of the Chinese mainland, excluding residents of Hong Kong, Macao and Taiwan and foreigners living in the 31 provinces, autonomous regions and municipalities directly under the central government.
(In case of any difference between English translation and the original Chinese text, the Chinese edition shall prevail.)