Energy production in March of 2021
In March, the production of raw coal above designated size decreased slightly, the production of crude oil increased steadily, and the production of natural gas and electric power maintained rapid growth. Taking March 2019 as the base period, the average growth of raw coal, crude oil and power production in two years was relatively stable, while the growth of natural gas production was relatively fast.
I. Raw Coal, Crude Oil and Natural Gas Production and Relevant Information
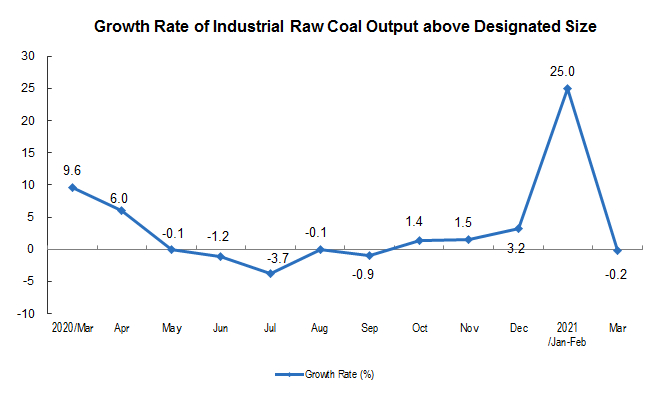
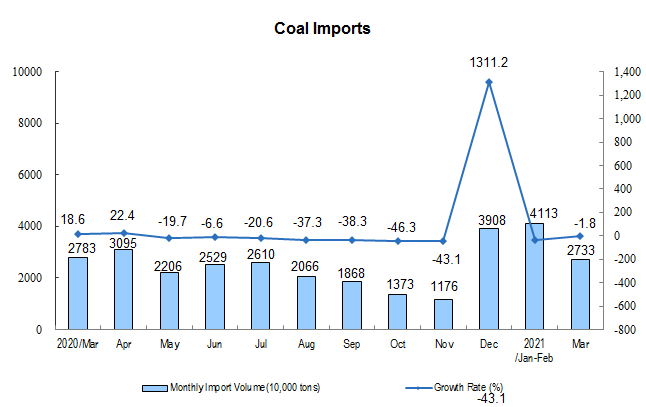
Raw coal production decreased slightly. In March, 340 million tons of raw coal were produced, a year-on-year decrease of 0.2 percent, an increase of 9.4 percent over March 2019, an average increase of 4.6 percent in two years, and an average daily output of 10.99 million tons; 27.33 million tons of coal were imported, a year-on-year decrease of 1.8 percent.
In the first quarter, 970 million tons of raw coal were produced, a year-on-year increase of 16.0 percent, a year-on-year increase of 15.4 percent over the first quarter of 2019, and a two-year average increase of 7.4 percent; 68.46 million tons of coal were imported, a year-on-year decrease of 28.5 percent.
The comprehensive trading price of port coal had increased. On April 2, the prices of 5500, 5000 and 4500 kcal coal in Qinhuangdao Port were 634, 567 and 502 yuan per ton respectively, up 54, 49 and 39 yuan respectively from March 5.

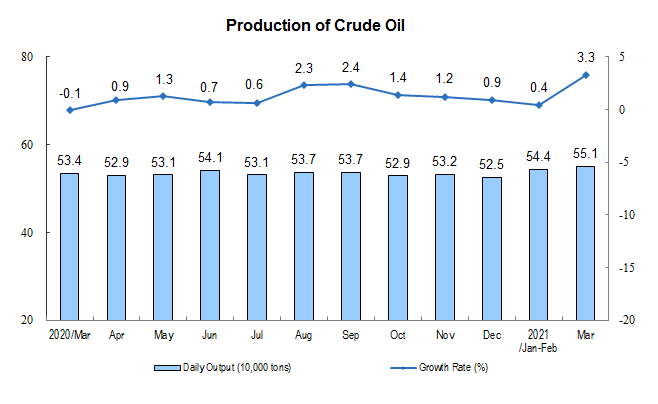
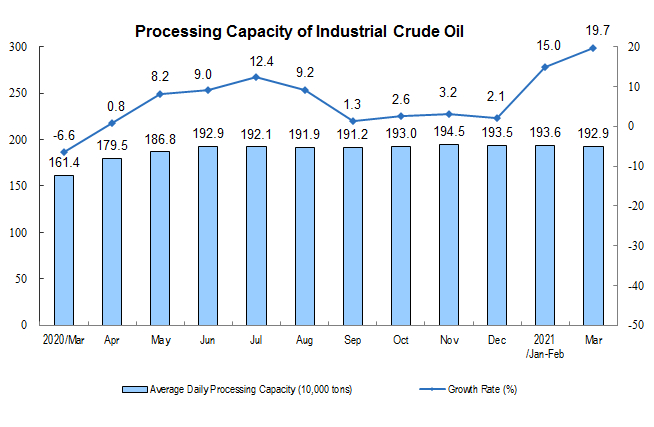
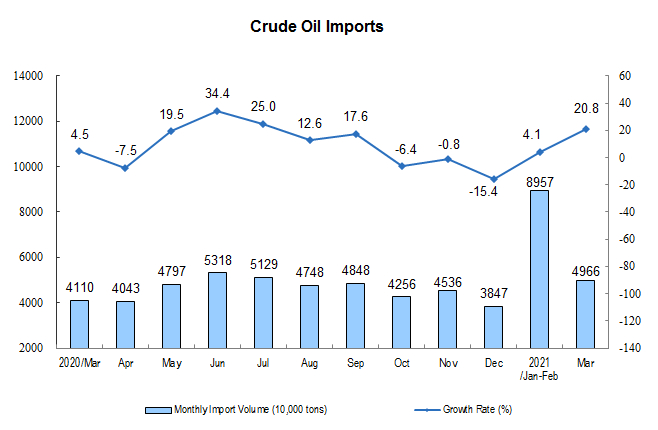
Crude oil production accelerated, and the processing capacity increased rapidly. In March, 17.09 million tons of crude oil were produced, with a year-on-year growth of 3.3 percent, an increase of 3.3 percent over March 2019, an average growth of 1.6 percent in two years, and an average daily output of 551,000 tons. The crude oil processed was 59.79 million tons, a year-on-year increase of 19.7 percent, an increase of 11.8 percent over March 2019, and an average increase of 5.8 percent in two years, with an average daily processing of 1.929 million tons.
In the first quarter, 49.18 million tons of crude oil were produced, with a year-on-year growth of 1.4 percent, 3.8 percent over the first quarter of 2019 and an average growth of 1.9 percent over the two years; 174.04 million tons of crude oil were processed, with a year-on-year growth of 16.5 percent, 11.1 percent over the first quarter of 2019 and an average growth of 5.4 percent over the two years.
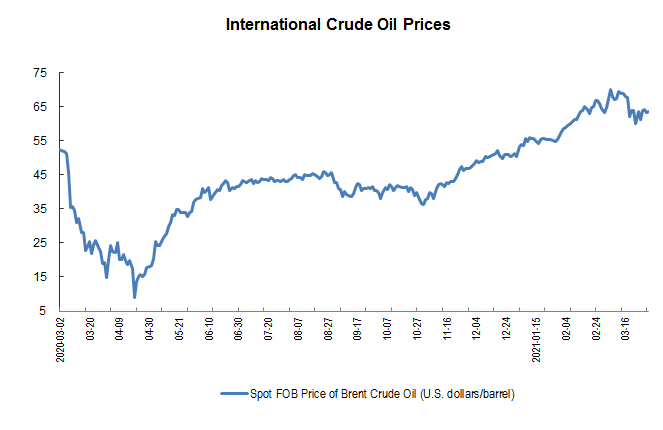
Crude oil imports had increased significantly, and the international crude oil price was basically stable. In March, the imported crude oil reached 49.66 million tons, an increase of 20.8 percent year-on-year; in the first quarter, the imported crude oil reached 139.23 million tons, an increase of 9.5 percent year-on-year. Spot FOB Brent crude oil on March 31 was 63.52 USD per barrel, down 1.6 percent from 64.56 USD per barrel on March 1.
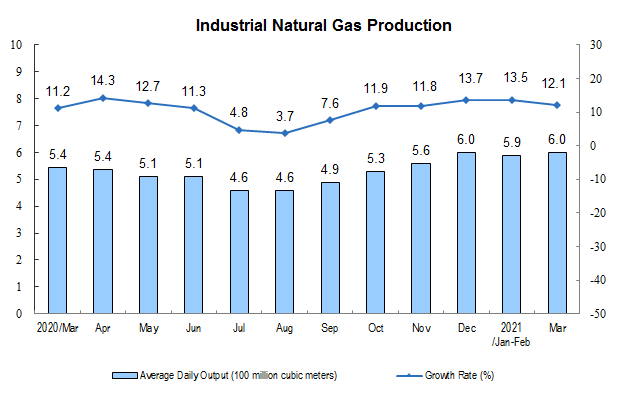
Natural gas production maintained rapid growth. In March, 18.5 billion cubic meters of natural gas were produced, a year-on-year increase of 12.1 percent, an increase of 24.7 percent over March 2019, an average increase of 11.7 percent in two years, and an average daily output of 600 million cubic meters.
In the first quarter, 53.3 billion cubic meters of natural gas were produced, with a year-on-year growth of 13.1 percent, an increase of 23.4 percent over the first quarter of 2019, and an average growth of 11.1 percent in two years.
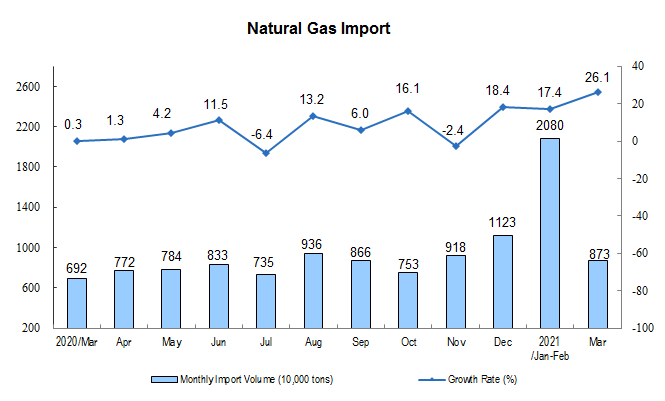
Imports of natural gas increased significantly. In March, 8.73 million tons of natural gas were imported, up 26.1 percent year on year. In the first quarter, 29.39 million tons of natural gas were imported, up 19.6 percent year on year.
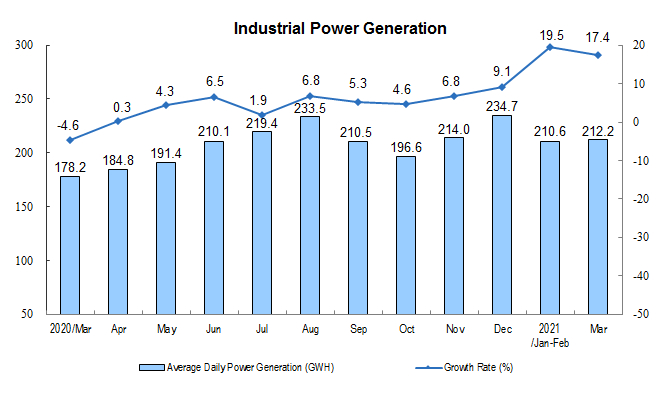
II. Electric Power Production
Electric power production grew rapidly. In March, 657.9 billion kwh of electricity was generated, a year-on-year increase of 17.4 percent, an increase of 12.0 percent over March 2019, an average increase of 5.8 percent in two years, and an average daily power generation of 21.22 billion kwh. In the first quarter, 1,905.1 billion kwh of electricity was generated, with a year-on-year growth of 19.0 percent, an increase of 10.8 percent over the first quarter of 2019, and an average growth of 5.3 percent in two years.
In March, thermal power, nuclear power and wind power kept growing, while hydropower and solar power declined. Among them, thermal power increased by 25.7 percent year on year, with March 2019 as the base period, with an average growth of 7.8 percent in two years; hydropower decreased by 11.5 percent, with an average decline of 8.8 percent in two years; nuclear power increased by 11.7 percent, with an average growth of 9.2 percent in two years; wind power increased by 4.0 percent, with an average growth of 10.8 percent in two years; solar power decreased by 0.6 percent, with an average growth of 3.9 percent in two years.
Annotations:
1. Explanatory Notes
Average daily product output: It is calculated by dividing the total output of Industrial Enterprises above the designated size announced in that month by the calendar days of that month.
2. Statistical Coverage
The statistical caliber of the output data in the report is above the designated size of industry, and the statistical scope is industrial enterprises with annual main business income of more than 20 million yuan.
Because the scope of Industrial Enterprises above the designated size changes every year, in order to ensure that this year's data is comparable with the previous year's, the same period used to calculate the growth rate of various indicators such as product output is consistent with the statistical scope of enterprises in this period, and there is a caliber difference between the data released last year.
3. Data Source
Import data comes from the General Administration of Customs, of which March data are express data; coal price data comes from China Coal Market Network; crude oil price data comes from the United States Energy Information Agency (EIA).
4. Conversion relationship of natural gas units: 1 ton is equal to 1380 cubic meters.
5. The two-year average growth rate refers to the growth rate calculated by geometric average method based on the corresponding number of the same period in 2019.