Consumer Prices for January 2021
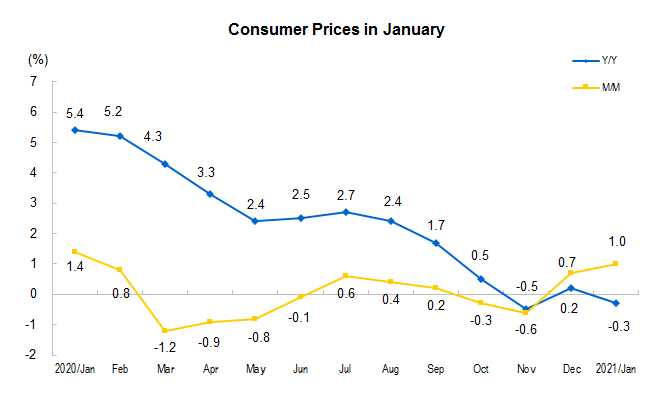
In January 2021, the national Consumer Price Index (CPI) dropped by 0.3 percent year on year. Among them, the prices in urban and rural dropped by 0.4 and 0.1 percent respectively; the prices of food stuff rose by 1.6 percent, and that of non-food stuff fell by 0.8 percent; the prices of consumer goods fell by 0.1 percent, and that of service fell by 0.7 percent.
In January, China's consumer prices rose by 1.0 percent month on month. Among them, the prices in urban and rural respectively rose by 1.0 and 1.1 percent; the prices of foodstuff and non-foodstuff rose by 4.1 and 0.3 percent; that of consumer goods rose by 1.5 percent, while that of service rose by 0.2 percent.
I. Year-on-Year Changes of Prices of Different Categories
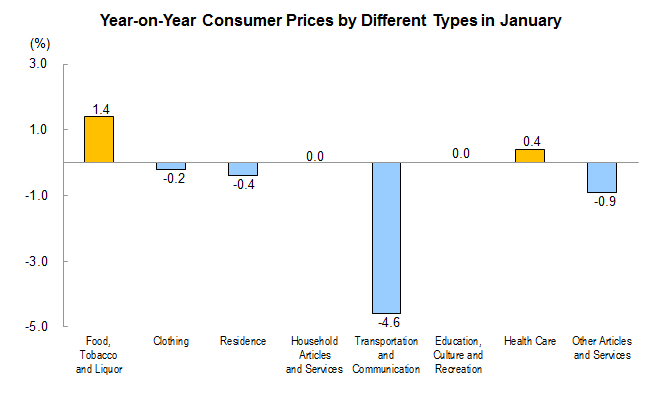
In January, the prices of food, tobacco and alcohol rose by 1.4 percent year on year, affecting the CPI (Consumer Price Index) to rise by about 0.41 percentage point. Among the foods, the price of fresh vegetables increased by 10.9 percent, which affected the CPI rose by about 0.24 percentage point; the price of grain increased by 1.6 percent, which affected the CPI up by about 0.03 percentage point; the price of fresh fruits increased by 1.3 percent, which affected the CPI up by about 0.02 percentage point; the price of eggs increased by 1.2 percent, which affected the CPI up by about 0.01 percentage point; the price of livestock meat decreased by 0.4 percent, which affected the CPI down by about 0.02 percentage point, in which the price of pork was down by 3.9 percent, affecting nearly 0.09 percentage point decrease in the CPI.
The prices of the other seven categories rose 1 flat 2 and fell 4. Among them, the prices of health care rose by 0.4 percent; that of daily necessities and services, education, culture and entertainment were flat; that of transportation and communication, other supplies and services decreased by 4.6 and 0.9 percent, respectively; that of housing and clothing decreased by 0.4 and 0.2 percent, respectively.
II. Month-on-Month Changes of Prices of Different Categories
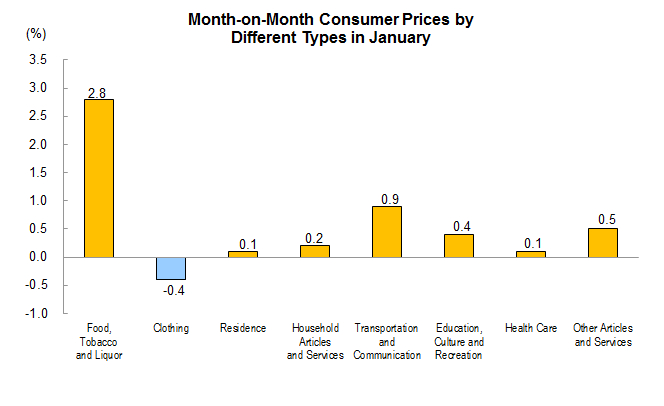
In January, the price of food, tobacco and alcohol rose by 2.8 percent on a month on month basis, which affected the CPI rise by about 0.80 percentage point. Among the foods, the price of fresh vegetables increased by 19.0 percent, which affected the CPI up by about 0.40 percentage point; the price of eggs increased by 9.4 percent, which affected the CPI up by about 0.06 percentage point; the price of livestock meat increased by 3.7 percent, which affected the CPI up by about 0.16 percentage point, in which the price of pork increased by 5.6 percent, which affected the CPI up by about 0.12 percentage point; the price of aquatic products increased by 3.3 percent, which affected the CPI up by about 0.06 percentage point; and the price of fresh fruits increased by about 2.3 percent, which affected CPI up by about 0.04 percentage point; grain price rose by 0.3 percent, which affected CPI up by about 0.01 percentage point.
The prices of the other seven categories rose 6 and fell 1 on a month on month basis. Among them, the prices of transportation and communications, other supplies and services, education, culture and entertainment increased by 0.9, 0.5 and 0.4 percent respectively; the prices of daily necessities and services, housing and health care increased by 0.2, 0.1 and 0.1 percent respectively; while the prices of clothing decreased by 0.4 percent.
Consumer Prices in January
| M/M (%) | Y/Y (%) | |
|
|
|
|
| Consumer Prices | 1.0 | -0.3 |
| Of which: Urban | 1.0 | -0.4 |
| Rural | 1.1 | -0.1 |
| Of which: Food | 4.1 | 1.6 |
| Non food | 0.3 | -0.8 |
| Of which: Consumer Goods | 1.5 | -0.1 |
| Services | 0.2 | -0.7 |
| Of which: Excluding Food and Energy | 0.1 | -0.3 |
|
By Commodity Categories |
|
|
| I. Food, Tobacco and Liquor | 2.8 | 1.4 |
| Grain | 0.3 | 1.6 |
| Cooking Oil | 2.1 | 6.0 |
| Fresh Vegetables | 19.0 | 10.9 |
| Meat | 3.7 | -0.4 |
| Of which: Pork | 5.6 | -3.9 |
| Beef | 1.2 | 4.1 |
| Mutton | 2.7 | 6.7 |
| Aquatic Products | 3.3 | 0.2 |
| Eggs | 9.4 | 1.2 |
| Dairy products | 0.2 | 1.7 |
| Fresh Fruits | 2.3 | 1.3 |
| Tobacco | 0.1 | 0.7 |
| Liquor | 0.0 | 2.0 |
| II. Clothing | -0.4 | -0.2 |
| Clothing | -0.4 | -0.1 |
| Shoes | -0.2 | -0.7 |
| III. Residence | 0.1 | -0.4 |
| House Renting | -0.1 | -0.7 |
| Water, Electricity, and Fuel | 0.5 | -0.2 |
| IV. Household Articles and Services | 0.2 | 0.0 |
| Household Appliances | 0.2 | -0.8 |
| Household Services | 1.9 | 0.9 |
| V. Transportation and Communication | 0.9 | -4.6 |
| Transportation Facilities | -0.2 | -1.9 |
| Fuels for Vehicles | 4.1 | -13.4 |
| Vehicle Use and Maintenance | 0.5 | -0.2 |
| Communication Facilities | 0.5 | 4.3 |
| Communication Services | -0.1 | -0.3 |
| Postal Services | 0.2 | -0.9 |
| VI. Education, Culture and Recreation | 0.4 | 0.0 |
| Education Services | 0.2 | 1.6 |
| Tourism | 1.1 | -8.6 |
| VII. Health Care | 0.1 | 0.4 |
| Traditional Chinese Medicines | 0.2 | 1.6 |
| Western Medicines | -0.2 | -1.8 |
| Health Care Services | 0.2 | 0.8 |
| VIII. Other Articles and Services | 0.5 | -0.9 |
|
|
|
|
Annotations:
1. Explanatory Notes
Consumer Price Index (CPI) is an index measuring changes over time in the price level of consumer goods and services purchased by residents, which comprehensively reflects the changes of price level.
2. Statistical Coverage
Consumer Price Index (CPI) covers the prices of goods and services of 8 categories and 268 basic divisions which cover the living consumption of urban and rural residents, including food, tobacco and liquor; clothing; residence; household articles and services; transportation and communication; education, culture and recreation; health care; other articles and services.
3. Survey Methods
According to the principle of "fixed person, fixed point and fixed time", people are directly sent to the survey sites or collect the original price from the Internet. The data comes from about 500 cities and counties in 31 provinces (autonomous regions and cities) and nearly 100000 price survey points, including shopping malls (stores), supermarkets, farmers' markets, service outlets and Internet e-commerce.
4. Data Description
Due to "rounding-off", sometimes the aggregate data is the same as the high or low value of the classified data.
5. Base Period Rotation
According to the regulations of the statistical system, China's CPI has a base period rotation every five years. In January 2021, CPI with 2020 as the base period will be compiled and released. Compared with the last round of the base period, the survey classification catalogue, representative specifications and survey outlets in the new base period have been adjusted, and the classification weight has also changed to reflect the latest changes in the consumption structure of residents. It is estimated that the average impact of the base period rotation on the CPI year-on-year index is about 0.03 percentage point.