Energy production in April of 2020
In April, the production of industrial raw coal above designated size maintained a rapid growth, the production of crude oil and electric power increased from a decline, and the production of natural gas accelerated.
I. Raw Coal, Crude Oil and Natural Gas Production and Relevant Information
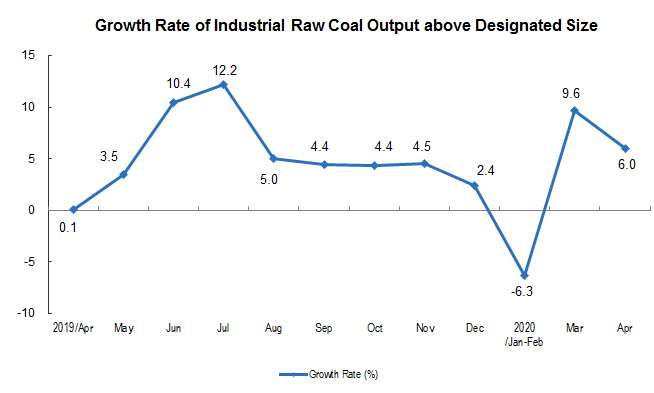
Raw coal production increased rapidly. In April, 320 million tons of raw coal were produced, up 6.0 percent year on year, 3.6 percentage points lower than that of last month; the average daily output was 10.74 million tons, down 140,000 tons month on month. From January to April, 1.15 billion tons of raw coal were produced, up 1.3 percent year on year.
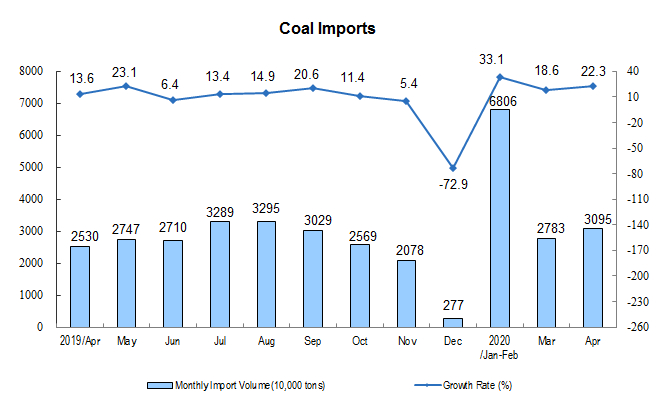
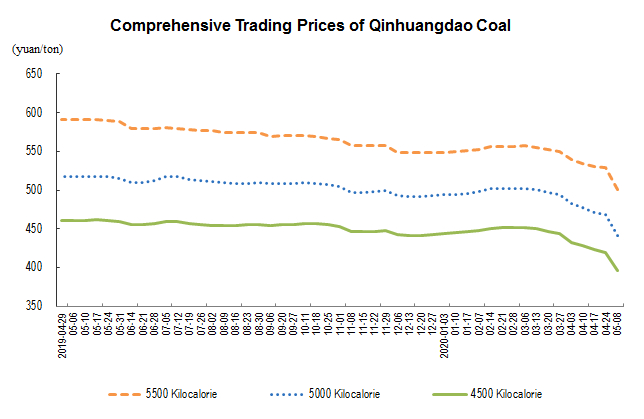
Coal imports grew rapidly and trading prices fell. In April, 30.95 million tons of coal were imported, up 22.3 percent year on year; from January to April, 130 million tons of coal were imported, 26.9 percent growth year-on-year. The comprehensive trading price of port coal continued to fall. On May 8, the price of 5500, 5000 and 4500 kcal coal in Qinhuangdao port was 501, 442 and 396 yuan per ton respectively, 39, 41 and 36 yuan lower than that on April 3.
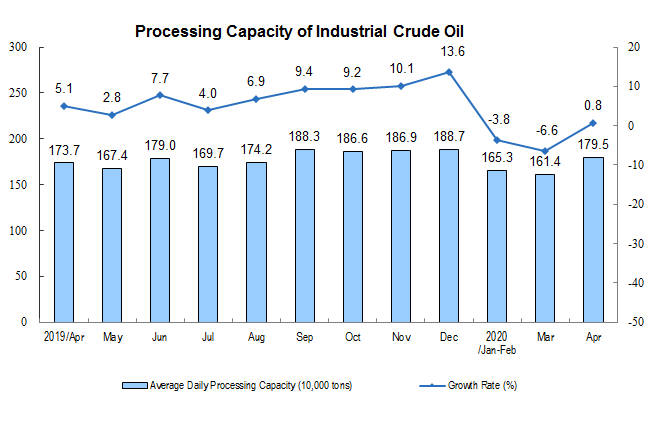
The crude oil production kept stable, and the processing capacity changed from decreasing to increasing. In April, 15.87 million tons of crude oil were produced, an increase of 0.9 percent year-on-year, and the growth rate changed from negative to positive, which was 0.1 percent of decrease in last month, the average daily output was 529,000 tons; 53.85 million tons of crude oil were processed, up 0.8 percent year-on-year, which was 6.6 percent of decrease in last month, with an average daily processing of 1,795,000 tons. From January to April, 64.44 million tons of crude oil were produced, up 2.0 percent year on year; and 203.48 million tons of processed crude oil were processed, down 3.4 percent year on year.
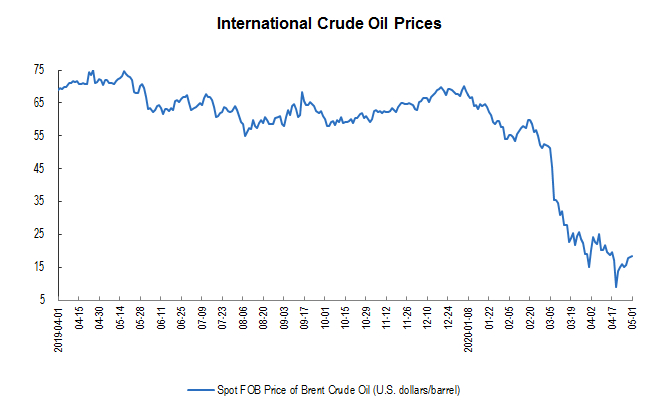
Crude oil imports fell and international crude oil prices fluctuated. In April, 40.43 million tons of crude oil were imported, down 7.5 percent year on year. From January to April, 167.61 million tons of crude oil were imported, a year-on-year increase 1.7 percent. On April 30, the spot FOB price of Brent crude oil was 18.11 USD per barrel, up 22 percent compared with March 31's 14.85 USD per barrel.


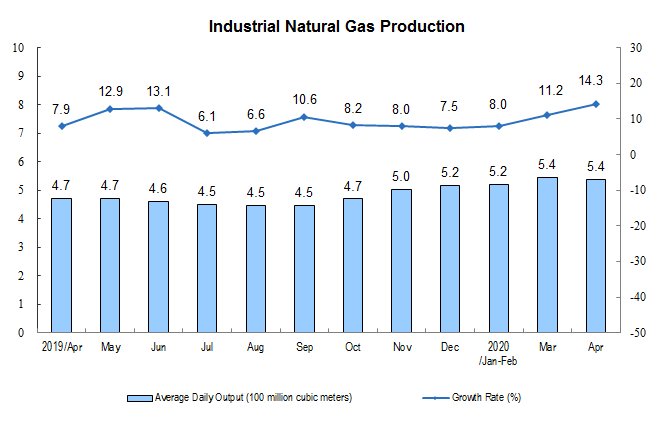
Natural gas production accelerated. In April, 16.1 billion cubic meters of natural gas were produced, up 14.3 percent year on year, 3.1 percentage points faster than last month, with an average daily output of 540 million cubic meters. From January to April, 64.4 billion cubic meters of natural gas were produced, up 10.3 percent year on year.
Natural gas imports increased slightly. In April, 7.73 million tons of natural gas were imported, up 1.0 percent year on year. From January to April, 32.33 million tons of natural gas were imported, up 1.5 percent year on year.

II. Electric Power Production
Electric power production changed from decreasing to increasing. In April, the power generation was 554.3 billion kwh, up 0.3 percent year on year, which was 4.6 percent decrease in last month. The average daily power generation was 18.48 billion kwh, an increase of 660 million kwh on a month on month basis. From January to April, the generating capacity was 2,138.8 billion kwh, down 5.0 percent year on year.
In terms of varieties, in April, the growth rate of thermal power changed from negative to positive, the decline rate of hydropower expanded, the growth rate of wind power fell, and the growth rate of nuclear power and solar power accelerated. Among them, thermal power increased 1.2 percent year on year, which was 7.5 percent decrease in last month; water and electricity decreased 9.2 percent, enlarged of 3.3 percentage points of decline than last month; wind power grew 1.2 percent , 16.9 percentage points of lower than last month; nuclear power grew 10.7 percent , accelerated 3.8 percentage points; solar power grew 12.3 percent, 3.7 percentage points of faster than last month.

Annotations:
1. Explanatory Notes
Average daily product output: It is calculated by dividing the total output of Industrial Enterprises above the designated size announced in that month by the calendar days of that month.
2. Statistical Coverage
The statistical caliber of the output data in the report is above the designated size of industry, and the statistical scope is industrial enterprises with annual main business income of more than 20 million yuan.
Because the scope of Industrial Enterprises above the designated size changes every year, in order to ensure that this year's data is comparable with the previous year's, the same period used to calculate the growth rate of various indicators such as product output is consistent with the statistical scope of enterprises in this period, and there is a caliber difference between the data released last year.
3. Data Source
Import data comes from the General Administration of Customs, of which January and February data are express data; coal price data comes from China Coal Market Network; crude oil price data comes from the United States Energy Information Agency (EIA).
4. Conversion relationship of natural gas units: 1 ton is equal to 1380 cubic meters.