Households' Income and Consumption Expenditure in the First Quarter of 2020
I. Households' Income
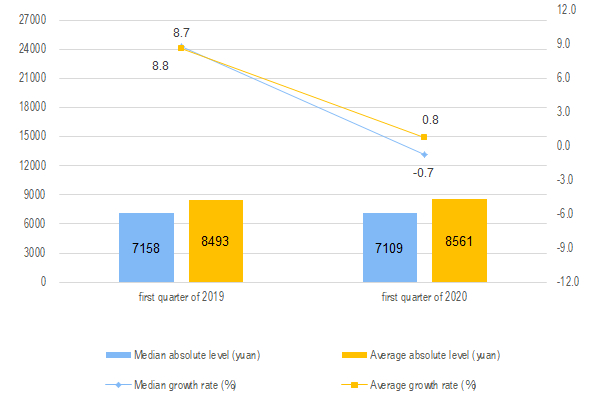
In the first quarter of 2020, the per capita disposable income of Chinese residents was 8,561 yuan, an increase of 0.8 percent in nominal terms over the same period of last year, and a real decrease of 3.9 percent after deducting price factors. Among them, the per capita disposable income of urban households was 11,691 yuan, an increase of 0.5 percent (the follows are all nominal increase on a year-on-year basis if not specified noted). After deducting the price factor, the actual decrease was 3.9 percent; the per capita disposable income of rural households was 4,641 yuan, an increase of 0.9 percent, and after deducting the price factor, the actual decrease was 4.7 percent.
In the first quarter of 2020, the median per capita disposable income was 7,109 yuan, down 0.7 percent, and the median was 83.0 percent of the average. Among them, the median per capita disposable income of urban households was 10,034 yuan, unchanged over last year, and the median was 85.8 percent of the average; the median per capita disposable income of rural households was 3,625 yuan, down 1.0 percent, and the median was 78.1 percent of the average.
According to the source of income, in the first quarter of 2020, the per capita income of wages and salaries of the whole country was 4,896 yuan, an increase of 1.2 percent, accounting for 57.2 percent of the disposable income; the per capita net business income was 1,376 yuan, a decrease of 7.3 percent, accounting for 16.1 percent of the disposable income; the per capita net property income was 741 yuan, an increase of 2.7 percent, accounting for 8.7 percent of the disposable income; the per capita net transfer income was 1,548 yuan, an increase of 6.8 percent, accounting for 18.1 percent of the disposable income.
II. Consumption Expenditure of Households
In the first quarter of 2020, the per capita consumption expenditure of the whole country was 5,082 yuan, a nominal decrease of 8.2 percent over the same period of last year, and a real decrease of 12.5 percent after deducting the price factor. Among them, the per capita consumption expenditure of urban households was 6,478 yuan, a decrease of 9.5 percent, with a real decrease of 13.5 percent after deducting the price factor; the per capita consumption expenditure of rural households was 3,334 yuan, a decrease of 5.4 percent, with a real decrease of 10.7 percent after deducting the price factor.
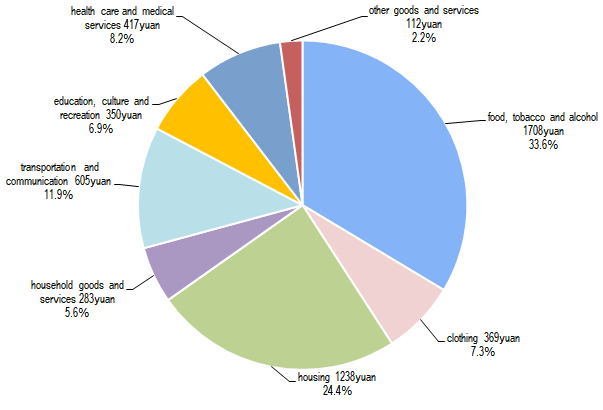
In the first quarter of 2020, the per capita consumption expenditure of food, tobacco and alcohol was 1,708 yuan, an increase of 2.1 percent, accounting for 33.6 percent of the per capita consumption expenditure; the per capita consumption expenditure of clothing was 369 yuan, a decrease of 17.8 percent, accounting for 7.3 percent of the per capita consumption expenditure; that of housing was 1,238 yuan, an increase of 2.1 percent, accounting for 24.4 percent of the per capita consumption expenditure; that of household goods and services was 283 yuan, a decrease of 11.4 percent, accounting for 5.6 percent of the per capita consumption expenditure; that of transportation and communication was 605 yuan, a decrease of 17.0 percent, accounting for 11.9 percent of the per capita consumption expenditure; that of education, culture and recreation was 350 yuan, a decrease of 36.1 percent, accounting for 6.9 percent of the per capita consumption expenditure; that of health care and medical services was 417 yuan, a decrease of 10.2 percent, accounting for 8.2 percent of the per capita consumption expenditure; and that of consumption of other goods and services reached 112 yuan, a decrease of 22.2 percent, accounting for 2.2 percent of per capita consumption.
| Table 1 Income and Expenditure Nationwide in the First Quarter of 2020
|
| ||||||||||||||||||||||||||||||||||||||||||||||||||||||||||||||||||||||||||||||||||||||||||||||||||||||||||||||||||||||||||||||||||||||||||||||||||||||||||||||||||||||||||||||||||||||||||||||||||||||||||||||||||||||||||||||||||
| Item | Absolute Value ( yuan)
| Y/Y(%) |
| ||||||||||||||||||||||||||||||||||||||||||||||||||||||||||||||||||||||||||||||||||||||||||||||||||||||||||||||||||||||||||||||||||||||||||||||||||||||||||||||||||||||||||||||||||||||||||||||||||||||||||||||||||||||||||||||||
|
|
|
|
|
|
| ||||||||||||||||||||||||||||||||||||||||||||||||||||||||||||||||||||||||||||||||||||||||||||||||||||||||||||||||||||||||||||||||||||||||||||||||||||||||||||||||||||||||||||||||||||||||||||||||||||||||||||||||||||||||||||||
| Total Per Capita Income Nationwide | 8561 | 0.8(-3.9) | |||||||||||||||||||||||||||||||||||||||||||||||||||||||||||||||||||||||||||||||||||||||||||||||||||||||||||||||||||||||||||||||||||||||||||||||||||||||||||||||||||||||||||||||||||||||||||||||||||||||||||||||||||||||||||||||||
| Grouped by Permanent Residence |
|
| |||||||||||||||||||||||||||||||||||||||||||||||||||||||||||||||||||||||||||||||||||||||||||||||||||||||||||||||||||||||||||||||||||||||||||||||||||||||||||||||||||||||||||||||||||||||||||||||||||||||||||||||||||||||||||||||||
| Urban Households | 11691 | 0.5(-3.9) | |||||||||||||||||||||||||||||||||||||||||||||||||||||||||||||||||||||||||||||||||||||||||||||||||||||||||||||||||||||||||||||||||||||||||||||||||||||||||||||||||||||||||||||||||||||||||||||||||||||||||||||||||||||||||||||||||
| Rural Households | 4641 | 0.9(-4.7) | |||||||||||||||||||||||||||||||||||||||||||||||||||||||||||||||||||||||||||||||||||||||||||||||||||||||||||||||||||||||||||||||||||||||||||||||||||||||||||||||||||||||||||||||||||||||||||||||||||||||||||||||||||||||||||||||||
| Grouped by Income Source |
|
| |||||||||||||||||||||||||||||||||||||||||||||||||||||||||||||||||||||||||||||||||||||||||||||||||||||||||||||||||||||||||||||||||||||||||||||||||||||||||||||||||||||||||||||||||||||||||||||||||||||||||||||||||||||||||||||||||
| Income of Wages and Salaries | 4896 | 1.2 | |||||||||||||||||||||||||||||||||||||||||||||||||||||||||||||||||||||||||||||||||||||||||||||||||||||||||||||||||||||||||||||||||||||||||||||||||||||||||||||||||||||||||||||||||||||||||||||||||||||||||||||||||||||||||||||||||
| Net Business Income | 1376 | -7.3 | |||||||||||||||||||||||||||||||||||||||||||||||||||||||||||||||||||||||||||||||||||||||||||||||||||||||||||||||||||||||||||||||||||||||||||||||||||||||||||||||||||||||||||||||||||||||||||||||||||||||||||||||||||||||||||||||||
| Net Income from Property | 741 | 2.7 | |||||||||||||||||||||||||||||||||||||||||||||||||||||||||||||||||||||||||||||||||||||||||||||||||||||||||||||||||||||||||||||||||||||||||||||||||||||||||||||||||||||||||||||||||||||||||||||||||||||||||||||||||||||||||||||||||
| Net Income from Transfer | 1548 | 6.8 | |||||||||||||||||||||||||||||||||||||||||||||||||||||||||||||||||||||||||||||||||||||||||||||||||||||||||||||||||||||||||||||||||||||||||||||||||||||||||||||||||||||||||||||||||||||||||||||||||||||||||||||||||||||||||||||||||
| Total Per Capita Income Nationwide Median | 7109 | -0.7 | |||||||||||||||||||||||||||||||||||||||||||||||||||||||||||||||||||||||||||||||||||||||||||||||||||||||||||||||||||||||||||||||||||||||||||||||||||||||||||||||||||||||||||||||||||||||||||||||||||||||||||||||||||||||||||||||||
| Grouped by Permanent Residence |
|
| |||||||||||||||||||||||||||||||||||||||||||||||||||||||||||||||||||||||||||||||||||||||||||||||||||||||||||||||||||||||||||||||||||||||||||||||||||||||||||||||||||||||||||||||||||||||||||||||||||||||||||||||||||||||||||||||||
| Urban Households | 10034 | 0.0 | |||||||||||||||||||||||||||||||||||||||||||||||||||||||||||||||||||||||||||||||||||||||||||||||||||||||||||||||||||||||||||||||||||||||||||||||||||||||||||||||||||||||||||||||||||||||||||||||||||||||||||||||||||||||||||||||||
| Rural Households | 3625 | -1.0 | |||||||||||||||||||||||||||||||||||||||||||||||||||||||||||||||||||||||||||||||||||||||||||||||||||||||||||||||||||||||||||||||||||||||||||||||||||||||||||||||||||||||||||||||||||||||||||||||||||||||||||||||||||||||||||||||||
| Total Per Capita Expenditure Nationwide | 5082 | -8.2(-12.5) | |||||||||||||||||||||||||||||||||||||||||||||||||||||||||||||||||||||||||||||||||||||||||||||||||||||||||||||||||||||||||||||||||||||||||||||||||||||||||||||||||||||||||||||||||||||||||||||||||||||||||||||||||||||||||||||||||
| Grouped by Permanent Residence |
|
| |||||||||||||||||||||||||||||||||||||||||||||||||||||||||||||||||||||||||||||||||||||||||||||||||||||||||||||||||||||||||||||||||||||||||||||||||||||||||||||||||||||||||||||||||||||||||||||||||||||||||||||||||||||||||||||||||
| Urban Households | 6478 | -9.5(-13.5) | |||||||||||||||||||||||||||||||||||||||||||||||||||||||||||||||||||||||||||||||||||||||||||||||||||||||||||||||||||||||||||||||||||||||||||||||||||||||||||||||||||||||||||||||||||||||||||||||||||||||||||||||||||||||||||||||||
| Rural Households | 3334 | -5.4(-10.7) | |||||||||||||||||||||||||||||||||||||||||||||||||||||||||||||||||||||||||||||||||||||||||||||||||||||||||||||||||||||||||||||||||||||||||||||||||||||||||||||||||||||||||||||||||||||||||||||||||||||||||||||||||||||||||||||||||
| Grouped by Consumption Category |
|
| |||||||||||||||||||||||||||||||||||||||||||||||||||||||||||||||||||||||||||||||||||||||||||||||||||||||||||||||||||||||||||||||||||||||||||||||||||||||||||||||||||||||||||||||||||||||||||||||||||||||||||||||||||||||||||||||||
| Food, tobacco and liquor | 1708 | 2.1 | |||||||||||||||||||||||||||||||||||||||||||||||||||||||||||||||||||||||||||||||||||||||||||||||||||||||||||||||||||||||||||||||||||||||||||||||||||||||||||||||||||||||||||||||||||||||||||||||||||||||||||||||||||||||||||||||||
| Clothing | 369 | -17.8 | |||||||||||||||||||||||||||||||||||||||||||||||||||||||||||||||||||||||||||||||||||||||||||||||||||||||||||||||||||||||||||||||||||||||||||||||||||||||||||||||||||||||||||||||||||||||||||||||||||||||||||||||||||||||||||||||||
| Residence | 1238 | 2.1 | |||||||||||||||||||||||||||||||||||||||||||||||||||||||||||||||||||||||||||||||||||||||||||||||||||||||||||||||||||||||||||||||||||||||||||||||||||||||||||||||||||||||||||||||||||||||||||||||||||||||||||||||||||||||||||||||||
| Household facilities, articles and services | 283 | -11.4 | |||||||||||||||||||||||||||||||||||||||||||||||||||||||||||||||||||||||||||||||||||||||||||||||||||||||||||||||||||||||||||||||||||||||||||||||||||||||||||||||||||||||||||||||||||||||||||||||||||||||||||||||||||||||||||||||||
| Transportation and telecommunication | 605 | -17.0 | |||||||||||||||||||||||||||||||||||||||||||||||||||||||||||||||||||||||||||||||||||||||||||||||||||||||||||||||||||||||||||||||||||||||||||||||||||||||||||||||||||||||||||||||||||||||||||||||||||||||||||||||||||||||||||||||||
| Education, culture and recreation | 350 | -36.1 | |||||||||||||||||||||||||||||||||||||||||||||||||||||||||||||||||||||||||||||||||||||||||||||||||||||||||||||||||||||||||||||||||||||||||||||||||||||||||||||||||||||||||||||||||||||||||||||||||||||||||||||||||||||||||||||||||
| Health care and medical services | 417 | -10.2 | |||||||||||||||||||||||||||||||||||||||||||||||||||||||||||||||||||||||||||||||||||||||||||||||||||||||||||||||||||||||||||||||||||||||||||||||||||||||||||||||||||||||||||||||||||||||||||||||||||||||||||||||||||||||||||||||||
| Miscellaneous goods and services | 112 | -22.2 | |||||||||||||||||||||||||||||||||||||||||||||||||||||||||||||||||||||||||||||||||||||||||||||||||||||||||||||||||||||||||||||||||||||||||||||||||||||||||||||||||||||||||||||||||||||||||||||||||||||||||||||||||||||||||||||||||
|
|
|
| |||||||||||||||||||||||||||||||||||||||||||||||||||||||||||||||||||||||||||||||||||||||||||||||||||||||||||||||||||||||||||||||||||||||||||||||||||||||||||||||||||||||||||||||||||||||||||||||||||||||||||||||||||||||||||||||||
| Notes:
| |||||||||||||||||||||||||||||||||||||||||||||||||||||||||||||||||||||||||||||||||||||||||||||||||||||||||||||||||||||||||||||||||||||||||||||||||||||||||||||||||||||||||||||||||||||||||||||||||||||||||||||||||||||||||||||||||||
| |||||||||||||||||||||||||||||||||||||||||||||||||||||||||||||||||||||||||||||||||||||||||||||||||||||||||||||||||||||||||||||||||||||||||||||||||||||||||||||||||||||||||||||||||||||||||||||||||||||||||||||||||||||||||||||||||||
Annotations:
1. Explanatory Notes
Disposable income of Households refers to the sum of final consumption expenditure and savings that residents can use, that is, the income that residents can use for free disposal, including both cash income and physical income. According to the source of income, disposable income includes wage and salary income, net business income, net property income and net transfer income.
Consumer spending refers to all the expenditures that residents use to meet their daily needs, including both cash and physical consumption. Consumer spending includes eight categories: food, tobacco and alcohol, clothing, housing, daily necessities and services, transportation and communication, education, culture and recreation, medical care and other supplies and services.
The median of the nationwide per capita disposable income of households refers to the per capita disposable income of households which lies in the middle of all surveyed households ranked from low to high on the basis of per capita disposable income level.
The quarterly income and expenditure data do not include the income and consumption of the self-produced and self-used parts of households, and the annual income and expenditure data includes.
2.Survey Methods
The national and sub urban and rural households' income and expenditure data comes from the household income and expenditure and living conditions survey organized and implemented by the National Bureau of Statistics, which is released quarterly.
Using stratified, multi-stage, probability sampling method proportional to the size of population, the National Bureau of Statistics randomly selected 160000 households in 1800 counties (cities, districts) of 31 provinces (regions, cities) as survey households.
According to the unified system and method, the survey organizations directly under the National Bureau of statistics will organize the household to record and collect the data of households' income, expenditure, family operation, production and investment; meanwhile, according to the unified questionnaire, collect other surveys such as the employment of household members and labor force, the ownership of housing and durable consumer goods, and the enjoyment of households' basic social and public services. After the completion of data collection, the municipal and county survey organizations use unified methods and data processing procedures to code, review and input the original investigation data, and then directly transmit the basic household data to the National Bureau of Statistics for unified summary and calculation.