Energy production in the First Two Months of 2020
From January to February, the production of raw coal and electric power for industries above designated size decreased, while the production of crude oil and natural gas kept growing.
I. Raw Coal, Crude Oil and Natural Gas Production and Relevant Information
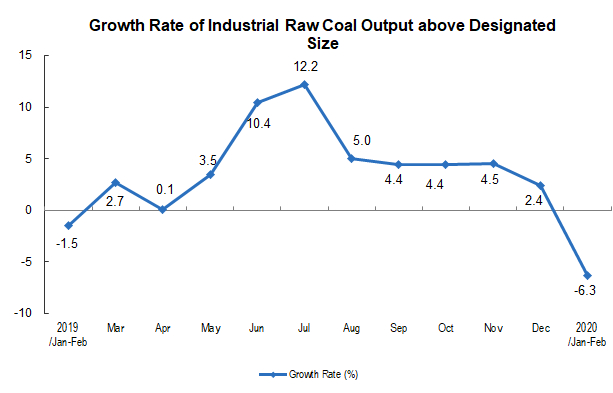
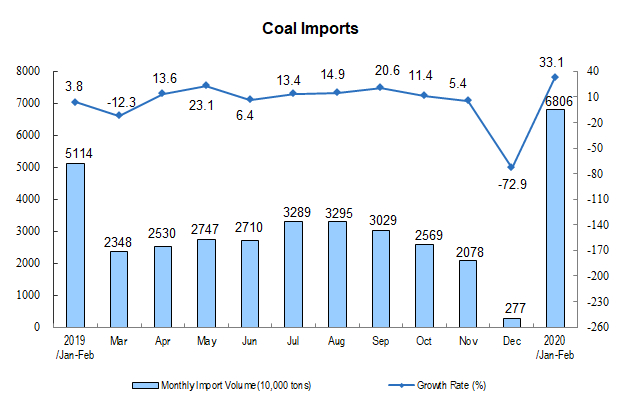
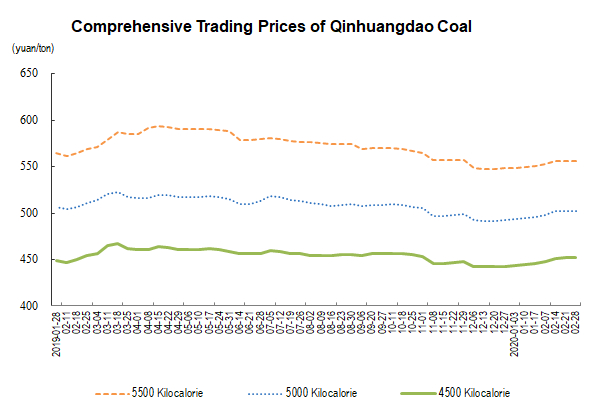
Raw coal production declined. From January to February, 490 million tons of raw coal were produced, with an average daily output of 8.15 million tons, down 6.3 percent year on year; 68.06 million tons of coal were imported, up 33.1 percent year on year. The comprehensive trading price of port coal has increased. On February 28, the price of 5500, 5000 and 4500 kcal coal in Qinhuangdao port was 556, 502 and 452 yuan per ton respectively, up 7, 8 and 8 yuan respectively from January 3.
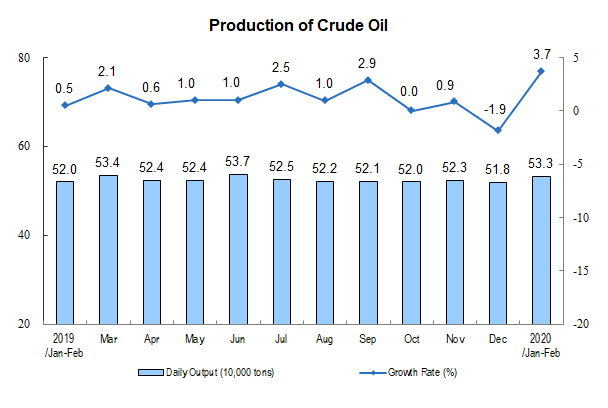
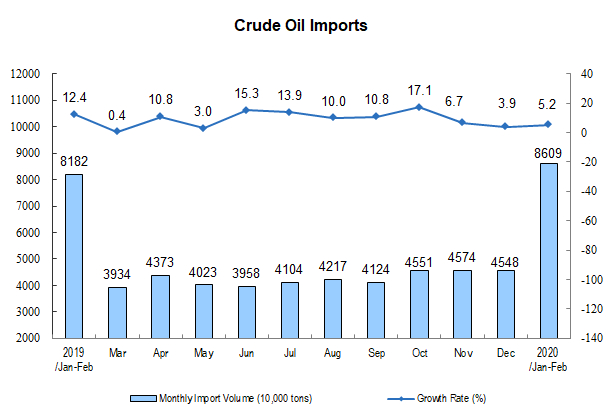
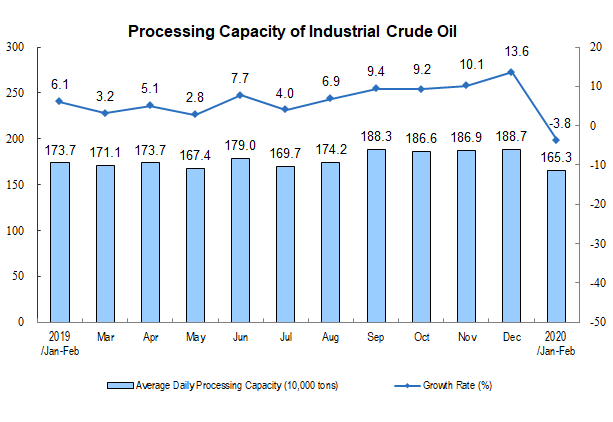
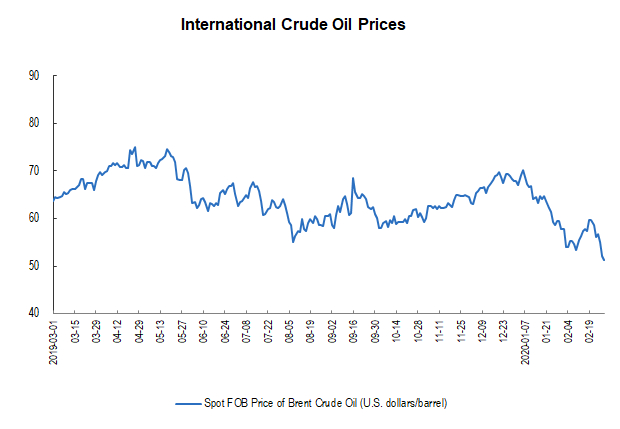
Crude oil production kept increasing, while processing volume decreased. From January to February, 32 million tons of crude oil were produced, with an average daily output of 533 thousand tons, up 3.7 percent year-on-year; 86.09 million tons of crude oil were imported, up 5.2 percent year-on-year; 99.19 million tons of crude oil were processed, with an average daily output of 1.653 million tons, down 3.8 percent year-on-year. The international crude oil price fell sharply. On February 28, the spot FOB price of Brent crude oil was 51.3 USD per barrel, down 16.5 USD or 24.3 percent from December 31 of last year.
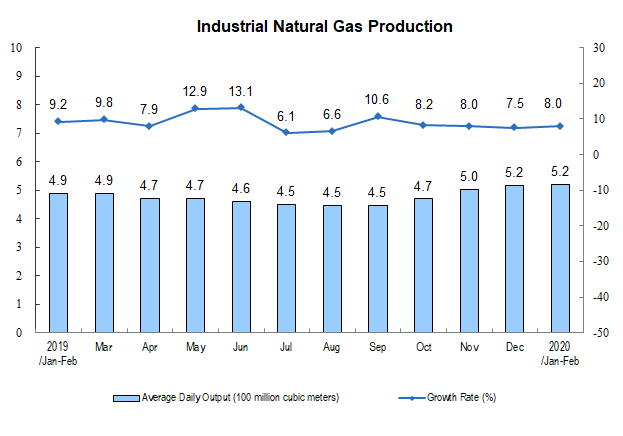
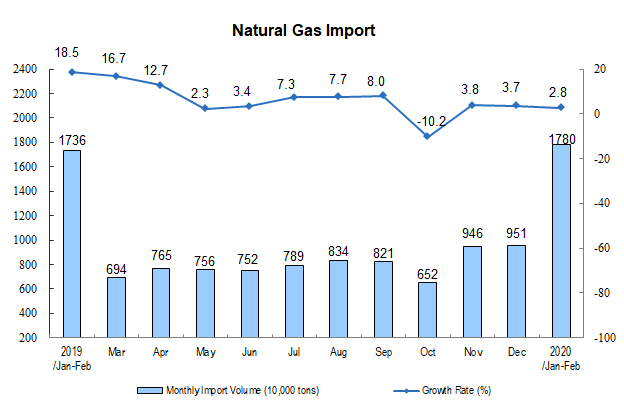
The production of natural gas increased rapidly. From January to February, 31.4 billion cubic meters of natural gas were produced, with an average daily output of 520 million cubic meters, up 8.0 percent year on year; 17.8 million tons of natural gas were imported, up 2.8 percent year on year.
II. Electric Power Production
Power production decreased. From January to February, 1,026.7 billion kwh was generated, with an average of 17.11 billion kwh per day, down 8.2 percent year on year. In terms of varieties, thermal power and hydropower declined significantly, nuclear power and wind power declined slightly, and solar power generation grew steadily. Among them, thermal power decreased by 8.9 percent, hydropower fell 11.9 percent, nuclear power declined 2.2 percent, wind power dropped by 0.2 percent, while solar power rose by 12.0 percent.

Annotations:
1. Explanatory Notes
Average daily product output: It is calculated by dividing the total output of Industrial Enterprises above the designated size announced in that month by the calendar days of that month.
2. Statistical Coverage
The statistical caliber of the output data in the report is above the designated size of industry, and the statistical scope is industrial enterprises with annual main business income of more than 20 million yuan.
Because the scope of Industrial Enterprises above the designated size changes every year, in order to ensure that this year's data is comparable with the previous year's, the same period used to calculate the growth rate of various indicators such as product output is consistent with the statistical scope of enterprises in this period, and there is a caliber difference between the data released last year.
3. Data Source
Import data comes from the General Administration of Customs, of which January and February data are express data; coal price data comes from China Coal Market Network; crude oil price data comes from the United States Energy Information Agency (EIA).
4. Conversion relationship of natural gas units: 1 ton is equal to 1380 cubic meters.