Consumer Prices for February 2020
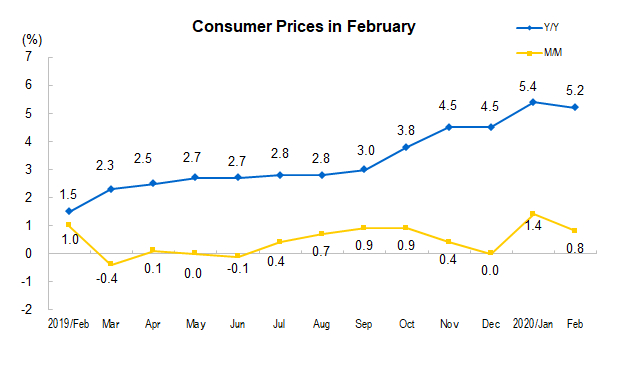
In February 2020, the Consumer Price Index (CPI) went up by 5.2 percent year-on-year, with an increase of 4.8 percent in urban and 6.3 percent in rural. The food prices went up by 21.9 percent, and the non-food prices increased by 0.9 percent. The prices of consumer goods went up by 7.9 percent, and that of services grew by 0.6 percent. From January to February, on average, the overall consumer prices were up by 5.3 percent from the same period of the previous year.
In February, national consumer prices rose by 0.8 percent month-on-month. Among them, the prices in urban and rural were up by 0.8 and 0.9 percent respectively; the prices of foodstuff increased by 4.3 percent, that of non-foodstuff decreased by 0.2 percent; and that of consumer goods went up by 1.4 percent, while that of services fell 0.2 percent.
I. Year-on-Year Changes of Prices of Different Categories
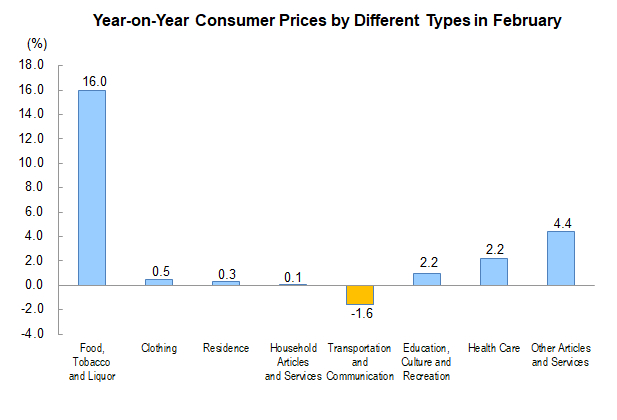
In February, prices of food, tobacco and liquor went up by 16.0 percent year-on-year, affecting nearly 4.84 percentage points increase in the CPI. Of which, livestock meat price up by 87.6 percent, affecting nearly 3.85 percentage points increase in the CPI (price of pork was up by 135.2 percent, affecting nearly 3.19 percentage points increase in the CPI); Fresh vegetable prices jumped by 10.9 percent, affecting the CPI up by 0.33 percentage point; The price of aquatic products rose by 2.8 percent, affecting nearly 0.05 percentage point increase in the CPI; The price of eggs went up by 1.0 percent, affecting the CPI up by about 0.01 percentage point; Grain prices increased by 0.7 percent, affecting CPI up by about 0.01 percentage point; Fresh fruit prices decreased by 5.6 percent, affecting nearly 0.11 percentage point decrease in the CPI.
Prices in the other seven categories were six up and one down year on year. In which, the prices of other goods and services, health care, education, culture and entertainment rose by 4.4, 2.2 and 1.0 percent respectively, and the prices of clothing, housing and daily goods and services rose by 0.5, 0.3 and 0.1 percent, while that of transportation and communications fell 1.6 percent.
II. Month-on-Month Changes of Prices of Different Categories
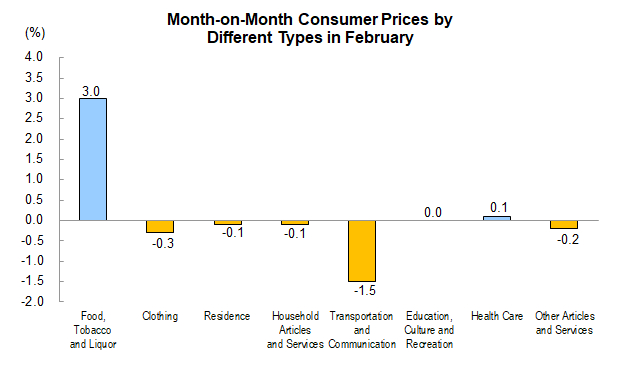
In February, food, tobacco and alcohol prices went up by 3.0 percent month-on-month, affecting CPI increase by 0.99 percentage point. In which, fresh vegetable prices went up by 9.5 percent, affecting CPI up by 0.28 percentage point; Livestock meat prices rose by 7.1 percent, affecting nearly 0.53 percentage point increase in the CPI (price of pork was up by 9.3 percent, affecting nearly 0.45 percentage point increase in the CPI); Fresh fruits prices went up by 4.8 percent, affecting CPI increase by 0.08 percentage point. Aquatic products prices rose by 3.0 percent, affecting CPI up by 0.05 percentage point; Egg prices dropped by 5.8 percent, affecting CPI down by 0.04 percentage point;
Other 7 kinds of price went up 1 down 5 and 1 unchanged. In which, prices for health care jumped by 0.1 percent; that of education, culture and entertainment unchanged; while that of transportation and communications, clothing and other goods and services dropped by 1.5, 0.3 and 0.2 percent; and that of housing and household goods and services both fell 0.1 percent.
Consumer Prices in February
| Items | February | Average on Jan-Feb | |
| M/M (%) | Y/Y (%) | Y/Y (%) | |
|
|
|
|
|
| Consumer Prices | 0.8 | 5.2 | 5.3 |
| Of which: Urban | 0.8 | 4.8 | 5.0 |
| Rural | 0.9 | 6.3 | 6.3 |
| Of which: Food | 4.3 | 21.9 | 21.3 |
| Non food | -0.2 | 0.9 | 1.3 |
| Of which: Consumer Goods | 1.4 | 7.9 | 7.8 |
| Services | -0.2 | 0.6 | 1.1 |
| Of which: Excluding Food and Energy | -0.1 | 1.0 | 1.3 |
| Of which: Excluding Fresh Vegetables and Fresh Fruits | 0.5 | 5.2 | 5.2 |
| By Commodity Categories |
|
|
|
| I. Food, Tobacco and Liquor | 3.0 | 16.0 | 15.6 |
| Grain | 0.4 | 0.7 | 0.6 |
| Cooking Oil | 0.5 | 5.7 | 5.4 |
| Fresh Vegetables | 9.5 | 10.9 | 13.8 |
| Meat | 7.1 | 87.6 | 82.2 |
| Of which: Pork | 9.3 | 135.2 | 125.6 |
| Beef | 2.3 | 21.1 | 20.6 |
| Mutton | 1.3 | 11.2 | 10.8 |
| Aquatic Products | 3.0 | 2.8 | 3.3 |
| Eggs | -5.8 | 1.0 | 1.7 |
| Dairy products | 0.2 | 0.9 | 0.7 |
| Fresh Fruits | 4.8 | -5.6 | -5.3 |
| Tobacco | 0.0 | 0.7 | 0.7 |
| Liquor | 0.5 | 3.2 | 2.9 |
| II. Clothing | -0.3 | 0.5 | 0.5 |
| Clothing | -0.3 | 0.6 | 0.6 |
| Clothing Processing Service | -0.2 | 2.2 | 2.7 |
| Shoes | -0.2 | -0.1 | 0.0 |
| III. Residence | -0.1 | 0.3 | 0.4 |
| House Renting | -0.1 | 0.3 | 0.5 |
| Water, Electricity, and Fuel | -0.1 | 0.2 | 0.3 |
| IV. Household Articles and Services | -0.1 | 0.1 | 0.1 |
| Household Appliances | -0.1 | -1.6 | -1.6 |
| Household Services | -1.5 | 1.2 | 2.4 |
| V. Transportation and Communication | -1.5 | -1.6 | -0.4 |
| Transportation Facilities | 0.0 | -1.8 | -1.8 |
| Fuels for Vehicles | -5.6 | -2.3 | 2.4 |
| Vehicle Use and Maintenance | -1.1 | -0.2 | 1.4 |
| Communication Facilities | -0.2 | -4.0 | -4.0 |
| Communication Services | 0.0 | -0.6 | -0.6 |
| Postal Services | -0.9 | -1.8 | -0.8 |
| VI. Education, Culture and Recreation | 0.0 | 1.0 | 1.6 |
| Education Services | 0.0 | 2.6 | 2.7 |
| Tourism | 0.0 | -2.1 | 1.0 |
| VII. Health Care | 0.1 | 2.2 | 2.2 |
| Traditional Chinese Medicines | 0.2 | 2.9 | 2.9 |
| Western Medicines | 0.1 | 2.3 | 2.4 |
| Health Care Services | 0.1 | 2.3 | 2.3 |
| VIII. Other Articles and Services | -0.2 | 4.4 | 4.6 |
|
|
|
|
|
Annotations:
1. Explanatory Notes
Consumer Price Index (CPI) is an index measuring changes over time in the price level of consumer goods and services purchased by residents, which comprehensively reflects the changes of price level.
2. Statistical Coverage
Consumer Price Index (CPI) covers the prices of goods and services of 8 categories and 262 basic dishvisions which cover the living consumption of urban and rural residents, including food, tobacco and liquor; clothing; residence; household articles and services; transportation and communication; education, culture and recreation; health care; other articles and services.
3. Survey Methods
The prices collection units are selected and determined by sample survey methods, and the original data of consumer prices are collected by specific person in fixed place at fixed time. Data are collected from 88,000 prices collection units in 500 cities and counties of the 31 provinces (autonomous regions and municipalities), which cover shopping malls, supermarkets, open fairs, service outlets and Internet E-commerce suppliers.
4. Data Description
Due to "rounding-off", sometimes the aggregate data is the same as the high or low value of the classified data.