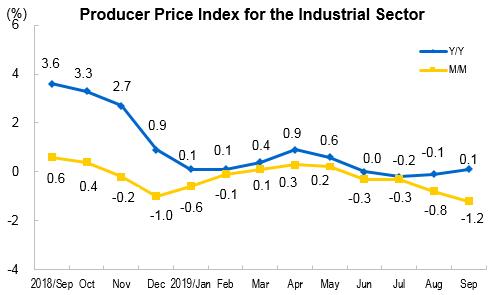
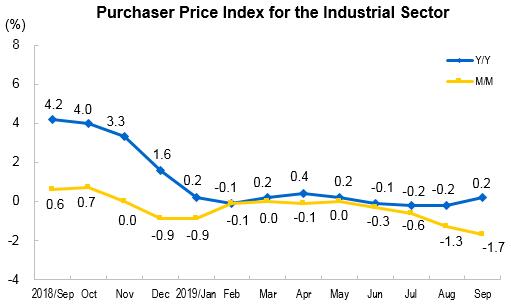
Producer Prices for the Industrial Sector for September 2019
In September 2019, Producer Price Index (PPI) for manufactured goods decreased by 1.2 percent year-on-year while 0.1 percent of increase month-on-month. The purchasing price index for manufactured goods decreased by 1.7 percent year-on-year while 0.2 percent of increase month-on-month. In the first nine months, on average, the Producer Price Index for manufactured goods kept the same level from that in the same period of 2018, while that of the purchasing price index for manufactured goods decreased by 0.3 percent.
1. Year-on-Year Changes of Prices of Different Categories
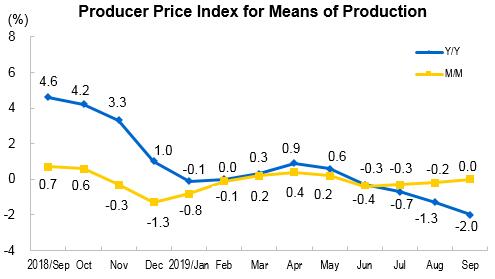
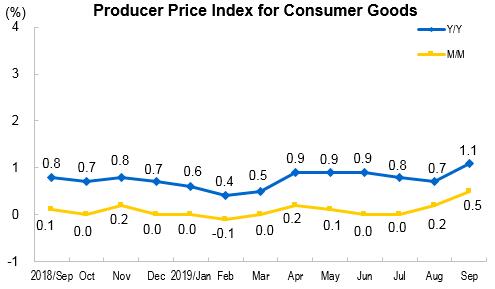
Among the PPI for manufactured goods, the year-on-year change of producer prices for means of production decreased by 2.0 percent, and the decline was 0.7 percentage point larger than that of last month, affecting 1.52 percentage points decrease in the overall level of producer price. Of which, producer prices for mining and quarrying industry increased by 0.6 percent; that of raw materials industry decreased by 4.8 percent; that of manufacturing and processing industry fell by 1.2 percent. Producer prices for consumer goods increased by 1.1 percent year-on-year, and the pace of increase enlarged 0.4 percentage point from the previous month, meaning 0.28 percentage point increase in the overall price level. Of which, producer prices for foodstuff, clothing, and commodities increased by 3.3, 0.9 and 0.8 percent, while that of durable consumer goods decreased by 1.8 percent.
In the Purchaser Price Index, the year-on-year purchaser price indices for agricultural and sideline products, building materials and non-metallic, and ferrous metal materials, jumped 4.7, 3.7 and 1.8 percent, while that of chemical raw materials, fuel and power, and non-ferrous metal materials and wires, decreased by 7.9, 4.2 and 1.5 percent respectively.
2. Month-on-Month Changes of Prices of Different Categories
Among the PPI for manufactured goods, the prices for means of production was flat month-on-month, Of the total, producer prices for mining and quarrying industry decreased by 0.5 percent, that of raw materials industry and manufacturing and processing industry unchanged. Producer prices for consumer goods increased by 0.5 percent, with the pace of growth enlarged 0.3 percentage point, meaning 0.13 percentage point increase in the overall price level. Of which, the producer prices for foodstuff went up by 1.0 percent, that of commodities went up by 0.3, and that of clothing and durable consumer goods both increased by 0.1 percent from the previous month.
The month-on-month purchaser price indices for agricultural and sideline products, non-ferrous metal materials and wires, and building materials and non-metallic products increased by 2.2, 0.9 and 0.4 percent respectively, while that of ferrous metals, fuel and power decreased by 1.0 and 0.1 percent respectively.
Price Indexes for the Industrial Sector in September
|
| M/M(%) | Y/Y(%) | Average on Jan-Sep |
| Y/Y(%) | |||
|
|
|
|
|
| I. Producer Price Indices | 0.1 | -1.2 | 0.0 |
| Means of production | 0.0 | -2.0 | -0.3 |
| Mining and quarrying | -0.5 | 0.6 | 3.3 |
| Raw materials | 0.0 | -4.8 | -2.0 |
| Processing | 0.0 | -1.2 | 0.0 |
| Means of subsistence | 0.5 | 1.1 | 0.8 |
| Food | 1.0 | 3.3 | 1.9 |
| Clothing | 0.1 | 0.9 | 1.4 |
| Articles for daily use | 0.3 | 0.8 | 0.5 |
| Durable consumer goods | 0.1 | -1.8 | -1.0 |
| II. Purchaser Price Indices | 0.2 | -1.7 | -0.3 |
| Fuel and Power | -0.1 | -4.2 | -0.7 |
| Ferrous Metals | -1.0 | 1.8 | 3.0 |
| Non-ferrous Metal Materials and Wires | 0.9 | -1.5 | -2.4 |
| Chemical Raw Materials | 0.0 | -7.9 | -4.2 |
| Wood and Pulp | -0.4 | -4.8 | -2.1 |
| Building Materials and Non-metallic | 0.4 | 3.7 | 4.7 |
| Other Industrial Raw Materials and Semi-products | 0.3 | -0.6 | -0.2 |
| Agricultural and Sideline Products | 2.2 | 4.7 | 1.5 |
| Textile Raw Materials | -0.3 | -2.3 | 0.1 |
| III. Producer Price Indices of Major Industries |
|
|
|
| Mining and Washing of Coal | -0.2 | 0.2 | 2.0 |
| Extraction of Petroleum and Natural Gas | -1.1 | -13.4 | -1.8 |
| Mining of Ferrous Metal Ores | -2.4 | 15.7 | 13.2 |
| Mining of Non-Ferrous Metal Ores | 1.5 | 5.7 | 0.4 |
| Mining and Processing of Nonmetal Ores | 0.2 | 5.0 | 5.5 |
| Processing of Food from Agricultural Products | 1.8 | 4.0 | 1.7 |
| Manufacture of Foods | 0.1 | 1.1 | 1.4 |
| Manufacture of Wines, Beverage and Refined Tea | 0.0 | 1.5 | 1.2 |
| Manufacture of Cigarettes and Tobacco | 0.1 | 2.9 | 2.2 |
| Manufacture of Textile | -0.3 | -2.4 | 0.2 |
| Manufacture of Textile Wearing Apparel and Ornament | 0.0 | 0.3 | 0.9 |
| Processing of Timbers, Manufacture of Wood, Bamboo, Rattan, Palm, and Straw Products | 0.1 | 0.5 | 1.1 |
| Manufacture of Paper and Paper Products | -0.3 | -7.7 | -4.9 |
| Printing, Reproduction of Recording Media | 0.0 | 0.0 | 0.6 |
| Processing of Petroleum, Coking, Processing of Nucleus Fuel | -0.2 | -9.6 | -1.8 |
| Manufacture of Chemical Raw Material and Chemical Products | 0.2 | -5.5 | -3.3 |
| Manufacture of Medicines | 0.0 | 1.1 | 2.0 |
| Manufacture of Chemical Fibers | -0.8 | -13.0 | -4.0 |
| Manufacture of Rubber and Plastics Products | 0.1 | -1.1 | -0.3 |
| Manufacture of Non-metallic Mineral Products | 0.2 | 1.3 | 2.8 |
| Manufacture and Processing of Ferrous Metals | -1.3 | -5.8 | -1.4 |
| Manufacture and Processing of Non-Ferrous Metals | 1.1 | 1.0 | -1.1 |
| Manufacture of Fabricated Metal Products | 0.0 | 0.2 | 1.2 |
| Manufacture of General- Purpose Machinery | 0.1 | 0.8 | 0.9 |
| Manufacture of Motor Vehicles | 0.0 | -0.8 | -0.7 |
| Manufacture of Railway Locomotives, Building of Ships and Boats, Manufacture of Air and Spacecrafts and Other Transportation Equipments | 0.0 | 0.4 | 0.2 |
| Manufacture of Computer, Communication Equipment and Other Electronic Equipment | 0.6 | -1.7 | -0.4 |
| Production and Supply of Electric Power and Heat Power | -0.3 | -1.0 | -1.0 |
| Production and Distribution of Gas | -0.1 | 0.3 | 4.2 |
| Production and Distribution of Water | 0.0 | 2.0 | 2.2 |
|
|
|
|
|
Annotations:
1. Explanatory Notes
Producer Price Index for manufactured goods consists of producer price index and purchaser price index.
The industrial producer price index reflects the trend and level of prices change when the products are sold for the first time.
The industrial purchaser price index reflects the trend and level of prices change for the products purchased by the industrial enterprises as intermediate inputs.
2. Statistical Coverage
The statistical survey of industrial producer prices covers prices for over 20,000 products from 1638 subclasses; and the statistical surveys of industrial purchaser prices cover prices for over 10,000 industrial products from over 900 subclasses.
3. Survey Methods
Industrial producer prices are collected from combined surveys of key businesses and typical businesses. The key businesses are those with their annual revenue from principal activities over 20 million yuan, and the typical businesses are those with less than 20 million yuan. The surveys cover about 50,000 industrial enterprises in over 400 cities across the country.
4. Statistical Standard
Industrial Classification is based on the “Industrial Classification for National Economic Activities” (GB/T4754-2017).