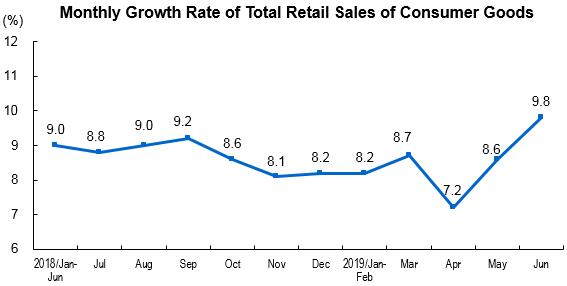
Total Retail Sales of Consumer Goods up by 8.4 percent in First Half of 2019
In the first half of 2019, the total retail sales of consumer goods reached 19,521 billion yuan, up by 8.4 percent year-on-year nominal growth rate. (The real growth rate was 6.7 percent increase. The follows are nominal growth rates if there’s no additional explanation.) Of which, the total retail sales of consumer goods reached 3,387.8 billion yuan, up by 9.8 percent year-on-year in June.
In terms of different areas, the retail sales of consumer goods in urban areas was 16,692.4 billion yuan in the first half of 2019, up by 8.3 percent year-on-year; while that in rural areas was 2,828.6 billion yuan, up by 9.1 percent year-on-year. Of which, the retail sales of consumer goods in urban areas was 2,895.9 billion yuan, up by 9.8 percent year-on-year; while that in rural areas was 491.9 billion yuan, up by 10.1 percent.
In terms of different consumption patterns, the catering services in the first half of 2019 gained 2,127.9 billion yuan, up by 9.4 percent year-on-year. The retail sales of goods gained 17,393 billion yuan, up by 8.3 percent. Of the total, in June, the catering services gained 372.3 billion yuan, up by 9.5 percent year-on-year; the retail sales of goods gained 3,015.5 billion yuan, up by 9.9 percent.
In terms of different Retail format, of the total retail sale, the supermarket, store, pro shop and exclusive shop above designated size went up by 7.4, 1.5, 5.3 and 3.0 percent respectively.
In the first half of 2019, the national online retail sales of goods and services was 4,816.1 billion yuan, increased by 17.8 percent year-on-year. Of which, the online retail sales of physical goods was 3,816.5 billion yuan, increased by 21.6 percent, accounting for 19.6 percent of the total retail sales of consumer goods; of the online retail sales of physical goods, food, clothing and using goods went up by 29.3, 21.4 and 20.9 percent respectively.
| Total Retail Sales of Consumer Goods In The First Half Of 2019 |
| ||||
| Item | June | Jan-Jun |
| ||
| Absolute Value (100 million yuan) | Y/Y (%) | Absolute Value (100 million yuan) | Y/Y (%) |
| |
|
|
|
|
|
|
|
| Total Retail Sales of Consumer Goods | 33878 | 9.8 | 195210 | 8.4 | |
| Of Which: Retail Sales of the Enterprises (units) above Designated Size | 13163 | 9.7 | 71124 | 4.9 | |
| Of Which: Online Retail Sales of Physical Goods | - | - | 38165 | 21.6 | |
| Grouped by Different Areas |
|
|
|
| |
| City | 28959 | 9.8 | 166924 | 8.3 | |
| At and Below County Level | 4919 | 10.1 | 28286 | 9.1 | |
| Grouped by Consumption Patterns |
|
|
|
| |
| Catering Services | 3723 | 9.5 | 21279 | 9.4 | |
| Of which: Income of Catering Services of the Enterprises (units) above Designated Size | 789 | 7.6 | 4497 | 7.2 | |
| Retail Sales of Goods | 30155 | 9.9 | 173930 | 8.3 | |
| Of which: Income of Retail Sales of Goods of the Enterprises (units) above Designated Size | 12375 | 9.8 | 66627 | 4.7 | |
| Of which: Grain, Oil, Foodstuff | 1196 | 9.8 | 6965 | 10.4 | |
| Beverages, | 188 | 9.1 | 993 | 9.9 | |
| Tobacco and Liquor | 311 | 8.2 | 1911 | 6.0 | |
| Garments, Footwear, Hats, Knitwear | 1091 | 5.2 | 6560 | 3.0 | |
| Cosmetics | 265 | 22.5 | 1462 | 13.2 | |
| Gold, Silver and Jewelry | 218 | 7.8 | 1354 | 3.5 | |
| Commodities | 523 | 12.3 | 2826 | 14.1 | |
| Household Appliances and AV Equipment | 963 | 7.7 | 4392 | 6.7 | |
| Traditional Chinese and Western Medicines | 512 | 10.4 | 2937 | 10.9 | |
| Cultural and Office Appliances | 321 | 6.5 | 1482 | 4.2 | |
| Furniture | 184 | 8.3 | 896 | 5.7 | |
| Communication Appliances | 477 | 5.9 | 2244 | 7.4 | |
| Petroleum and Related Products | 1705 | 3.5 | 9690 | 3.1 | |
| Automobile | 3669 | 17.2 | 19113 | 1.2 | |
| Building and Decoration Materials | 179 | 1.1 | 907 | 3.6 | |
|
|
|
|
|
|
|
| Notes: 1.The growth rate in this table are all nominal growth rate. 2.For parts of data, the total is not equal to the total of sub-items due to round-off. | |||||
Annotations:
1. Explanatory Notes
Total Retail Sales of Consumer Goods: refers to the sales of physical commodity or the income of catering services sold or provided by enterprises (units) to individuals, social organizations for non-production and non-operation purposes.
Online Retail Sales: refers to the sales of goods and services got through public online trading platform (including self-built websites and third-party platform). Goods and services include physical goods and non-physical goods (such as virtual product, services).
The total retail sales of consumer goods includes online retail sales of physical goods, excludes online retail sales of non-physical goods.
2.Statistical Coverage
The corporate enterprises, industrial activity units or self-employed individuals which retail goods or provide catering services. Enterprises (units) above designated size refer to those wholesale enterprises (units) with an annual revenue from primary business of 20 million yuan and above, those retail enterprises (units) with an annual revenue from primary business of 5 million yuan and above, and those hotel and catering enterprises (units) with an annual revenue from primary business of 2 million yuan and above.
Due to the limitation above wholesale and retail trade, accommodation and catering enterprises (units) scope change every year, in order to ensure that compared with the previous year’data, retail sales of consumer goods and other indicators calculation limitation above unit adopted by the year-on-year growth rate over the same period number and the current statistical coverage of enterprises (units) of consistent, caliber differences and data released last year.Main reason :(a) every year has partial enterprise (unit) achieve limitation standard to bring into investigation limits, also have partial enterprise (unit) because dimensions decrescent does not amount to limitation standard to exit investigation limits, still have the effect of enterprise of new start business, bankrupt, cancelled an enterprise (unit).(2) the monthly report of 2019, in combination with the results of the inventory of units in the fourth national economic census (August to December 2018), re-verify the identification of units above the quota at the end of 2018. Enterprises (units) that fail to meet the quota shall be included in the survey scope of units below the quota.
3. Survey Methods
All enterprises (units) above designated size are surveyed, while the data of enterprises (units) below designated size are collected by sampling survey.
4. Month-on-Month Figure Revision
According to the auto-revision function of the seasonal adjustment model, the growth rate of the total retail sales of consumer goods since June 2018 was revised. The revised figures and figures in June 2019 are as follows:
| The Month-on-Month Growth Rate of Total Retail Sales of Consumer Goods
| |
| Months | Growth Rate (%) |
|
| |
| 2018-June | 0.71 |
| July | 0.89 |
| August | 0.79 |
| September | 0.74 |
| October | 0.79 |
| November | 0.71 |
| December | 0.72 |
| 2019-January | 0.91 |
| February | 0.49 |
| March | 0.99 |
| April | 0.51 |
| May | 0.75 |
| June | 0.96 |
|
| |