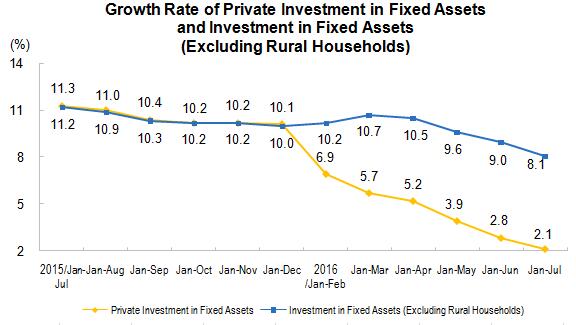
Private Investment in Fixed Assets for the First Seven Months of 2016
In the first seven months of 2016, the private investment in fixed assets reached 19,149.5 billion yuan, a year-on-year increase of 2.1 percent in nominal terms, and the growth rate was 0.7 percentage points lower than that in the first six months. The proportion of private investment in fixed assets to the total investment in fixed assets (excluding rural households) was 61.4 percent, 3.6 percentage points lower than that in the same period last year.
In term of different areas, the private investment in fixed assets in eastern region amounted to 8,757.7 billion yuan, rose by 7.1 percent year-on-year, a decrease of 1.1 percentage points over the first six months; that of central region, 5,572.1 billion yuan, increased 5.6 percent, an increase of 0.5 percentage points; that of western region, 3,685.2 billion yuan, increased 1.3 percent, a decrease of 0.6 percentage points; that of northeastern region, 1,134.6 billion yuan, decreased 31.6 percent, and the pace of decline narrowed by 0.3 percentage points.
In term of different industries, the private investment in fixed assets in primary industry reached 736.3 billion yuan, a year-on-year increase of 17.7 percent, and the growth rate decreased 2.0 percentage points over the first six months; that in the secondary industry amounted to 9,634.4 billion yuan, increased 2.2 percent, a decrease of 0.6 percentage points; that in the tertiary industry was 8,778.7 billion yuan, went up by 0.9 percent, decreased 0.7 percentage points.
Of the secondary industry, industrial private investment in fixed assets reached 9,546.0 billion yuan, a year-on-year increase of 2.4 percent, and the growth rate went down by 0.5 percentage points over the first six months, of which, that of mining industry was 309.8 billion yuan, decreased 19.0 percent, and the pace of decline widened by 1.3 percentage points; that of the manufacturing industry was 8,647.4 billion yuan, increased 2.1 percent, down by 0.4 percentage points; that of the production and supply of electric power, heat power, gas and water was 588.8 billion yuan, increased 23.6 percent, down by 3.6 percentage points.
| Private Investment in Fixed Assets for the First Seven Months of 2016
| ||
| Indicators | Jan-Jul | |
| Absolute Value | Increase rate Y/Y | |
| (100 Million Yuan) | (%) | |
|
|
|
|
| Private Investment in Fixed Assets | 191495 | 2.1 |
|
|
| |
| Eastern Region | 87577 | 7.1 |
| Central Region | 55721 | 5.6 |
| Western Region | 36852 | 1.3 |
| Northeastern Region | 11346 | -31.6 |
| Grouped by Types of Industry |
|
|
| Primary Industry | 7363 | 17.7 |
| Secondary Industry | 96344 | 2.2 |
| Tertiary Industry | 87787 | 0.9 |
| Grouped by Industrial Sectors |
|
|
| Agriculture, Forestry, Animal Husbandry and Fishery | 8235 | 15.6 |
| Mining | 3098 | -19.0 |
| Of which: Mining and Washing of Coal | 842 | -30.5 |
| Extraction of Petroleum and Natural Gas | 105 | -20.7 |
| Ore Mining, Smelting and Pressing of Ferrous Metals | 422 | -37.4 |
| Ore Mining, Smelting and Pressing of Non-Ferrous Metal | 580 | -3.4 |
| Ore Mining, Processing of Non-Metallic Minerals | 1031 | -3.3 |
| Manufacturing | 86474 | 2.1 |
| Of which: Manufacture of Non-metallic Mineral Products | 8276 | -4.2 |
| Smelting and Pressing of Ferrous Metals | 1809 | -0.2 |
| Smelting and Pressing of Non-Ferrous Metal | 2532 | -6.7 |
| Manufacture of General Purpose Machinery | 6546 | -2.2 |
| Manufacture of Special Purpose Machinery | 5765 | -4.7 |
| Manufacture of automobile | 5152 | 13.0 |
| Manufacture of railways, shipbuilding, aerospace and other transportation equipment | 1138 | -7.0 |
| Manufacture of Electrical Machinery & Equipment | 5969 | 8.6 |
| Manufacture of Telecommunications Equipment, Computers and Other Electronic Equipment | 3406 | 4.4 |
| Production and Supply of Electricity ,Gas and Water | 5888 | 23.6 |
| Of which: Production and Supply of Electric Power and Heat Power | 4604 | 35.4 |
| Construction | 1086 | -12.8 |
| Transport, Storage and Post | 6415 | 1.4 |
| Of which: Railway Transportation | 107 | -30.4 |
| Road Transportation | 2352 | 7.1 |
| Management of Water Conservancy, Environment and Public Facilities | 7715 | 7.0 |
| Of which: Management on Water Resource | 641 | 25.0 |
| Management on Public Facilities | 6632 | 6.1 |
| Education | 1285 | 16.7 |
| Health, Social Works | 1198 | 17.2 |
| Culture, Sports and Entertainment | 2063 | -2.7 |
| Public Management, Social Security and Social Organizations | 901 | -23.0 |
|
|
|
|
| Notes: For parts of data, the total is not equal to the total of sub-items due to round-off. | ||
Annotations:
1. Explanatory Notes on Indicators
Private investment in fixed assets refers to the investment in construction and purchase of fixed assets within the territory of the People's Republic of China, by collective, private, and personal domestic enterprises and institutional units as well as the enterprises controlled (including absolutely controlled and relatively controlled) by these units.
2. Statistical Coverage
The statistical coverage of private investment in fixed assets is determined according to the types of industrial and commercial registration of the fixed assets investment projects units, which includes:
(1) The investment in fixed assets of collective enterprises, joint-stock cooperative enterprises, private enterprises, private partnerships, private limited liability companies, self-employed businessmen, individual partnerships and other pure non-governmental entities with industrial and commercial registration;
(2) All the investment in fixed assets of the main investment units, which are controlled by collective enterprises, private enterprises and individuals in the mixed economic components with industrial and commercial registration.
3. Data Collection
Private investment in fixed assets is a part of investment in fixed assets, and the reports of private investment on fixed assets are collected monthly with complete enumeration (no report in January), which is the same as the report of investment on fixed assets.
4. Classification on East, Central and West Region
Eastern region: including Beijing, Tianjin, Hebei, Shanghai, Jiangsu, Zhejiang, Fujian, Shandong, Guangdong and Hainan. Central region: including Shanxi, Anhui, Jiangxi, Henan, Hubei and Hunan. Western region: including Inner Mongolia, Guangxi, Chongqing, Sichuan, Guizhou, Yunnan, Tibet, Shaanxi, Gansu, Qinghai, Ningxia and Xinjiang. Northeastern region: including Liaoning, Jilin and Heilongjiang.
5. Standard Industrial Classification
The NBS performed the new standard on industrial classification for national economic activities (GB/T4754-2011), please refer to http://www.stats.gov.cn/tjsj/tjbz/hyflbz
6. Explanatory Notes on Growth Rate
The growth rate of private investment in fixed assets is nominal growth rate, because the price indices of investment in fixed assets are calculated on quarterly basis, except Jan.-Mar., Jan.-Jun., Jan-Sep. and Jan.-Dec., the growth rates in the other months are nominal growth rates.