Consumer Prices for January 2016
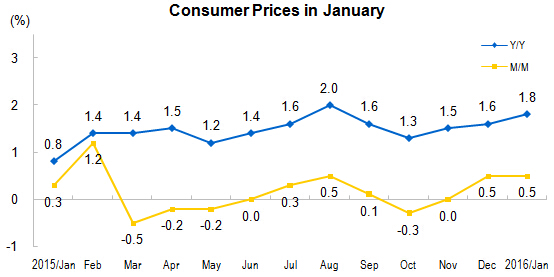
In January, the consumer price index (CPI) went up by 1.8 percent year-on-year. The prices grew by 1.8 percent in cities and 1.5 percent in rural areas. The food prices went up by 4.1 percent, and the non-food prices increased 1.2 percent. The prices of consumer goods went up by 1.5 percent and the prices of services grew by 2.2 percent.
In January, the consumer prices increased 0.5 percent month-on-month. Of which, prices increased 0.5 percent in both cities and rural areas. The food prices went up by 2.0 percent, and the non-food prices went up by 0.2 percent. The prices of consumer goods increased 0.6 percent, and the prices of services increased 0.4 percent.
I. Year-on-Year Changes of Prices of Different Categories
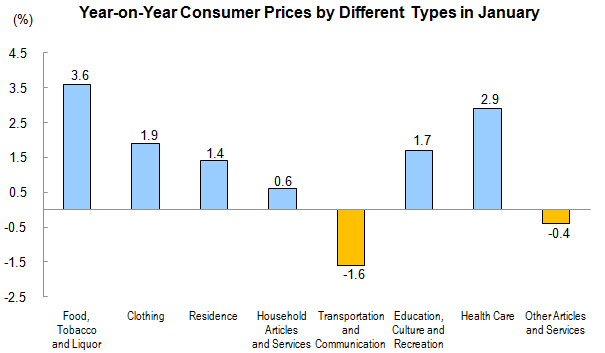
In January, prices of food, tobacco and liquor, went up by 3.6 percent year-on-year, affecting nearly 1.07 percentage points increase in the CPI. Of which, the prices of fresh vegetables, went up by 14.7 percent, affecting nearly 0.37 percentage points increase in the CPI; meat, up by 10.8 percent, affecting nearly 0.47 percentage points increase in the CPI (price of pork was up by 18.8 percent, affecting nearly 0.44 percentage points increase in the CPI); aquatic products, up by 2.7 percent, affecting nearly 0.05 percentage points increase in the CPI; grain, up by 0.7 percent, affecting nearly 0.02 percentage points increase in the CPI; fresh fruits, down by 6.8 percent, affecting nearly 0.12 percentage points decrease in the CPI; eggs, down by 3.9 percent, affecting nearly 0.03 percentage points decrease in the CPI.
In January, among the prices of the other seven categories, five increased and two decreased. Of which, the prices of health care, clothing, education, culture and recreation, residence, household articles and services, increased 2.9, 1.9, 1.7, 1.4 and 0.6 percent respectively, that of transportation and communication, other articles and services, decreased 1.6 and 0.4 percent respectively.
II. Month-on-Month Changes of Prices of Different Categories
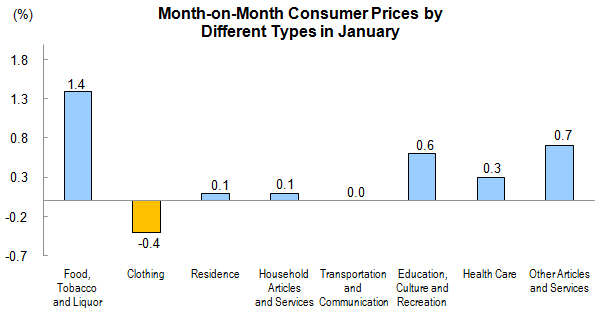
In January, prices of food, tobacco and liquor increased 1.4 percent month-on-month, affecting nearly 0.42 percentage points increase in the CPI. Of which, prices for fresh vegetables went up by 7.2 percent, affecting nearly 0.19 percentage points increase in the CPI; fresh fruits, up by 4.0 percent, affecting nearly 0.06 percentage points increase in the CPI; eggs, increased 3.3 percent, affecting nearly 0.02 percentage points increase in the CPI; aquatic products, up by 2.3 percent, affecting nearly 0.04 percentage points increase in the CPI; meat, increased 1.5 percent, affecting nearly 0.07 percentage points increase in the CPI (price of pork was up by 2.5 percent, affecting nearly 0.07 percentage points increase in the CPI).
In January, among the prices of the other seven categories, five increased, one decreased, and one kept at the same level. Of which, the prices of other articles and services, education, culture and recreation, health care, residence, household articles and services, increased 0.7, 0.6, 0.3, 0.1 and 0.1 percent respectively, that of clothing decreased 0.4 percent, and that of transportation and communication kept at the same level.
| Consumer Prices in January
| ||
| Items | January | |
| M/M (%) | Y/Y (%) | |
| Consumer Prices | 0.5 | 1.8 |
| Of which: Urban | 0.5 | 1.8 |
| Rural | 0.5 | 1.5 |
| Of which: Food | 2.0 | 4.1 |
| Non food | 0.2 | 1.2 |
| Of which: Consumer Goods | 0.6 | 1.5 |
| Services | 0.4 | 2.2 |
| Of which: Excluding Food and Energy | 0.2 | 1.5 |
| Of which: Excluding Fresh Vegetables and Fresh Fruits | 0.3 | 1.6 |
| By Commodity Categories |
|
|
| I. Food, Tobacco and Liquor | 1.4 | 3.6 |
| Grain | -0.1 | 0.7 |
| Cooking Oil | 0.1 | 0.2 |
| Fresh Vegetables | 7.2 | 14.7 |
| Meat | 1.5 | 10.8 |
| Of which: Pork | 2.5 | 18.8 |
| Beef | 0.2 | -0.1 |
| Mutton | -0.5 | -9.5 |
| Aquatic Products | 2.3 | 2.7 |
| Eggs | 3.3 | -3.9 |
| Dairy products | 0.0 | 0.0 |
| Fresh Fruits | 4.0 | -6.8 |
| Tobacco | 0.0 | 6.5 |
| Liquor | -0.3 | 0.0 |
| II. Clothing | -0.4 | 1.9 |
| Clothing | -0.4 | 1.9 |
| Clothing Processing Service | 0.8 | 3.9 |
| Shoes | -0.3 | 2.0 |
| III. Residence | 0.1 | 1.4 |
| House Renting | -0.1 | 2.6 |
| Water, Electricity, and Fuel | 0.3 | -0.7 |
| IV. Household Articles and Services | 0.1 | 0.6 |
| Household Appliances | -0.1 | -0.8 |
| Household Services | 1.9 | 5.3 |
| V. Transportation and Communication | 0.0 | -1.6 |
| Transportation Facilities | -0.1 | -2.2 |
| Fuels for Vehicles | -0.7 | -7.1 |
| Vehicle Use and Maintenance | 0.3 | 1.5 |
| Communication Facilities | -0.4 | -3.9 |
| Communication Services | -0.2 | -0.3 |
| Postal Services | 0.1 | 0.8 |
| VI. Education, Culture and Recreation | 0.6 | 1.7 |
| Education Services | 0.1 | 2.1 |
| Tourism | 3.7 | 3.7 |
| VII. Health Care | 0.3 | 2.9 |
| Traditional Chinese Medicines | 0.4 | 4.1 |
| Western Medicines | 0.4 | 2.3 |
| Health Care Services | 0.2 | 3.0 |
| VIII. Other Articles and Services | 0.7 | -0.4 |
Annotations:
1. Explanatory Notes
Consumer Price Index (CPI) is an index measuring changes over time in the price level of consumer goods and services purchased by residents, which comprehensively reflects the changes of price level.
2. Statistical Coverage
Consumer Price Index (CPI) covers the prices of goods and services of 8 categories and 262 basic divisions which cover the living consumption of urban and rural residents, including food, tobacco and liquor; clothing; residence; household articles and services; transportation and communication; education, culture and recreation; health care; other articles and services.
3. Survey Methods
The prices collection units are selected and determined by sample survey methods, and the original data of consumer prices are collected by specific person in fixed place at fixed time. Data are collected from 83,000 prices collection units in 500 cities and counties of the 31 provinces (autonomous regions and municipalities), which cover shopping malls, supermarkets, open fairs, service outlets and Internet E-commerce suppliers.
4. Rotation of the Base Period
Since 2001, in accordance with the requirements of the statistical system, the base period of China's CPI was rotated every five years. Beginning in January 2016, 2015 was used as a base period in the new round of rotation, and the base periods in the previous three rounds were 2000, 2005 and 2010. Compared with the base period in the last round, the survey directory and specifications of the new base period were closer to international standards, and a number of new products and services were included, which could further reflect changes in consumption and economic structure. At the same time, the weight numbers of CPI composition were adjusted accordingly, according to the latest results of the survey on residents income and expenditure. The survey directory of the new base period was revised following the Classification of Individual Consumption According to Purpose (COICOP) developed by the United Nations and the Classification of Household Consumption Expenditure (2013) enacted by the NBS (http://www.stats.gov.cn/tjsj/tjbz/201310/P020131021349384303616.pdf). According to estimation, the current rotation of the base period had almost no influence on the month-on-month data of CPI, and a little influence on the year-on-year data, which was about 0.08 percentage points.