Communiqué on Major Data of the Third National Economic Census (No. 2)
Communiqué on Major Data of the
Third National Economic Census
(No. 2)
National Bureau of Statistics of China
Office of the Leading Group of the State Council for the
Third National Economic Census
December 16, 2014
Based on the results of the Third National Economic Census, the major data of the secondary industry are released as the following:
I. Industry
1. Number of Corporate Enterprises and Persons Employed
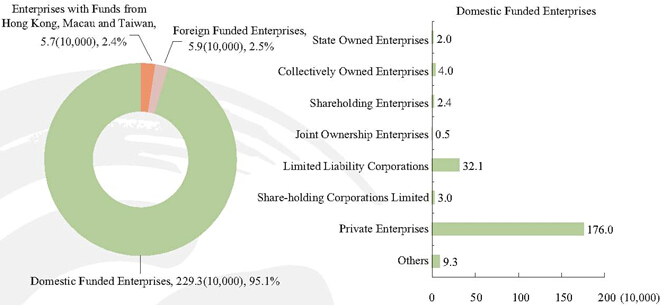
At the end of 2013, there were 2.41 million industrial corporate enterprises nationwide with 140.258 million persons employed, up by 26.6 percent and 19.5 percent respectively compared with that at the end of 2008.
Among the industrial corporate enterprises, there were 2.293 million domestic funded enterprises, taking up 95.1 percent; 57 thousand enterprises with funds from Hong Kong, Macau and Taiwan, taking up 2.4 percent; and 59 thousand foreign funded enterprises, taking up 2.5 percent. Among domestic funded enterprises, the number of state owned enterprises was 20 thousand, taking up 0.8 percent of all enterprises; collectively owned enterprises 40 thousand , taking up 1.7 percent; private enterprises 1.76 million, taking up 73 percent.
Among the persons employed by industrial corporate enterprises, those of domestic funded enterprises took up 80.3 percent, enterprises with funds from Hong Kong, Macau and Taiwan 9.6 percent and foreign funded enterprises 10.1 percent. Among domestic funded enterprise, state owned enterprises accounted for 3.4 percent, collectively owned enterprises 1.2 percent and private enterprises 44.7 percent. (Table 2-1)
Table 2-1 Number of Industrial Corporate Enterprises and Persons Employed, by Status of Registration
|
| Corporate Enterprise (10,000) | Persons Employed (10,000) |
|
|
|
|
| Total | 241.0 | 14025.8 |
| Domestic Funded Enterprises | 229.3 | 11259.2 |
| State Owned Enterprises | 2.0 | 478.5 |
| Collectively Owned Enterprises | 4.0 | 173.6 |
| Shareholding Enterprises | 2.4 | 62.2 |
| Joint Ownership Enterprises | 0.5 | 19.8 |
| Limited Liability Corporations | 32.1 | 3194.8 |
| Share-holding Corporations Limited | 3.0 | 847.6 |
| Private Enterprises | 176.0 | 6272.2 |
| Others | 9.3 | 210.4 |
| Enterprises with Funds from Hong Kong, Macau and Taiwan | 5.7 | 1343.1 |
| Foreign Funded Enterprises | 5.9 | 1423.6 |
|
|
|
|
Figure 2-1 Number of Industrial Corporate Enterprises by Status of Registration
Among industrial corporate enterprises, there were 89 thousand mining enterprises, 2.252 million manufacturing enterprises and 69 thousand enterprises of electricity, heat power, gas and water production and supply, taking up 3.7 percent, 93.4 percent and 2.9 percent respectively.
In terms of persons employed by industrial cooperate enterprises, mining industry took up 7.4 percent; manufacturing 89.2 percent; and production and supply of electricity, heat power, gas and water 3.4 percent. Within the entire sector of industry, the top three divisions were the manufacture of computer, communication equipment and other electronic equipment; the manufacture of non-metallic ore products; and the manufacture of electrical machinery and equipment, taking up 7.3 percent, 7 percent and 6 percent respectively. (Table 2-2)
Table 2-2 Number of Industrial Cooperate Enterprises and Persons Employed, by Division
|
| Cooperate Enterprise (10,000) | Persons Employed (10,000) |
|
|
|
|
| Total | 241.0 | 14025.8 |
| Mining and Washing of Coal | 1.9 | 611.3 |
| Extraction of Petroleum and Natural Gas | 0.05 | 80.1 |
| Mining and Processing of Ferrous Metal Ores | 1.5 | 98.6 |
| Mining and Processing of Non-ferrous Ores | 1.0 | 76.2 |
| Mining and Processing of Nonmetal Ores | 4.1 | 124.9 |
| Supporting Activities for Mining | 0.3 | 39.7 |
| Mining of Other Ores | 0.2 | 4.2 |
| Processing of Food from Agricultural Products | 10.4 | 584.1 |
| Manufacture of Foods | 4.7 | 289.5 |
| Manufacture of Alcohol, Beverage and Refined Tea | 3.8 | 219.3 |
| Manufacture of Tobacco | 0.04 | 21.8 |
| Manufacture of Textile | 10.8 | 663.7 |
| Manufacture of Textile Wearing Apparel and Accessories | 12.1 | 750.8 |
| Manufacture of Leather, Fur, Feather and Related Products and Footwear | 5.6 | 441.9 |
| Processing of Timber, Manufacture of Wood, Bamboo, Rattan, Palm and Straw Products | 7.0 | 265.4 |
| Manufacture of Furniture | 4.6 | 199.1 |
| Manufacture of Paper and Paper Products | 5.4 | 219.8 |
| Printing and Reproduction of Record Media | 6.7 | 195.1 |
| Manufacture of Articles for Culture, Education, Arts and Crafts | 7.5 | 371.6 |
| Processing of Petroleum, Coking and Processing of Nuclear Fuel | 0.7 | 105.7 |
| Manufacture of Raw Chemical Materials and Chemical Products | 10.2 | 655.3 |
| Manufacture of Medicines | 1.9 | 242.7 |
| Manufacture of Chemical Fibers | 0.6 | 56.2 |
| Manufacture of Rubber and Plastic Products | 13.9 | 547.1 |
| Manufacture of Non-metallic Mineral Products | 21.3 | 987.8 |
| Smelting and Pressing of Ferrous Metals | 3.7 | 471.8 |
| Smelting and Pressing of Non-ferrous Metals | 2.6 | 243.5 |
| Manufacture of Metal Products | 19.1 | 663.9 |
| Manufacture of General Purpose Machinery | 21.7 | 789.4 |
| Manufacture of Special Purpose Machinery | 14.3 | 580.2 |
| Manufacture of Automobile | 5.4 | 529.2 |
| Manufacture of Railway, Ships, Aerospace and Other Transportation Equipments | 2.6 | 236.6 |
| Manufacture of Electrical Machinery and Equipment | 13.8 | 844.2 |
| Manufacture of Computer, Communication Equipment and Other Electronic Equipment | 7.3 | 1028.3 |
| Manufacture of Measuring Instruments and Machinery | 3.0 | 157.7 |
| Other Manufacturing | 2.3 | 78.3 |
| Comprehensive Utilization of Waste | 0.9 | 29.9 |
| Repairing of Metallic Products, Machinery and Equipment | 1.3 | 40.0 |
| Production and Supply of Electricity and Heat Power | 4.5 | 370.1 |
| Production and Supply of Gas | 0.6 | 34.6 |
| Production and Supply of Water | 1.8 | 76.3 |
|
|
|
|
2. Total Assets
At the end of 2013, the total assets of industrial corporate enterprises reached 105.19934 trillion yuan, an increase of 122.4 percent compared with that at the end 2008. (Table 2-3)
Table 2-3 Total Assets of Industrial Corporate Enterprises by Division
|
| Total Assets (100 million yuan) |
|
|
|
| Total | 1051993.4 |
| Mining and Washing of Coal | 56624.7 |
| Extraction of Petroleum and Natural Gas | 20702.2 |
| Mining and Processing of Ferrous Metal Ores | 12191.3 |
| Mining and Processing of Non-ferrous Ores | 6412.5 |
| Mining and Processing of Nonmetal Ores | 5536.1 |
| Supporting Activities for Mining | 3839.4 |
| Mining of Other Ores | 208.3 |
| Processing of Food from Agricultural Products | 34652.5 |
| Manufacture of Foods | 13949.1 |
| Manufacture of Alcohol, Beverage and Refined Tea | 15271.8 |
| Manufacture of Tobacco | 8039.8 |
| Manufacture of Textile | 27736.5 |
| Manufacture of Textile Wearing Apparel and Accessories | 15604.4 |
| Manufacture of Leather, Fur, Feather and Related Products and Footwear | 8815.7 |
| Processing of Timber, Manufacture of Wood, Bamboo, Rattan, Palm and Straw Products | 7652.5 |
| Manufacture of Furniture | 5996.6 |
| Manufacture of Paper and Paper Products | 15161.6 |
| Printing and Reproduction of Record Media | 7200.4 |
| Manufacture of Articles for Culture, Education, Arts and Crafts | 10239.8 |
| Processing of Petroleum, Coking and Processing of Nuclear Fuel | 25067.4 |
| Manufacture of Raw Chemical Materials and Chemical Products | 74972.5 |
| Manufacture of Medicines | 20507.2 |
| Manufacture of Chemical Fibers | 6770.1 |
| Manufacture of Rubber and Plastic Products | 24664.3 |
| Manufacture of Non-metallic Mineral Products | 54617.1 |
| Smelting and Pressing of Ferrous Metals | 68623.2 |
| Smelting and Pressing of Non-ferrous metals | 34927.4 |
| Manufacture of Metal Products | 30818.9 |
| Manufacture of General Purpose Machinery | 47336.2 |
| Manufacture of Special Purpose Machinery | 43047.8 |
| Manufacture of Automobile | 51988.4 |
| Manufacture of Railway, Ships, Aerospace and Other Transportation Equipment | 22307.0 |
| Manufacture of Electrical Machinery and Equipment | 57201.0 |
| Manufacture of Computers, Communication Equipment and Other Electronic Equipment | 57324.0 |
| Manufacture of Measuring Instruments and Machinery | 8081.4 |
| Other Manufacturing | 3744.5 |
| Comprehensive Utilization of Waste | 2265.8 |
| Repairing of Metallic Products, Machinery and Equipment | 1771.8 |
| Production and Supply of Electricity and Heat Power | 119890.9 |
| Production and Supply of Gas | 7196.5 |
| Production and Supply of Water | 13034.9 |
|
|
|
3. Asset Contribution Rate
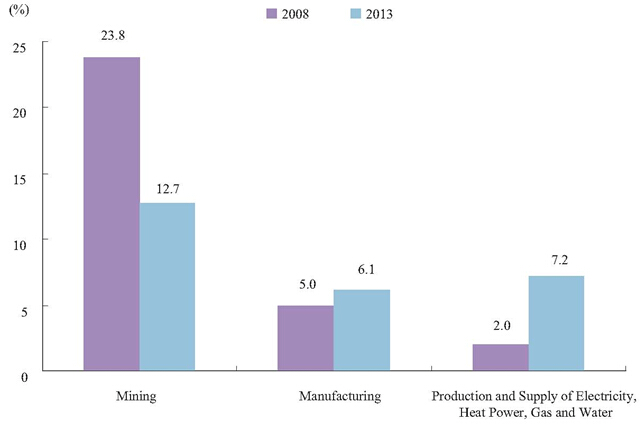
In 2013, the asset contribution rate of industrial corporate enterprises above designated size was 14.8 percent, 0.8 percentage point higher than that in 2008. The profit margin from the principal activities was 6.6 percent, or 0.5 percentage point higher than that in 2008.The asset contribution rate of mining industry was 12.7 percent, 11.1 percentage points lower than that in 2008; manufacturing, 6.1 percent, 1.1 percentage points higher; and production and supply of electricity, heat power, gas and water, 7.2 percent, 5.2 percentage points higher. (Table 2-4)
Table 2-4 Asset Contribution Rate of Industrial Corporate Enterprises above Designated Size by Division
|
| Asset Contribution Rate (%) |
|
|
|
| Total | 14.8 |
| Mining and Washing of Coal | 12.3 |
| Extraction of Petroleum and Natural Gas | 31.6 |
| Mining and Processing of Ferrous Metal Ores | 20.6 |
| Mining and Processing of Non-ferrous Ores | 21.0 |
| Mining and Processing of Nonmetal Ores | 24.1 |
| Supporting Activities for Mining | 5.0 |
| Mining of Other Ores | 18.5 |
| Processing of Food from Agricultural Products | 19.7 |
| Manufacture of Foods | 21.7 |
| Manufacture of Alcohol, Beverage and Refined Tea | 22.8 |
| Manufacture of Tobacco | 83.7 |
| Manufacture of Textile | 16.6 |
| Manufacture of Textile Wearing Apparel and Accessories | 18.7 |
| Manufacture of Leather, Fur, Feather and Related Products and Footwear | 20.6 |
| Processing of Timber, Manufacture of Wood, Bamboo, Rattan, Palm and Straw Products | 26.5 |
| Manufacture of Furniture | 17.3 |
| Manufacture of Paper and Paper Products | 11.0 |
| Printing and Reproduction of Record Media | 16.7 |
| Manufacture of Articles for Culture, Education, Arts and Crafts | 18.9 |
| Processing of Petroleum, Coking and Processing of Nuclear Fuel | 24.4 |
| Manufacture of Raw Chemical Materials and Chemical Products | 13.3 |
| Manufacture of Medicines | 18.6 |
| Manufacture of Chemical Fibers | 8.9 |
| Manufacture of Rubber and Plastic Products | 16.2 |
| Manufacture of Non-metallic Mineral Products | 16.7 |
| Smelting and Pressing of Ferrous Metals | 7.6 |
| Smelting and Pressing of Non-ferrous metals | 10.7 |
| Manufacture of Metal Products | 15.5 |
| Manufacture of General Purpose Machinery | 13.8 |
| Manufacture of Special Purpose Machinery | 12.4 |
| Manufacture of Automobile | 18.8 |
| Manufacture of Railway, Ships, Aerospace and Other Transportation Equipments | 8.0 |
| Manufacture of Electrical Machinery and Equipment | 13.3 |
| Manufacture of Computer, Communication and Other Electronic Equipment | 11.7 |
| Manufacture of Measuring Instruments and Machinery | 15.6 |
| Other Manufacturing | 12.1 |
| Comprehensive Utilization of Waste | 20.2 |
| Repairing of Metallic Products, Machinery and Equipment | 7.4 |
| Production and Supply of Electricity and Heat Power | 8.5 |
| Production and Supply of Gas | 10.7 |
| Production and Supply of Water | 3.6 |
|
|
|
Figure 2-2 Changes of Profit Margin from the Principal Activities of Industrial Corporate Enterprises above Designated Size
4. Research and Experimental Development of Enterprises
There were 54,832 industrial corporate enterprises above designated size engaged in R&D activities in 2013, an increase of 101 percent compared with that in 2008, accounting for 14.8 percent of all the industrial corporate enterprises above designated size.
In 2013, the full-time equivalent of R&D personnel in industrial corporate enterprises above designated size was 2.494 million man-year, an increase of 102.8 percent compared with that in 2008.
In 2013, industrial corporate enterprises above designated size invested 831.84 billion yuan in R&D, an increase of 170.7 percent compared with that in 2008. The R&D input intensity was 0.8 percent, 0.23 percentage point higher than that in 2008. See Table 2-5 for R&D expenditures and input intensity in R&D by industrial corporate enterprises above designated size.
Table 2-5 R&D Expenditures and Input Intensity of Industrial Corporate Enterprises above Designated Size by Division
|
| R&D Expenditures (100 million) | R&D Input Intensity(%) |
|
|
|
|
| Total | 8318.4 | 0.80 |
| Mining | 292.6 | 0.43 |
| Mining and Washing of Coal | 156.6 | 0.48 |
| Extraction of Petroleum and Natural Gas | 80.7 | 0.70 |
| Mining and Processing of Ferrous Metal Ores | 7.7 | 0.08 |
| Mining and Processing of Non-ferrous Ores | 21.8 | 0.35 |
| Mining and Processing of Nonmetal Ores | 7.2 | 0.15 |
| Supporting Activities for Mining | 18.7 | 0.92 |
| Manufacturing | 7959.8 | 0.88 |
| Processing of Food from Agricultural Products | 173.0 | 0.29 |
| Manufacture of Foods | 98.5 | 0.53 |
| Manufacture of Alcohol, Beverage and Refined Tea | 82.7 | 0.54 |
| Manufacture of Tobacco | 22.1 | 0.27 |
| Manufacture of Textile | 158.5 | 0.44 |
| Manufacture of Textile Wearing Apparel and Accessories | 69.3 | 0.36 |
| Manufacture of Leather, Fur, Feather and Related Products and Footwear | 33.9 | 0.27 |
| Processing of Timber, Manufacture of Wood, Bamboo, Rattan, Palm and Straw Products | 27.2 | 0.23 |
| Manufacture of Furniture | 22.5 | 0.34 |
| Manufacture of Paper and Paper Products | 87.8 | 0.68 |
| Printing and Reproduction of Record Media | 30.4 | 0.51 |
| Manufacture of Articles for Culture, Education, Arts and Crafts | 49.6 | 0.38 |
| Processing of Petroleum, Coking and Processing of Nuclear Fuel | 89.3 | 0.22 |
| Manufacture of Raw Chemical Materials and Chemical Products | 660.4 | 0.86 |
| Manufacture of Medicines | 347.7 | 1.70 |
| Manufacture of Chemical Fibers | 66.8 | 0.95 |
| Manufacture of Rubber and Plastic Products | 199.5 | 0.72 |
| Manufacture of Non-metallic Mineral Products | 215.0 | 0.41 |
| Smelting and Pressing of Ferrous Metals | 633.0 | 0.83 |
| Smelting and Pressing of Non-ferrous metals | 301.1 | 0.64 |
| Manufacture of Metal Products | 230.0 | 0.69 |
| Manufacture of General Purpose Machinery | 547.9 | 1.26 |
| Manufacture of Special Purpose Machinery | 512.3 | 1.57 |
| Manufacture of Automobile | 680.2 | 1.14 |
| Manufacture of Railway, Ships, Aerospace and Other Transportation Equipments | 372.1 | 2.27 |
| Manufacture of Electrical Machinery and Equipment | 815.4 | 1.32 |
| Manufacture of Computer, Communication and Other Electronic Equipment | 1252.5 | 1.59 |
| Manufacture of Measuring Instruments and Machinery | 149.3 | 1.97 |
| Other Manufacturing | 14.5 | 0.62 |
| Comprehensive Utilization of Waste | 9.6 | 0.28 |
| Repairing of Metallic Products, Machinery and Equipment | 7.8 | 0.85 |
| Production and Supply of Electricity, Heat Power, Gas and Water | 66.0 | 0.11 |
| Production and Supply of Electricity and Heat Power | 58.4 | 0.10 |
| Production and Supply of Gas | 3.6 | 0.09 |
| Production and Supply of Water | 3.9 | 0.26 |
|
|
|
|
In 2013, there were 561 thousand patent applications accepted from industrial corporate enterprises above designated size, among which 205 thousand were invention patents, an increase of 223.2 percent and 368.7 percent respectively compared with that in 2008; and the share of invention patent was 36.6 percent, 11.4 percentage points higher than that in 2008.
5. High Technology Industry (Manufacturing)
At the end of 2013, there were 26,894 high technology (manufacturing) corporate enterprises above designated size, an increase of 4.2 percent compared with that at the end of 2008, accounting for 7.8 percent of manufacturing corporate enterprises above designated size, an increase of 1.3 percentage points.
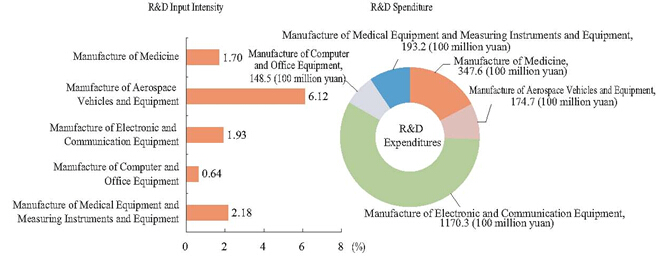
In 2013, the R&D expenditures by high technology (manufacturing) corporate enterprises above designated size was 203.43 billion yuan, an increase of 178.2 percent compared with that in 2008, accounting for 25.6 percent of investment in R&D made by manufacturing corporate enterprises above designated size, an increase of 0.6 percentage point. The R&D input intensity was 1.75 percent, 0.44 percentage point higher than that in 2008 and 0.87 percentage point higher than the average of manufacturing industry above designated size. (Table 2-6).
Table 2-6 R&D Expenditures and Input Intensity of High Technology (Manufacturing) Corporate Enterprises above Designated Size by Division
|
| R&D Expenditures (100 million yuan) | R&D Input Intensity (%) | ||
|
|
|
|
|
|
| High-technology Industry (Manufacturing) | 2034.3 |
| 1.75 |
|
| 1.Manufacture of Medicine | 347.6 |
| 1.70 |
|
| 2.Manufacture of Aerospace Vehicles and Equipment | 174.7 |
| 6.12 |
|
| 3.Manufacture of Electronic and Communication Equipment | 1170.3 |
| 1.93 |
|
| 4.Manufacture of Computer and Office Equipment | 148.5 |
| 0.64 |
|
| 5.Manufacture of Medical Equipment and Measuring Instruments and Equipment | 193.2 |
| 2.18 |
|
|
|
|
|
|
|
Figure 2-3 R&D Expenditures and Input Intensity of High Technology (Manufacturing) Corporate Enterprises above Designated Size by Divison
In 2013, there were 143 thousand patent applications accepted from high technology (manufacturing) corporate enterprises above designated size, among which 74 thousand were invention patents, 194.9 percent and 179 percent higher respectively than that in 2008, accounting for 51.8 percent of all patents accepted, 15.2 percentage points higher than the average of manufacturing industry above designated size.
II. Construction
1. Number of Corporate Enterprises and Persons Employed
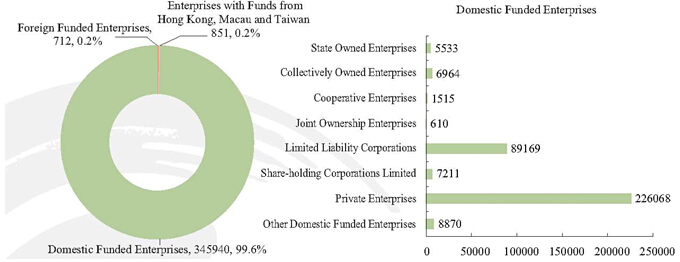
At the end of 2013, there were 347,503 construction corporate enterprises with 53.206 million persons employed, up by 53.2 percent and 36.4 percent respectively than that at the end of 2008.
Among the construction corporate enterprises, 99.6 percent were domestic funded enterprises, 0.2 percent enterprises with funds from Hong Kong, Macau and Taiwan and 0.2 percent foreign funded enterprises. Among domestic funded companies, state owned enterprises took up 1.6 percent of all corporate enterprises, collectively owned enterprises 2 percent and private enterprises 65.1 percent.
In terms of persons employed by construction corporate enterprises, domestic funded enterprises accounted for 99.5 percent, 0.3 percent for enterprises with funds from Hong Kong, Macau and Taiwan and 0.2 percent for foreign funded enterprises. Among domestic funded enterprises, 4.7 percent of the persons employed worked for state owned enterprises, 3.4 percent for collectively owned enterprises and 42.5 percent for private enterprises. (Table 2-7)
Table 2-7 Number of Construction Corporate Enterprises and Persons Employed, by Status of Registration
|
| Corporate Enterprises | Persons Employed (10,000) |
|
|
|
|
| Total | 347503 | 5320.6 |
| Domestic Funded Enterprises | 345940 | 5291.8 |
| State Owned Enterprises | 5533 | 247.4 |
| Collectively Owned Enterprises | 6964 | 181.9 |
| Cooperative Enterprises | 1515 | 17.2 |
| Joint Ownership Enterprises | 610 | 7.8 |
| Limited Liability Corporations | 89169 | 2205.3 |
| Share-holding Corporations Limited | 7211 | 347.7 |
| Private Enterprises | 226068 | 2263.4 |
| Other Domestic Funded Enterprises | 8870 | 21.0 |
| Enterprises with Funds from Hong Kong, Macau and Taiwan | 851 | 17.4 |
| Foreign Funded Enterprises | 712 | 11.4 |
|
|
|
|
Figure 2-4 Number of Construction Corporate Enterprises by Status of Registration
Among construction corporate enterprises, 21.5 percent were house building enterprises, 18.3 percent civil engineering enterprises, 17.6 percent installation enterprises and 42.7 percent decoration and other enterprises.
In terms of persons employed by construction corporate enterprises, house building enterprises took up 67 percent, civil engineering enterprises 17 percent, installation enterprises 6.4 percent, and decoration and other enterprises 9.6 percent. (Table 2-8)
Table 2-8 Number of Construction Corporate Enterprises and Persons Employed, by Branch
|
| Corporate Enterprises (10,000) |
| Persons Employed (10,000) |
|
|
|
|
|
| Total | 34.8 |
| 5320.6 |
| House Building | 7.5 |
| 3565.0 |
| Civil Engineering | 6.3 |
| 907.1 |
| Installation | 6.1 |
| 339.3 |
| Decoration and Others | 14.8 |
| 509.1 |
|
|
|
|
|
2. Total Assets
At the end of 2013, the total amount of assets of construction corporate enterprises reached 16,761.65 billion yuan, an increase of 180.9 percent compared with that at the end of 2008. (Table 2-9)
Table 2-9 Total Assets of Construction Corporate Enterprises by Branch
|
| Total Assets (100 million yuan) |
|
|
|
| Total | 167616.5 |
| House Building | 74343.9 |
| Civil Engineering | 63464.6 |
| Installation | 14865.5 |
| Decoration and Others | 14942.4 |
|
|
|
Notes:
[1] Industrial enterprise above designated size refers to industrial corporate enterprises with annual revenue of 20 million yuan or above from principal activities.
[2] High technology (manufacturing) industry includes manufacture of medicine, manufacture of aerospace vehicle and equipment, electronic and communication equipment, manufacture of computer and office equipment, manufacture of medical equipment and manufacture of measuring instrument and equipment according to the Classification of High Technology Industry (Manufacturing) (2013).
[3] Research and experimental development refers to systematic and innovative activities with the purpose of increasing knowledge and using the knowledge to create new applications in the science and technology field, including fundamental research, applied research and experimental development.
[4] R&D input intensity refers to the ratio of R&D expenditures to the revenue from principal activities.
[5] The errors of the total numbers and some results in the table caused by the rounding-off of decimals are not mechanically adjusted.
(In case of any divergence in the interpretation of this Communiqué, the Chinese version shall prevail.)