Communiqué on Major Data of the Third National Economic Census (No. 1)
Communiqué on Major Data of the
Third National Economic Census
(No. 1)
National Bureau of Statistics of China
Office of the Leading Group of the State Council for the
Third National Economic Census
December 16, 2014
According to the Notice of the State Council on Conducting the Third National Economic Census [No. (2012) 60], China carried out its third national economic census with December 31, 2013 as the reference time and all activities of 2013 should be reported. The economic census covered all legal entities, establishments and self-employed units which were engaged in the secondary and tertiary industries within the territory of China. The census helps China understand the scale and distribution of the secondary and tertiary industries; the current status of industrial organization, structure, technologies and composition of production factors; and the development of the service industry, strategic emerging industry, small and micro enterprises, and high technology industry (manufacturing). The sample checking of the data quality in the 31 regions revealed that the combined error rate was 3.3‰ which has reached the standard set for data quality.
According to the Regulations on National Economic Census, the National Bureau of Statistics of China and the Office of the Leading Group of the State Council for the Third National Economic Census are to release major aggregated data in three communiqués as the following. Other data will be released through different channels with the progress of production and application of the census data.
I. Basic Situation of the Units
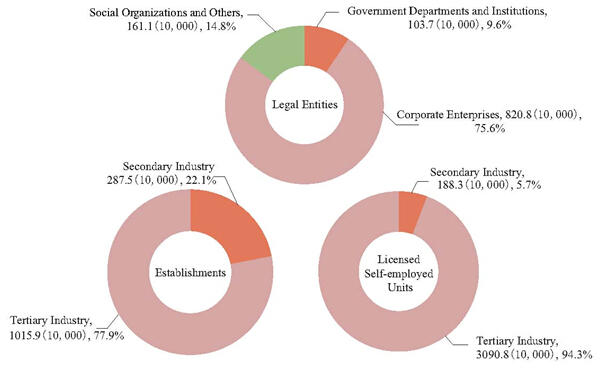
At the end of 2013, there were 10.857 million legal entities in the secondary and tertiary industries, up by 52.9 percent or an increase of 3.758 million compared with that at the end of 2008 when the second national economic census was conducted; 13.035 million establishments, up by 47.1 percent or an increase of 4.171 million; 32.791 million licensed self-employed units, up by 14.1 percent or an increase of 4.054 million. (Table 1-1)
Table 1-1 Number of Units and Licensed Self-employed
|
| Number of Units (10,000) | Proportion (%) |
|
|
|
|
| 1. Legal Entities | 1085.7 | 100.0 |
| Corporate Enterprises | 820.8 | 75.6 |
| Government Departments and Institutions | 103.7 | 9.6 |
| Social Organizations and Others | 161.1 | 14.8 |
| 2. Establishments | 1303.5 | 100.0 |
| Secondary Industry | 287.5 | 22.1 |
| Tertiary Industry | 1015.9 | 77.9 |
| 3. Licensed Self-employed Units | 3279.1 | 100.0 |
| Secondary Industry | 188.3 | 5.7 |
| Tertiary Industry | 3090.8 | 94.3 |
|
|
|
|
Figure 1-1 Number of Units and Licensed Self-employed
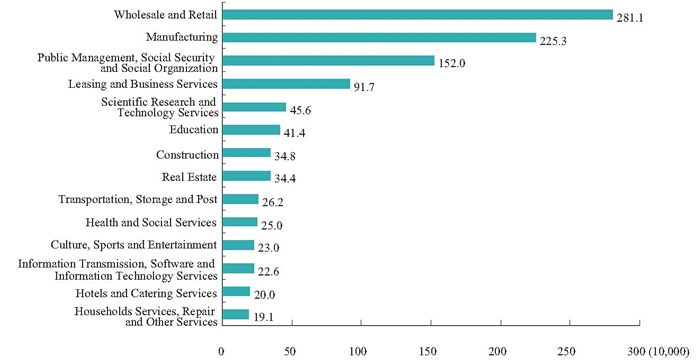
At the end of 2013, the top three sectors of legal entities out of the secondary and tertiary industries were wholesale and retail with 2.811 million entities, taking up 25.9 percent of the total; manufacturing with 2.253 million, taking up 20.7 percent; and public management, social welfare and social organization with 1.52 million entities, taking up 14 percent. Among licensed self-employed units, the top three sectors were wholesale and retail with 16.427 million, taking up 50.1 percent; transportation, storage and post with 8.786 million, taking up 26.8 percent; and hotels and catering services with 2.408 million, taking up 7.3 percent. (Table 1-2)
Table 1-2 Number of Legal Entities and Licensed Self-employed Units by Sector
|
| Legal Entities (10,000) | Licensed Self-employed Units (10,000) |
|
|
|
|
| Total | 1085.7 | 3279.1 |
| Mining | 8.9 | 1.5 |
| Manufacturing | 225.3 | 174.8 |
| Production and Supply of Electricity, Heat Power, Gas and Water | 7.0 | 0.6 |
| Construction | 34.8 | 18.5 |
| Wholesale and Retail | 281.1 | 1642.7 |
| Transportation, Storage and Post | 26.2 | 878.6 |
| Hotels and Catering Services | 20.0 | 240.8 |
| Information Transmission, Software and Information Technology Services | 22.6 | 10.6 |
| Financial Services | 3.0 | - |
| Real Estate | 34.4 | 5.0 |
| Leasing and Business Services | 91.7 | 30.6 |
| Scientific Research and Technology Services | 45.6 | 11.8 |
| Water Conservancy, Environment and Public Utility Administration | 8.5 | 0.3 |
| Households Services, Repair and Other Services | 19.1 | 214.6 |
| Education | 41.4 | 5.8 |
| Health and Social Services | 25.0 | 20.9 |
| Culture, Sports and Entertainment | 23.0 | 17.2 |
| Public Management, Social Security and Social Organization | 152.0 | - |
|
|
|
|
Note: The total number of legal entities in the table above includes 162 thousand legal entities which were engaged in services for agriculture, forestry, animal husbandry and fishery and which were engaged as sidelines in agriculture, forestry, animal husbandry and fishery. The total number of licensed self-employed units includes 50 thousand self-employed units which were engaged in services for agriculture, forestry, animal husbandry and fishery.
Figure 1-2 Number of Legal Entities by Sector
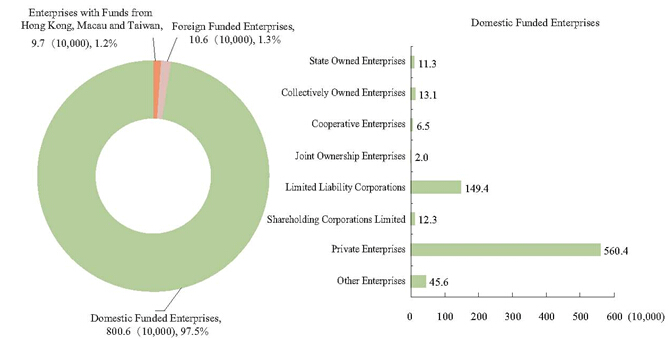
At the end of 2013, there were 8.208 million corporate enterprises in the secondary and tertiary industries, up by 65.5 percent or an increase of 3.249 million compared with that at the end of 2008. Domestic funded enterprises accounted for 97.5 percent, enterprises with funds from Hong Kong, Macau and Taiwan for 1.2 percent and foreign funded enterprises for 1.3 percent. Among the domestic funded enterprises, state owned enterprises took up 1.4 percent and private enterprises 68.3 percent. (Table 1-3)
Table 1-3 Number of Corporate Enterprises by Status of Registration
|
| Corporate Enterprises (10,000) |
|
|
|
| Total | 820.8 |
| Domestic Funded Enterprises | 800.6 |
| State Owned Enterprises | 11.3 |
| Collectively Owned Enterprises | 13.1 |
| Cooperative Enterprises | 6.5 |
| Joint Ownership Enterprises | 2.0 |
| Limited Liability Corporations | 149.4 |
| Shareholding Corporations Limited | 12.3 |
| Private Enterprises | 560.4 |
| Other Enterprises | 45.6 |
| Enterprises with Funds from Hong Kong, Macau and Taiwan | 9.7 |
| Foreign Funded Enterprises | 10.6 |
|
|
|
Figure 1-3 Number of Corporate Enterprises by Status of Registration
II. Persons Employed
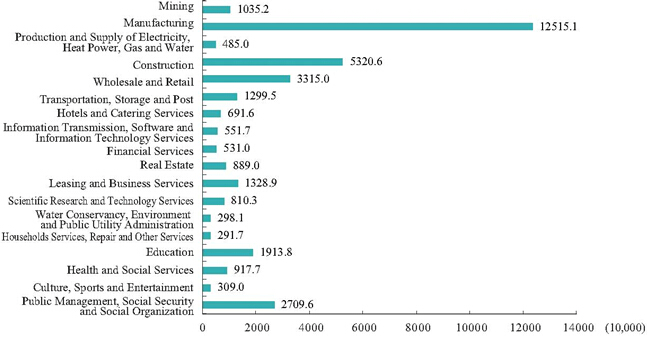
At the end of 2013, there were 356.023 million persons employed by legal entities in the secondary and tertiary industries, up by 30.4 percent or an increase of 82.908 million compared with that at the end of 2008. A total of 90.134 million persons were employed by licensed self-employed units, up by 10 percent or an increase of 8.18 million compared with that at the end of 2008.
The top three sectors in terms of persons employed by legal entities were manufacturing with 125.151 million persons employed, taking up 35.2 percent; construction with 53.206 million, taking up 14.9 percent; and wholesale and retail with 33.15 million, taking up 9.3 percent. The top three sectors in terms of persons employed by licensed self-employed units were wholesale and retail, taking up 46.2 percent with 41.666 million persons employed; transportation, storage and post, taking up 18.6 percent with 16.745 million; hotels and catering services, taking up 11.9 percent with 10.694 million. (Table 1-4)
Table 1-4 Number of Persons Employed by Legal Entities and Licensed Self-employed Units by Sector
|
| Persons Employed by Legal Entities (10,000) | Persons Employed by Licensed Self-employed Units (10,000) |
|
|
|
|
| Total | 35602.3 | 9013.4 |
| Mining | 1035.2 | 11.7 |
| Manufacturing | 12515.1 | 937.6 |
| Production and Supply of Electricity, Heat Power, Gas and Water | 485.0 | 2.5 |
| Construction | 5320.6 | 90.8 |
| Wholesale and Retail | 3315.0 | 4166.6 |
| Transportation, Storage and Post | 1299.5 | 1674.5 |
| Hotels and Catering Services | 691.6 | 1069.4 |
| Information Transmission, Software and Information Technology Services | 551.7 | 26.2 |
| Financial Services | 531.0 | - |
| Real Estate | 889.0 | 14.3 |
| Leasing and Business Services | 1328.9 | 86.6 |
| Scientific Research and Technology Services | 810.3 | 39.1 |
| Water Conservancy, Environment and Public Utility Administration | 298.1 | 1.1 |
| Households Services, Repair and Other Services | 291.7 | 715.2 |
| Education | 1913.8 | 31.7 |
| Health and Social Services | 917.7 | 58.5 |
| Culture, Sports and Entertainment | 309.0 | 73.6 |
| Public Management, Social Security and Social Organization | 2709.6 | - |
|
|
|
|
Note: The total number of persons employed by legal entities in the table above includes 3.898 million persons at legal entities which were engaged in services for agriculture, forestry, animal husbandry and fishery and which were engaged as sidelines in agriculture, forestry, animal husbandry and fishery. The total number of persons employed by licensed self-employed units includes 138 thousand persons at self-employed units which were engaged in services for agriculture, forestry, animal husbandry and fishery.
Figure 1-4 Number of Persons Employed by Legal Entities by Sector
III. Total Assets of Enterprises
At the end of 2013, the total amount of assets of enterprises engaged in the secondary and tertiary industries was 466.8 trillion yuan. The total amount of assets of enterprises engaged in the secondary industry accounted for 26.1 percent and that in the tertiary industry 73.9 percent.
IV. Small and Micro Enterprises
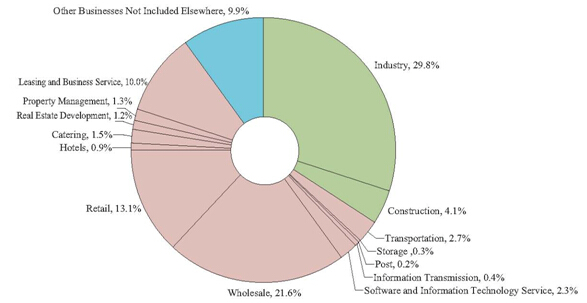
At the end of 2013, there were 7.85 million small and micro enterprises in the secondary and tertiary industries, accounting for 95.6 percent of the corporate enterprises. The top three sectors of such enterprises were industry, taking up 28.5 percent with 2.342 million enterprises; wholesale, taking up 20.7 percent with 1.698 million enterprises; retail, taking up 12.6 percent with 1.031 million enterprises.
A total of 147.304 million persons were employed by small and micro enterprises, accounting for 50.4 percent of the persons employed by all corporate enterprises. The top three sectors were industry, taking up 25.4 percent of the persons employed of all corporate enterprises with 74.036 million persons; construction, taking up 5.7 percent with 16.754 million; and wholesale, taking up 5 percent with 14.578 million.
The total amount of assets of small and micro enterprises was 138.4 trillion yuan, accounting for 29.6 percent of the total assets of all corporate enterprises. The top three sectors were industry, taking up 8.7 percent of the total assets of all corporate enterprises with 40.8 trillion yuan; leasing and business services, taking up 7.9 percent with 36.8 trillion yuan; and real estate development, taking up 4 percent with 18.7 trillion yuan. (Table 1-5)
Table 1-5 Small and Micro Enterprises, Persons Employed and Total Assets by Sector
|
| Corporate Enterprises (10,000) | Persons Employed (10,000) | Total Assets (Trillion Yuan) |
|
|
|
|
|
| Total | 785.0 | 14730.4 | 138.4 |
| Industry | 234.2 | 7403.6 | 40.8 |
| Construction | 32.2 | 1675.4 | 5.0 |
| Transportation | 21.1 | 462.8 | 5.2 |
| Storage | 2.4 | 42.4 | 1.1 |
| Post | 1.2 | 22.8 | 0.0 |
| Information Transmission | 3.4 | 40.5 | 1.4 |
| Software and Information Technology Service | 17.9 | 174.5 | 1.6 |
| Wholesale | 169.8 | 1457.8 | 12.7 |
| Retail | 103.1 | 766.2 | 3.2 |
| Hotels | 6.8 | 168.2 | 0.6 |
| Catering | 12.1 | 256.8 | 0.4 |
| Real Estate Development | 9.6 | 182.1 | 18.7 |
| Property Management | 10.2 | 277.9 | 1.2 |
| Leasing and Business Service | 78.4 | 945.3 | 36.8 |
| Other Businesses Not Included Elsewhere | 77.7 | 782.1 | 9.3 |
|
|
|
|
|
Note: The total number of small and micro enterprises in the table above includes 48 thousand small and micro enterprises which were engaged in services for agriculture, forestry, animal husbandry and fishery and which were engaged as sidelines in agriculture, forestry, animal husbandry and fishery, with 721 thousand persons employed and a total amount of assets of 0.3 trillion yuan.
Figure1-5 Small and Micro Enterprises by Sector
V. Strategic Emerging Enterprises
At the end of 2013, there were 166 thousand strategic emerging enterprises in the secondary and tertiary industries, accounting for 2 percent of all corporate enterprises, among which 71 thousand were energy conservation and environmental protection enterprises, taking up 0.9 percent, and 47 thousand were new material enterprises, taking up 0.6 percent.
A total of 23.623 million persons were employed by enterprises with activities in the strategic emerging industry, accounting for 8.1 percent of those in all corporate enterprises, among which energy conservation and environmental protection enterprises had 10.039 million, accounting for 3.4 percent of the persons employed of all corporate enterprises and new material enterprises 7.079 million, accounting for 2.4 percent.
VI. Changes in Main Economic Structure
At the end of 2013, corporate enterprises accounted for 75.6 percent of the legal entities of the secondary and tertiary industries, 5.7 percentage points higher than that at the end of 2008; government departments and institutions accounted for 9.6 percent, 3.9 percentage points lower; and social organizations and others 14.8 percent, 1.8 percentage points lower. The number of persons employed by corporate enterprises accounted for 82 percent of those at all legal entities, 1.3 percentage points higher; government departments and institutions accounted for 12.9 percent, 2.4 percentage points lower; and social organizations and others 5.1 percent, 1.1 percentage points higher.
The legal entities in the secondary industry accounted for 25.3 percent, 5.7 percentage points lower than that at the end 2008; and those in the tertiary industry accounted for 74.7 percent, 5.7 percentage points higher. Among all persons employed by legal entities in the secondary and tertiary industries, those in the secondary industry accounted for 54.1 percent, 3.5 percentage points lower than that at the end of 2008; and those in the tertiary industry accounted for 45.9 percent, 3.5 percentage points higher.
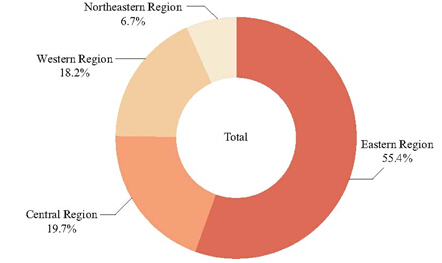
Among the legal entities, 55.4 percent of the entities were in the eastern region, 2.9 percentage points higher than that at the end of 2008; 19.7 percent in the central region, 0.2 percentage point lower; 18.2 percent in western region, 1 percentage point lower; and 6.7 percent in the northeastern region, 1.7 percentage points lower. The persons employed by legal entities in the eastern region accounted for 54 percent, 0.5 percentage point lower than that at the end of 2008; 20.9 percent in the central region, 0.7 percentage point higher; 18.4 percent in the western region, 0.9 percentage point higher; and 6.7 percent in the northeastern region, 1.2 percentage points lower. (Table 1-6)
Table 1-6 Legal Entities and Persons Employed in the Eastern, Central, Western and Northeastern Regions
|
| Legal Entities | Employed Persons | ||
| Number (10,000) | Proportion(%) | Number (10,000) | Proportion(%) | |
|
|
|
|
|
|
| Total | 1085.7 | 100.0 | 35602.3 | 100.0 |
| Eastern Region | 601.9 | 55.4 | 19224.5 | 54.0 |
| Central Region | 214.1 | 19.7 | 7428.8 | 20.9 |
| Western Region | 197.4 | 18.2 | 6567.2 | 18.4 |
| Northeastern Region | 72.2 | 6.7 | 2381.8 | 6.7 |
|
|
|
|
|
|
Figure 1-6 Legal Entities in the Eastern, Central, Western and Northeastern Regions
The licensed self-employed units of the secondary industry took up 5.7 percent, 3.1 percentage points lower than that at the end of 2008; and the tertiary industry took up 94.3 percent, 3.1 percentage points higher. For the persons employed by the licensed self-employed units, 11.4 percent worked in the secondary industry, 8.2 percentage points lower than that at the end of 2008; and 88.6 percent in the tertiary industry, 8.2 percentage points higher.
In terms of licensed self-employed units, 40 percent were in the eastern region, 0.5 percentage point higher than that at the end of 2008; 23.3 percent in the central region, 1.4 percentage points lower; 27.9 percent in the western region, 1.9 percentage points higher; and 8.8 percent in the northeastern region, 1.1 percentage points lower. In terms of persons employed by the licensed self-employed units, the eastern region accounted for 43.6 percent, 0.9 percentage point lower than that at the end of 2008; central region 23.3 percent, 0.2 percentage point lower; western region 25.6 percent, 3 percentage points higher; and northeastern region 7.6 percent, 1.9 percentage points lower. (Table 1-7)
Table 1-7 Licensed Self-employed Units and Persons Employed in the Eastern, Central, Western and Northeastern Regions
|
| Self-employed Units | Persons Employed | ||
| Number (10,000) | Proportion(%) | Number (10,000) | Proportion(%) | |
|
|
|
|
|
|
| Total | 3279.1 | 100.0 | 9013.4 | 100.0 |
| Eastern Region | 1311.4 | 40.0 | 3926.1 | 43.6 |
| Central Region | 762.5 | 23.3 | 2095.7 | 23.3 |
| Western Region | 915.4 | 27.9 | 2305.6 | 25.6 |
| Northeastern Region | 289.7 | 8.8 | 686.0 | 7.6 |
|
|
|
|
|
|
Figure 1-7 Licensed Self-employed Units in the Eastern, Central, Western and Northeastern Regions

Notes:
[1] Classification of industries
Primary industry refers to agriculture, forestry, animal husbandry and fishery (excluding services to the above businesses).
Secondary industry refers to mining (excluding mining supporting activities), manufacturing (excluding repair of metal products, machinery and equipments), production and supply of electricity, heat power, gas and water and construction.
Tertiary industry, or service industry, refers to those activities other than in the primary and secondary industries. It includes wholesale and retail, transportation, storage and post, hotels and catering, information transmission, software and information technology services, financial services, real estate, leasing and business services, scientific research and technology, water conservancy, environment and public utility administration, household service, repair and other services, education, health care and social work, culture, education, entertainment, public management, social welfare and social organization, international organization, services to agriculture, forestry, animal husbandry and fishery, mining supporting activities and repair of metal products, machinery and equipments.
[2] Classification of units
Legal entities refer to economic units meeting the following criteria:
(1) established by law with its own name, internal organization and locations, and capable of fulfilling independently its civil obligations;
(2) with independent ownership of (or authorized with rights to use) assets and bearing liabilities, with authority to sign contracts with other units; and
(3) capable of compiling statements including the assets and liability tables or capable of compiling statements according to requirements.
Legal entities include corporate enterprises, institutions, government departments, social organizations and their member organizations and others legal persons.
Establishments refer to units meeting the following criteria:
(1) engaged or mainly engaged in one economic or social activity at a fixed location;
(2) organizing its production or business operation independently; and
(3) with accounting data on its revenue and expenses.
Licensed self-employed units refers to economic units except rural households where the means of production is owned by individuals, individual work constitutes the basic form of operation, and the results of operation are owned by or at the disposal of the individuals concerned. They are industrial and commercial self-employed units registered at the business registration offices at all levels with operation licenses issued by such offices according to the General Rule of Civil Law and the Provisional Regulations on Management of Industrial and Commercial Self-Employed Units in Urban and Rural Areas.
[3] Small and micro enterprises
Small and micro enterprises are defined according to the Notice on the Publication of Classification Standards of Medium and Small Enterprises [Ministry of Industry and Information (2011) 300] by Ministry of Industry and Information, National Bureau of Statistics, National Development and Reform Commission and Ministry of Finance and according to the Regulations on the Statistical Classification of Large, Medium, Small and Micro Enterprises by National Bureau of Statistics. The Classification makes groupings of enterprises into large, medium, small and micro enterprises based on indicators or alternative indicators, including number of persons employed, operating income and total assets, by different sections, divisions, groups and classes.
[4] Strategic Emerging Industry
The strategic emerging industry was defined according to the Decision by the State Council to Foster and Develop Strategic Emerging Industries [State Council (2010) 32] and the Classification of Strategic Emerging Industry (2012) (Trial) by the National Bureau of Statistics. Classified by economic activities, the classification of strategic emerging industry refers to the further grouping of relevant activities in strategic emerging industries based on the Standard Industrial Classification of National Economy.
[5] Division of the eastern, central, western and northeastern regions:
The eastern region includes: Beijing, Tianjin, Hebei, Shanghai, Jiangsu, Zhejiang, Fujian, Shandong, Guangzhou and Hainan.
The central region includes: Shanxi, Anhui, Jiangxi, Henan, Hubei and Hunan.
The western region includes: Inner Mongolia, Guangxi, Chongqing, Sichuan, Guizhou, Yunnan, Tibet, Shaanxi, Gansu, Qinghai, Ningxia and Xinjiang.
The northeastern region includes: Liaoning, Jilin and Heilongjiang.
[6] The errors of the total numbers and some results in the table caused by the rounding-off of decimals are not mechanically adjusted.
(In case of any divergence in the interpretation of this Communiqué, the Chinese version shall prevail.)