Statistical Communiqué of the People's Republic of China on the 2013 National Economic and Social Development
Statistical Communiqué of the People's Republic of China on
the 2013 National Economic and Social Development [1]
National Bureau of Statistics of China
February 24, 2014
In 2013, faced with the complicated domestic and international situation, the CPC Central Committee and the State Council lead the people of all nationalities of China to thoroughly implement the spirit of the 18th Party Congress, uphold the general tone of “moving forward while maintaining stability”, adhere to the guideline of “the macro policy should be stable, micro policy be flexible and social policy support the bottom line” while maintaining steady growth, adjusting economic structure and forging ahead with reform, and actively make explorations and innovations of macro-control means, as a result, the national economic and social development realized stabilized and accelerated development and achieved a good start.
By the end of 2013, the total population in the mainland reached 1,360.72 million, an increase of 6.68 million over that at the end of 2012. Of this total, urban permanent residents numbered 731.11million, accounting for 53.73 percent, or 1.16 percentage points higher than that at the end of the previous year. The year 2013 saw 16.40 million births, a crude birth rate of 12.08 per thousand, and 9.72 million deaths, or a crude death rate of 7.16 per thousand. The natural growth rate was 4.92 per thousand. The number of population that are separated from their household registration[2] reached 289 million, of which 245 million were floating population[3].
Table 1: Population and Its Composition at the end of 2013
Unit: 10,000 persons
| Item | Population (Year-end figure) | Proportion (%) |
| National Total | 136,072 | 100.0 |
| Of which: Urban | 73,111 | 53.73 |
| Rural | 62,961 | 46.27 |
| Of which: Male | 69,728 | 51.2 |
| Female | 66,344 | 48.8 |
| Of which: Aged 0-15[4] | 23,875 | 17.5 |
| Aged 16-59 | 91,954 | 67.6 |
| Aged 60 and over | 20,243 | 14.9 |
| Of which: Aged 65 and over | 13,161 | 9.7 |
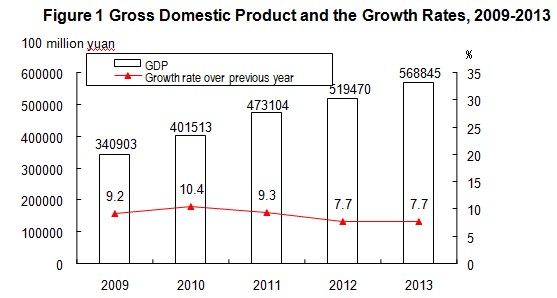
The national economy kept stable and comparatively fast growth in 2013. The gross domestic product (GDP)[5]of the year was 56,884.5 billion yuan, up by 7.7 percent over the previous year. Of this total, the value added of the primary industry was 5,695.7 billion yuan, up by 4.0 percent, that of the secondary industry was 24,968.4 billion yuan, up by 7.8 percent and the tertiary industry was 26,220.4 billion yuan, up by 8.3 percent. The value added of the primary industry accounted for 10.0 percent of the GDP, that of the secondary industry accounted for 43.9 percent, and that of the tertiary industry accounted for 46.1 percent. For the first time, the share of the value added of the tertiary industry surpassed that of the second industry.
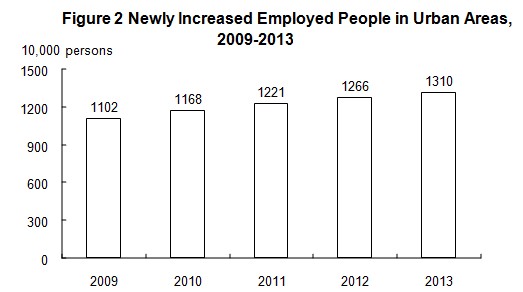
The employment continued to grow. At the end of 2013, the number of employed people in China was 769.77 million, and that in urban areas was 382.40 million. The newly increased employed people in urban areas numbered 13.10 million. The urban unemployment rate registered was 4.05 percent at the year end, slightly lower than last year’s 4.09 percent. The total number of migrant workers[6] in 2013 was 268.94 million, up by 2.4 percent over that of 2012. The number of migrant workers who left hometowns and worked in other places was 166.10 million, increased by 1.7 percent, and those who worked in their own localities reached 102.84 million, up by 3.6 percent.
The labor productivity increased steadily. The ratio between GDP and the total employment was 66,199 yuan per person (at 2010 constant prices), an increase of 7.3 percent.

The consumer prices was basically stable. The consumer prices in 2013 went up by 2.6 percent over the previous year. Of this total, the prices for food went up by 4.7 percent. The prices for investment in fixed assets increased by 0.3 percent. The producer prices and the purchasing prices for manufactured goods were down by 1.9 percent and 2.0 percent respectively. The producer prices for farm products[7] were up by 3.2 percent.
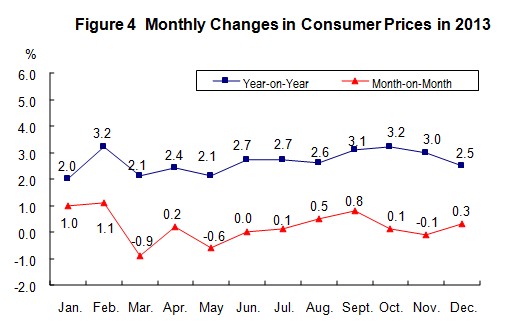
Table 2: General Level of Consumer Prices in 2013
Unit: %
| Item | National Average |
| |
| Urban | Rural | ||
| General level of consumer prices | 2.6 | 2.6 | 2.8 |
| Food | 4.7 | 4.6 | 4.9 |
| Tobacco, liquor and articles | 0.3 | 0.1 | 0.8 |
| Clothing | 2.3 | 2.2 | 2.5 |
| Household appliances and maintaining services | 1.5 | 1.5 | 1.3 |
| Medical, health and personal articles | 1.3 | 1.2 | 1.8 |
| Transportation and telecommunications | -0.4 | -0.5 | 0.1 |
| Recreation, education, culture articles and services | 1.8 | 1.7 | 1.8 |
| Housing | 2.8 | 3.0 | 2.3 |
A number of 65 out of 70 large and medium-sized cities experienced rises of monthly sales prices (month-on-month) for new commercial residential buildings at the end of the 2013.


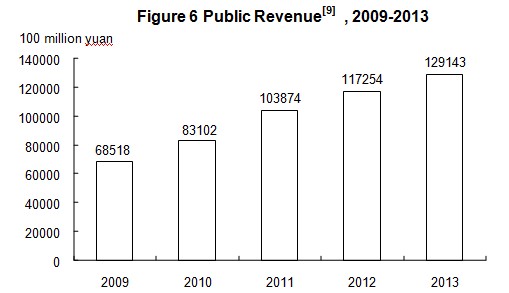
The fiscal revenue grew steadily in 2013. The total public revenue[8] reached 12,914.3 billion yuan, up by 10.1 percent or an increase of 1,188.9 billion yuan over that in the previous year. Of this total, the taxes collected in the whole year reached 11,049.7 billion yuan, up by 9.8 percent or an increase of 988.3 billion yuan over 2012.
The foreign exchange reserve continued to grow. At the end of 2013, China’s foreign exchange reserves reached 3,821.3 billion US dollars, an increase of 509.7 billion US dollars as compared with that at the end of the pervious year. At the end of the year, the exchange rate was 6.0969 RMB to 1 USD, an appreciation by 3.1 percent over that at the end of 2012.

II. Agriculture
In 2013, the sown area of grain was 111.95 million hectares, an increase of 750 thousand hectares compared with that in the previous year; the sown area of cotton was 4.35 million hectares, a decrease of 340 thousand hectares; the sown area of oil-bearing crops was 14.08 million hectares, an increase of 150 thousand hectares; the sown area of sugar crops was 1.99 million hectares, a decrease of 40 thousand hectares.
The year 2013 witnessed another harvest of grain. The total output of grain in 2013 was 601.94 million tons, an increase of 12.36 million tons or up by 2.1 percent over the previous year. Of this total, the output of summer crops was 131.89 million tons, increased by 1.5 percent, and that of the early rice was 34.07 million tons, increased by 2.4 percent over the previous year. The output of autumn grain was 435.97 million tons, an increase of 2.3 percent. Among the main grain crops, the output of rice was 203.29 million tons, down by 0.5 percent; that of wheat was 121.72 million tons, up by 0.6 percent; and that of corn was 217.73 million tons, a rise of 5.9 percent.

In 2013, the output of cotton was 6.31 million tons, a decrease of 7.7 percent over the previous year, that of oil-bearing crops was 35.31 million tons, up by 2.8 percent and that of sugar crops was 137.59 million tons, an increase of 2.0 percent, and that of tea was 1.93 million tons, up by 7.9 percent.
The total output of meat for the year reached 85.36 million tons, up by 1.8 percent over the previous year. Of this total, the output of pork was 54.93 million tons, up by 2.8 percent; that of beef was 6.73 million tons, increased by 1.7 percent; and that of mutton was 4.08 million tons, an increase of 1.8 percent, and that of poultry was 17.98 million tons, a decrease of 1.3 percent. At the end of the year, 474.11 million pigs were registered in the total stocks, down by 0.4 percent, and 715.57 million pigs were slaughtered, up by 2.5 percent. The total output of eggs was 28.76 million tons, up by 0.5 percent. The production of milk was 35.31 million tons, down by 5.7 percent.
The total output of aquatic products was 61.72 million tons, up by 4.5 percent. Of this total, the output of cultured aquatic products was 45.47 million tons, up by 6.0 percent; and that of fished aquatic products was 16.25 million tons, up by 3.5 percent over the previous year.
The total production of timber for the year 2013 reached 83.67 million cubic meters, a year-on-year increase of 2.3 percent.
Over 1.29 million hectares of farmland was increased with effective irrigation systems and another additional 2.11 million hectares of farmland was covered by water-saving irrigation systems.
III. Industry and Construction
The industrial production grew steadily. In 2013, the total value added of the industrial sector was 21,068.9 billion yuan, up by 7.6 percent over the previous year. The value added of industrial enterprises above the designated size increased by 9.7 percent. Among the industrial enterprises above the designated size, in terms of ownership, the value added of the state-owned and state-holding enterprises grew by 6.9 percent, that of the collective enterprises went up by 4.3 percent, that of the share-holding enterprises increased by 11.0 percent, that of the enterprises by foreign investors and investors from Hong Kong, Macao and Taiwan increased by 8.3 percent and that of private enterprises grew by 12.4 percent. In terms of the sectors, the value added of the mining[10] industry grew by 6.4 percent, that of manufacturing by 10.5 percent and that of the production and supply of electric power, heat power, gas and water by 6.8 percent.

In 2013, among the industrial enterprises above designated size, the growth of value added for processing of food from agricultural products was 9.4 percent over the previous year; for textile industry was 8.7 percent; for manufacture of general machinery 9.2 percent; for manufacture of special purpose machinery 8.5 percent; for manufacture of automobiles 14.9 percent; for manufacture of communication equipment, computers and other electronic equipment 11.3 percent and for manufacture of electrical machinery and equipment 10.9 percent. The growth of the value added for the major six high energy consuming industries[11] was 10.1 percent, of which the manufacture of non-metallic mineral products was 11.5 percent, manufacture of raw chemical materials and chemical products 12.1 percent, smelting and pressing of non-ferrous metals 14.6 percent, smelting and pressing of ferrous metals 9.9 percent, production and supply of electric power and heat power 6.2 percent and processing of petroleum, coking, processing of nuclear fuel 6.1 percent. The value added growth for the high-tech industry was 11.8 percent over the previous year.
Table 3: Output of Major Industrial Products and the Growth Rates in 2013
| Product | Unit | Output | Increase over 2012 (%) |
| Yarn | 10000 tons | 3,200.0 | 7.2 |
| Cloth | 100 million meters | 882.7 | 4.0 |
| Chemical fibers | 10000 tons | 4,121.9 | 7.4 |
| Sugar (final product) | 10000 tons | 1,589.7 | 12.8 |
| Cigarettes | 100 million | 25,604.0 | 1.8 |
| Color TV sets | 10000 | 12,776.1 | -0.4 |
| LCD TV sets | 10000 | 12,290.3 | 4.5 |
| Household refrigerators | 10000 | 9,261.0 | 9.9 |
| Room air conditioners | 10000 | 13,057.2 | 5.3 |
| Total primary energy production | 100 million tons of standard coal equivalent | 34.0 | 2.4 |
| Coal | 100 million tons | 36.8 | 0.8 |
| Crude oil | 100 million tons | 2.09 | 1.8 |
| Natural gas[12] | 100 million cubic meters | 1,170.5 | 9.4 |
| Electricity | 100 million kilowatt-hours | 53,975.9 | 7.5 |
| Thermal-power | 100 million kilowatt-hours | 42,358.7 | 7.0 |
| Hydro-power | 100 million kilowatt-hours | 9,116.4 | 5.6 |
| Nuclear-power | 100 million kilowatt-hours | 1,106.3 | 13.6 |
| Crude steel | 10000 tons | 77,904.1 | 7.6 |
| Rolled steel[13] | 10000 tons | 106,762.2 | 11.7 |
| Ten kinds of nonferrous metals | 10000 tons | 4,054.9 | 9.7 |
| Refined copper (copper) | 10000 tons | 649.0 | 12.7 |
| Aluminum electrolyze | 10000 tons | 2,205.9 | 9.2 |
| Aluminum oxide | 10000 tons | 4,437.2 | 17.7 |
| Cement | 100 million tons | 24.2 | 9.3 |
| Sulfuric acid | 10000 tons | 8,122.6 | 3.1 |
| Soda ash | 10000 tons | 2,434.9 | 1.6 |
| Caustic soda | 10000 tons | 2,859.0 | 6.0 |
| Ethylene | 10000 tons | 1,622.6 | 9.1 |
| Chemical fertilizers (100 percent equivalent) | 10000 tons | 7,037.0 | 3.0 |
| Power-generating equipment | 10000 kilowatts | 12,572.8 | -3.3 |
| Motor vehicles | 10000 | 2,211.7 | 14.7 |
| Cars | 10000 | 1,210.4 | 12.4 |
| Large & medium tractors | 10000 | 58.7 | 11.4 |
| Integrated circuits | 100 million pieces | 866.5 | 11.2 |
| Program-controlled switchboards | 10000 lines | 3,115.7 | 10.1 |
| Mobile telephones | 10000 | 145,561.0 | 23.2 |
| Micro-computers | 10000 | 33,661.0 | 5.8 |
By the end of 2013, the installed power generation capacity was 1,247.38 million kilowatts, up by 9.3 percent over that of the previous year. The installed thermal power generation capacity was 862.38 million kilowatts, up by 5.7 percent; the installed hydropower generation capacity was 280.02 million kilowatts, up by 12.3 percent; and the installed nuclear power generation capacity was 14.61 million kilowatts, up by 16.2 percent. The installed grid-connected wind power generation capacity was 75.48 million kilowatts, up by 24.5 percent and the installed grid-connected solar power generation capacity was 14.79 million kilowatts, an increase of 3.4 times.
The profits made by the industrial enterprises above the designated size in 2013 were 6,283.1 billion yuan, an increase of 12.2 percent over the previous year. Of this total, the profits of the state-owned and state-holding enterprises were 1,519.4 billion yuan, up by 6.4 percent; that of the collective enterprises were 82.5 billion yuan, up by 2.1 percent; that of the share-holding enterprises 3,728.5 billion yuan, up by 11.0 percent; that of the enterprises by foreign investors and investors from Hong Kong, Macao and Taiwan 1,459.9 billion yuan, up by 15.5 percent; and that of private enterprises were 2,087.6 billion yuan, a rise of 14.8 percent.
In 2013, the value added of construction enterprises in China was 3,899.5 billion yuan, up by 9.5 percent over the previous year. The profits made by construction enterprises qualified for general contracts and specialized contracts reached 557.5 billion yuan, up by 16.7 percent, of which the profits made by the state-owned and state-holding enterprises were 136.3 billion yuan, up by 20.1 percent.

IV. Investment in Fixed Assets
The investment in fixed assets grew fast. The completed investment in fixed assets of the country in 2013 was 44,707.4 billion yuan, up by 19.3 percent over the previous year. The real growth was 18.9 percent after deducting the price factors. Of the total investment, the investment in fixed assets (excluding rural households) was 43,652.8 billon yuan, up by 19.6 percent; and the investment by rural households reached 1,054.7 billion yuan, up by 7.2 percent. The investment in eastern areas[14] was 17,909.2 billion yuan, up by 17.9 percent over the previous year, in central areas was 10,589.4 billion yuan, a growth of 22.2 percent, in western areas 10,922.8 billion yuan, a growth of 22.8 percent, and in northeastern areas 4,736.7 billion yuan, up by 18.4 percent.
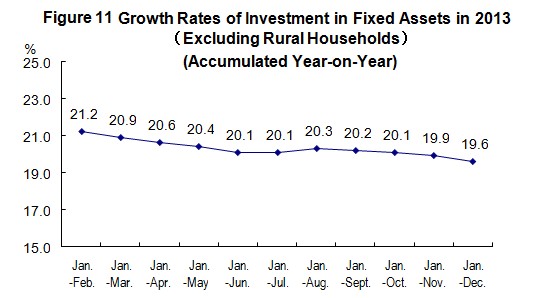
Table 4: Fixed Assets Investment (Excluding Rural Households) and
Its Growth by Sector in 2013
Unit: 100 million yuan
| Sector | Investment | Increase over 2012 (%) |
| Total | 436,528 | 19.6 |
| Agriculture, Forestry, Animal Husbandry and Fishing | 11,611 | 32.4 |
| Mining | 14,750 | 10.9 |
| Manufacturing | 147,370 | 18.5 |
| Production and Supply of Electricity, Heat, Gas and Water | 19,744 | 18.4 |
| Construction | 3,737 | 1.4 |
| Wholesale and Retail Trade | 12,695 | 30.0 |
| Transport, Storage and Post | 36,194 | 17.2 |
| Lodging and Catering Services | 6,001 | 17.5 |
| Information Transmission, Computer Services and Software | 3,216 | 19.5 |
| Banking | 1,250 | 35.3 |
| Real Estate[15] | 111,424 | 20.3 |
| Leasing and Business Services | 5,922 | 26.1 |
| Scientific Research and Technical Service | 3,149 | 27.2 |
| Water Conservancy, Environment and Public Facilities Management | 37,598 | 26.9 |
| Services to Households, maintenance and Other Services | 2,037 | 20.8 |
| Education | 5,486 | 19.1 |
| Health and Social Work | 3,184 | 21.7 |
| Culture, Sports and Entertainment | 5,251 | 23.0 |
| Public Management, Social Security and Social Organization | 5,908 | -2.3 |
In the investment in fixed assets (excluding rural households), the investment in the primary industry[16] was 924.1 billion yuan, up by 32.5 percent; that in the secondary industry was 18,480.4 billion yuan, up by 17.4 percent; and that in the tertiary industry was 24,248.2 billion yuan, up by 21.0 percent.
Table 5: Newly Increased Production Capacity through Fixed Assets Investment in 2013
| Item | Unit | Volume |
| Newly increased power transformer equipment with a capacity of over 220 kilovolts | 10000 kilovolt-amperes | 19,631 |
| New railways put into operation | Kilometer | 5,586 |
| High-speed railways[17] | Kilometer | 1,672 |
| Double-track railways put into operation | Kilometer | 4,180 |
| Electrified railways put into operation | Kilometer | 4,810 |
| New highways | Kilometer | 70,274 |
| Expressways | Kilometer | 8,260 |
| New cargo-handling capacity of berths for over 10000-tonnage ships | 10000 tons | 33,119 |
| New lines of optical-fiber cables | 10000 km | 266 |
In 2013, the investment in real estate development was 8,601.3 billion yuan, up by 19.8 percent. Of this total, the investment in residential buildings reached 5,895.1 billion yuan, an increase of 19.4 percent, that in office buildings was 465.2 billion yuan, up by 38.2 percent, and that in buildings for commercial business was 1,194.5 billion yuan, up by 28.3 percent.
In 2013, the newly started construction of affordable housing projects in urban areas amounted to 6.66 million units (households), and the affordable housing projects in urban areas basically completed were 5.44 million units.
Table 6: Main Indicators for Real Estate Development and Sales and Its Growth in 2013
| Item | Unit | Volume | Increase over 2012 (%) |
| Value of Investment | 100 million yuan | 86,013 | 19.8 |
| Residential buildings | 100 million yuan | 58,951 | 19.4 |
| 90 square meters and below | 100 million yuan | 19,446 | 15.8 |
| Floor space of houses under construction | 10000 square meters | 665,572 | 16.1 |
| Residential buildings | 10000 square meters | 486,347 | 13.4 |
| Floor space of houses newly started | 10000 square meters | 201,208 | 13.5 |
| Residential buildings | 10000 square meters | 145,845 | 11.6 |
| Floor space of houses completed | 10000 square meters | 101,435 | 2.0 |
| Residential buildings | 10000 square meters | 78,741 | -0.4 |
| Sales of commercial buildings | 10000 square meters | 130,551 | 17.3 |
| Residential buildings | 10000 square meters | 115,723 | 17.5 |
| Sources of capital this year | 100 million yuan | 122,122 | 26.5 |
| Domestic loans | 100 million yuan | 19,673 | 33.1 |
| Individual mortgage | 100 million yuan | 14,033 | 33.3 |
V. Domestic Trade
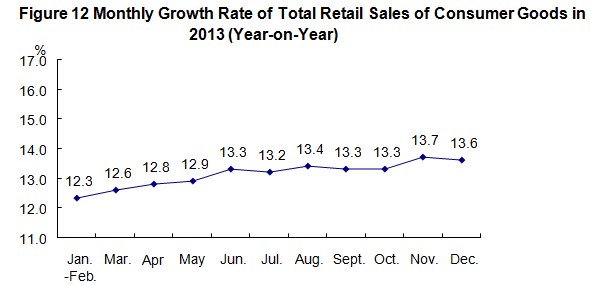
The domestic trade sustained steady and fast growth. In 2013, the total retail sales of consumer goods reached 23,781.0 billion yuan, a growth of 13.1 percent over the previous year, or a real growth of 11.5 percent after deducting price factors. An analysis on different areas showed that the retail sales of consumer goods in urban areas stood at 20,585.8 billion yuan, up by 12.9 percent, and that in rural areas reached 3,195.2 billion yuan, up by 14.6 percent. Grouped by consumption patterns, the income of retail sales of commodities was 21,224.1 billion yuan, up by 13.6 percent, and that of catering industry was 2,556.9 billion yuan, up by 9.0 percent.
Of the total retail sales of commodities by enterprises above designated size, the year-on-year growth of sales for grain, oil, food, beverage, tobacco and liquor was 13.9 percent, that for clothes, shoes, hats and textiles 11.6 percent, for cosmetics 13.3 percent, for gold, silver and jewelry 25.8 percent, daily necessities 14.1 percent, household appliances and audio-video equipments 14.5 percent, for traditional Chinese and western medicines 17.7 percent, for cultural and office appliances 11.8 percent, for furniture 21.0 percent, for telecommunication equipments 20.4 percent, for petroleum and petroleum products 9.9 percent, for motor vehicles 10.4 percent and for building and decoration materials 22.1 percent.
VI. Foreign Economic Relations
The imports and exports was stable and on the rise. The total value of imports and exports of goods in 2013 reached 25,826.7 billion yuan, or 4,160.0 billion US dollars, up by 7.6 percent over the previous year. Of this total, the value of goods exported was 13,717.0 billion yuan, or 2,209.6 billion US dollars, increased by 7.9 percent, and the value of goods imported was 12,109.7 billion yuan, or 1,950.4 billion US dollars, up by 7.3 percent. The balance of imports and exports (exports minus imports) was 1,607.2 billion yuan, an increase of 151.4 billion yuan over the previous year or 259.2 billion US dollars, an increase of 28.9 billion US dollars.

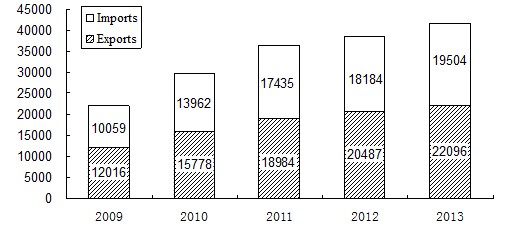
Table 7: Total Value of Import and Export of Goods and the Growth Rates
in 2013
Unit: 100 million USD
| Item | Value | Increase over 2012 (%) |
| Total import and export of goods | 41,600 | 7.6 |
| Exports | 22,096 | 7.9 |
| Of which: General trade | 10,875 | 10.1 |
| Processing trade | 8,605 | -0.3 |
| Of which: Mechanical and electronic products | 12,652 | 7.3 |
| High & new-tech products | 6,603 | 9.8 |
| Imports | 19,504 | 7.3 |
| Of which: General trade | 11,099 | 8.6 |
| Processing trade | 4,970 | 3.3 |
| Of which: Mechanical and electronic products | 8,400 | 7.3 |
| High & new-tech products | 5,582 | 10.1 |
| Trade surplus (exports minus imports) | 2,592 | — |
Table 8: Main Export Commodities in Volume and Value and the Growth Rates in 2013
| Item | Unit |
Volume
| Increase over 2012(%) | Value (100 million USD) | Increase over 2012 (%) |
| Coal (including lignite) | 10000 tons | 751 | -19.1 | 11 | -33.1 |
| Rolled steel | 10000 tons | 6,234 | 11.9 | 532 | 3.4 |
| Textile yarns and textile articles | ---- | — | — | 1,069 | 11.7 |
| Clothes and clothing accessories | ---- | — | — | 1,770 | 11.3 |
| Footwear | ---- | — | — | 508 | 8.4 |
| Furniture | ---- | — | — | 518 | 6.2 |
| Automatic data processing machines and components | 10000 sets | 187,050 | 2.0 | 1,822 | -1.7 |
| Handheld mobiles and car telephones | 10000 sets | 118,582 | 16.9 | 951 | 17.3 |
| Containers | 10000 units | 270 | 8.8 | 79 | -6.4 |
| Liquid crystal display panels | 10000 units | 326,577 | 3.1 | 359 | -1.0 |
| Motor vehicles (including a complete set of spare sets) | 10000 sets | 92 | -6.7 | 120 | -5.3 |
Table 9: Main Import Commodities in Volume and Value and the Growth Rates in 2013
| Item | Volume (10000 tons) | Increase over 2012 (%) | Value (100 million USD) | Increase over 2012 (%) |
| Cereals and cereal flour | 1,458 | 4.3 | 51 | 6.6 |
| Soybean | 6,338 | 8.6 | 380 | 8.6 |
| Edible vegetable oil | 810 | -4.2 | 81 | -16.7 |
| Iron ore | 81,931 | 10.2 | 1,059 | 10.4 |
| Aluminum oxide | 383 | -23.7 | 14 | -22.7 |
| Coal (including lignite) | 32,708 | 13.4 | 290 | 1.1 |
| Crude oil | 28,192 | 4.0 | 2,196 | -0.5 |
| Petroleum products refined | 3,959 | -0.6 | 320 | -3.2 |
| Plastics in primary forms | 2,462 | 3.9 | 491 | 6.3 |
| Paper pulp | 1,685 | 2.4 | 114 | 3.7 |
| Rolled steel | 1,408 | 3.1 | 170 | -4.3 |
| Copper and copper alloys | 453 | -2.5 | 353 | -8.5 |
Table 10: Imports and Exports by Major Countries and Regions and the Growth Rates in 2013
Unit: 100 million USD
| Country or region | Exports | Increase over 2012 (%) | Imports | Increase over 2012 (%) |
| European Union | 3,390 | 1.1 | 2,200 | 3.7 |
| United States | 3,684 | 4.7 | 1,525 | 14.8 |
| ASEAN | 2,441 | 19.5 | 1,996 | 1.9 |
| Hong Kong, China | 3,848 | 19.0 | 162 | -9.3 |
| Japan | 1,503 | -0.9 | 1,623 | -8.7 |
| Republic of Korea | 912 | 4.0 | 1,831 | 8.5 |
| Taiwan, China | 406 | 10.5 | 1,566 | 18.5 |
| Russia | 496 | 12.6 | 396 | -10.2 |
| India | 484 | 1.6 | 170 | -9.6 |
The total value of imports and exports of services in 2013 (excluding the government services based on the coverage of international balance of payments and similarly hereinafter) was 539.6 billion US dollars, up by 14.7 percent. The export value of services was 210.6 billion US dollars, up by 10.6 percent. The import value of services was 329.1 billion US dollars, up by 17.5 percent. The deficit of exports minus imports of services was 118.5 billion US dollars.
The year 2013 witnessed the establishment of 22,773 enterprises with foreign direct investment in non-financial sectors, down by 8.6 percent over the previous year; and the foreign capital actually utilized was 117.6 billion US dollars, up by 5.3 percent.
Table 11: Total Value of Foreign Direct Investment in Non-financial Sectors and the Growth Rates in 2013
| Sector | Enterprises | Increase over 2012 (%) | Actually Utilized Value (100 million USD) | Increase over 2012 (%) |
| Total | 22,773 | -8.6 | 1,175.9 | 5.3 |
| Agriculture, Forestry, Animal Husbandry and Fishing | 757 | -14.2 | 18.0 | -12.7 |
| Manufacturing | 6,504 | -27.5 | 455.5 | -6.8 |
| Production and Supply of Electricity, Gas and Water | 200 | 7.0 | 24.3 | 48.2 |
| Transport, Storage, Post and Telecommunication Services | 401 | 1.0 | 42.2 | 21.4 |
| Information Transmission, Computer Services and Software | 796 | -14.0 | 28.8 | -14.2 |
| Wholesales & Retail Trade | 7,349 | 4.6 | 115.1 | 21.7 |
| Real Estate | 530 | 12.3 | 288.0 | 19.4 |
| Leasing and Business Services | 3,359 | 4.0 | 103.6 | 26.2 |
| Services to Households and Other Services | 166 | -13.5 | 6.6 | -43.6 |
In 2013, the overseas direct investment (non-financial sectors) by Chinese investors was 90.2 billion US dollars, up by 16.8 percent over the previous year.
In 2013, the accomplished business revenue through contracted overseas engineering projects was 137.1 billion US dollars, up by 17.6 percent, and the number of labor forces sent abroad through overseas labor contracts was 527 thousand, an increase of 2.9 percent.
VII. Transportation, Post, Telecommunications and Tourism
Transportation grew at a rapid and steady pace. The total freight traffic reached 45.1 billion tons, up by 9.9 percent over the previous year, and the freight flows were 18,647.8 billion ton-kilometers, grew by 7.3 percent. The volume of freight handled by ports above the designated size throughout the year totaled 10.61 billion tons, up 8.5 percent over the previous year, of which freight for foreign trade was 3.31 billion tons, up 9.2 percent. Container shipping of ports above the designated size reached 188.78 million standard containers, up by 6.7 percent.
Table 12: Freight Traffic by All Means of Transportation and
the Growth Rates in 2013
| Item | Unit | Volume | Increase over 2012 (%) |
| Total freight traffic | 100 million tons | 450.6 | 9.9 |
| Railways | 100 million tons | 39.7 | 1.6 |
| Highways | 100 million tons | 355.0 | 11.3 |
| Waterways | 100 million tons | 49.3 | 7.5 |
| Civil aviation | 10 000 tons | 557.6 | 2.3 |
| Pipelines[18] | 100 million tons | 6.6 | 6.3 |
Freight flows | 100 million ton-kilometers | 186,478.4 | 7.3 |
| Railways | 100 million ton-kilometers | 29,173.9 | 0.0 |
| Highways | 100 million ton-kilometers | 67,114.5 | 12.7 |
| Waterways | 100 million ton-kilometers | 86,520.6 | 5.9 |
| Civil aviation | 100 million ton-kilometers | 168.6 | 2.9 |
| Pipelines | 100 million ton-kilometers | 3,500.9 | 9.0 |
In 2013, the total passenger traffic reached 40.2 billion persons, up by 5.6 percent over 2012, and the passenger flows were 3,603.6 billion person-kilometers, grew by 7.9 percent.
Table 13: Passenger Traffic by All Means of Transportation and
the Growth Rates in 2013
| Item | Unit | Volume | Increase over 2012 (%) |
| Total passenger traffic | 100 million persons | 401.9 | 5.6 |
| Railways | 100 million persons | 21.1 | 10.8 |
| Highways | 100 million persons | 374.7 | 5.3 |
| Waterways | 100 million persons | 2.6 | 1.8 |
| Civil aviation | 100 million persons | 3.5 | 10.9 |
Passenger flows | 100 million person-kilometers | 36,036.0 | 7.9 |
| Railways | 100 million person-kilometers | 10,595.6 | 8.0 |
| Highways | 100 million person-kilometers | 19,705.6 | 6.7 |
| Waterways | 100 million person-kilometers | 76.3 | -1.6 |
| Civil aviation | 100 million person-kilometers | 5,658.5 | 12.6 |
The total number of motor vehicles for civilian use reached 137.41 million (including 10.58 million tri-wheel motor vehicles and low-speed trucks) by the end of 2013, up 13.7 percent, of which private-owned vehicles numbered 108.92 million, up 17.0 percent. The total number of cars for civilian use stood at 71.26 million, up 19.0 percent, of which private-owned cars numbered 64.10 million, up by 20.8 percent.
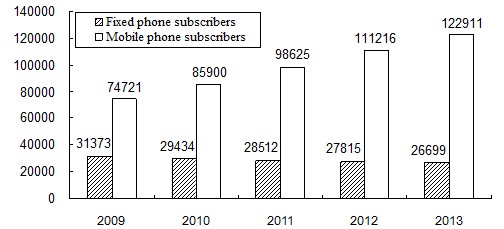
The turnover of post and telecommunication services[19] totaled 1,667.9 billion yuan, up 11.1 percent over the previous year. Of this total, post services was 272.5 billion yuan, up 33.8 percent, and telecommunication services 1,395.4 billion yuan, up 7.5 percent. In post services, the number of mail delivery reached 6.320 billion, parcel delivery 690 million and express delivery 9.19 billion. The revenue from express delivery reached 144.2 billion yuan. In 2013, with a decrease of 26.97 million lines of office switchboards, the total capacity stood at 410.52 million lines. The newly increased capacity of mobile phone switchboard[20] was 125.22 million lines with the total capacity reaching 1,965.45 million lines. The year also saw 266.99 million fixed telephone subscribers. Mobile phone users numbered 1,229.11 million by the end of 2013, with 116.96 million new subscribers in the year. Of this total, the number of 3G mobile phone users[21] reached 401.61 million. Phone coverage was 110.5 sets per 100 persons. The number of Internet users was 618 million, of whom mobile Internet surfers[22] was 500 million, and the coverage of Internet was 45.8 percent.

The year 2013 registered 3.26 billion domestic tourists[23], up 10.3 percent over the previous year. The revenue from domestic tourism totaled 2,627.6 billion yuan, up 15.7 percent. The number of inbound visitors to China totaled 129.08 million, a decrease of 2.5 percent. Of this total, 26.29 million were foreigners, down 3.3 percent; and 102.79 million were Chinese compatriots from Hong Kong, Macao and Taiwan, down by 2.3 percent. Of all the inbound tourists, overnight visitors counted 55.69 million, down 3.5 percent. Foreign exchange earnings from international tourism topped 51.7 billion US dollars, up 3.3 percent. The number of China’s outbound visitors totaled 98.19 million, up 18.0 percent. Of this total, 91.97 million were on private visits, a year-on-year rise of 19.3 percent.
VIII. Financial Intermediation
The performance of the financial market was generally stable. By the end of 2013, money supply of broad sense (M2) was 110.7 trillion yuan, reflecting an increase of 13.6 percent. Money supply of narrow sense (M1) was 33.7 trillion yuan, up 9.3 percent. Cash in circulation (M0) was 5.9 trillion yuan, up 7.2 percent.
In 2013, the total social financing[24] reached 17.3 trillion yuan, or 1.5 trillion yuan increase over 2012 on a comparable basis. Savings deposit in Renminbi and foreign currencies in all items of financial institutions totaled 107.1 trillion yuan at the end of 2013, an increase of 12.7 trillion yuan. Of this total, the savings deposit in Renminbi stood at 104.4 trillion yuan, an increase of 12.6 trillion yuan. Loans in Renminbi and foreign currencies in all items of financial institutions reached 76.6 trillion yuan, an increase of 9.3 trillion yuan. Of this total, loans in Renminbi was 71.9 trillion yuan, an increase of 8.9 trillion yuan.
Table 14: Savings Deposit and Loans in RMB and Foreign Currencies in All Financial Institutions and the Growth Rates at the End of 2013
Unit: 100 million yuan
| Item | Year-end figure | Increase over 2012 (%) |
| Savings deposit | 1,070,588 | 13.5 |
| By households | 465,437 | 13.5 |
| Deposits in RMB | 461,370 | 13.6 |
| By non-financial enterprises | 380,070 | 10.1 |
| Loans | 766,327 | 13.9 |
| Domestic short-term loans | 311,772 | 16.3 |
| Domestic medium and long-term loans | 410,346 | 12.8 |
Loans in Renminbi from rural financial institutions (rural credit cooperatives, rural cooperation banks, and rural commercial banks) totaled 9,164.4 billion yuan by the end of 2013, an increase of 1,332.4 billion yuan as compared with the beginning of the year. The loans in Renminbi for consumption use from all financial institutions totaled 12,972.1 billion yuan, an increase of 2,540.1 billion yuan. Of all consumption loans, short-term loans for individuals totaled 2,655.8 billion yuan, an increase of 719.8 billion yuan, and medium- and long-term loans for individuals reached 10,316.3 billion yuan, an increase of 1,820.3 billion yuan.
Funds raised in 2013 by enterprises through issuing stocks and share rights on stock market[25] amounted to 688.5 billion yuan, an increase of 104.4 billion yuan from the previous year. The refinancing of A-shares (including rationing shares, public newly issued, nonpublic newly issued[26] and warrants) received 280.3 billion yuan worth of capital altogether, an increase of 71.0 billion yuan from 2012. The listed companies financed 408.2 billion yuan through convertible bonds, bonds with attached warrants and corporate bonds, an increase of 136.9 billion yuan.
In 2013, 3.67 trillion yuan corporate debenture bonds [27] were issued, a decrease of 66.7 billion yuan over the previous year.
The premium[28] received by the insurance companies totaled 1,722.2 billion yuan in 2013, up 11.2 percent over the previous year. Of this total, life insurance premium amounted to 942.5 billion yuan, health and casualty insurance premium 158.5 billion yuan, and property insurance premium 621.2 billion yuan. Insurance companies paid an indemnity worth of 621.3 billion yuan, of which, life insurance indemnity was 225.3 billion yuan, health and casualty insurance indemnity 52.1 billion yuan, and property insurance indemnity 343.9 billion yuan.
IX. Living Conditions and Social Security
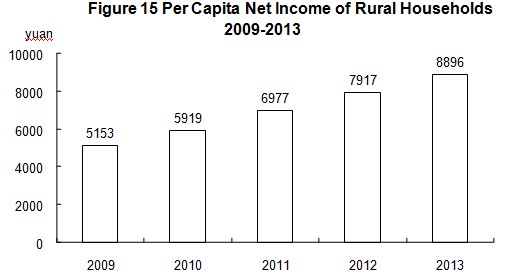
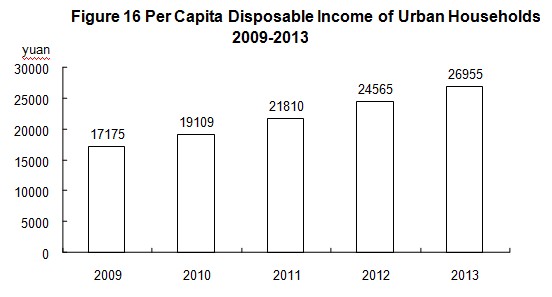
The income of urban and rural residents continued to rise. In 2013, the annual per capita net income of rural households was 8,896 yuan, up by 12.4 percent, or a real increase of 9.3 percent over the previous year. The median of per capita net income[29] of rural households was 7,907 yuan, up by 12.7 percent. The annual per capita disposable income of urban households was 26,955 yuan, up by 9.7 percent, or a real increase of 7.0 percent. The median of per capita disposable income of urban households was 24,200 yuan, up by 10.1 percent. According to the results of the integrated survey of rural and urban households[30] carried out from the fourth quarter of 2012, the annual per capita disposable income nationwide was 18,311 yuan, up by 10.9 percent, or a real rise of 8.1 percent over the previous year. Food expenditure accounted for 37.7 percent in the rural households and 35.0 percent in the urban households, down by 1.6 and 1.2 percentage points respectively.
By the end of 2013, a total of 322.12 million people participated in urban basic pension program for staff and workers, a year-on-year increase of 17.85 million. A total of 497.50 million people participated in basic pension insurance program for urban and rural residents, an increase of 13.81 million. A total of 573.22 million people participated in basic health insurance program, an increase of 36.80 million, of whom, 274.16 million people participated in basic health insurance program for staff and workers, a year-on-year increase of 9.30 million, and 299.06 million people participated in programs for residents, an increase of 27.50 million. Some 164.17 million people participated in unemployment insurance programs, an increase of 11.92 million. The number of people receiving unemployment insurance payment stood at 1.97 million. A total of 198.97 million people participated in work accident insurance, an increase of 8.87 million, of whom 72.66 million were migrant workers from rural areas, an increase of 0.86 million. A total of 163.97 million people participated in maternity insurance programs, an increase of 9.68 million. By the end of the year 2013, a total of 2,489 counties (cities, districts) adopted new cooperative medical care system in rural areas, with a participation rate of 99.0 percent. In the first nine months of 2013, the total expenditure[31] of the new cooperative medical care system in rural areas reached 206.7 billion yuan. According to the rural poverty line of annual per capita net income of 2,300 yuan (at 2010 constant prices), the population in poverty in rural areas numbered 82.49 million at the end of the year, or 16.50 million less than that at the end of 2012.
X. Education, Science & Technology and Culture
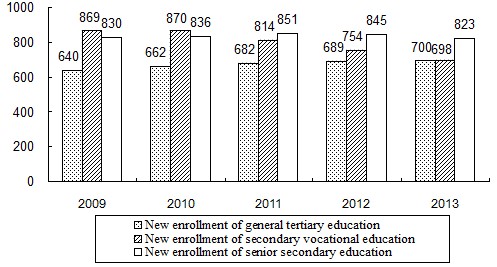
The educational, science & technology and cultural undertakings continued to develop. In 2013, the post-graduate education enrollment was 1.794 million students with 611 thousand new students and 514 thousand graduates. The general tertiary education enrollment was 24.681 million students with 6.998 million new students and 6.387 million graduates. Vocational secondary schools[32] had 19.602 million enrolled students, including 6.983 million new entrants, and 6.781 million graduates. Senior secondary schools had 24.359 million enrolled students, including 8.227 million new entrants, and 7.990 million graduates. Students enrolled in junior secondary schools totaled 44.401 million, including 14.961 million new entrants, and 15.615 million graduates. The country had a primary education enrollment of 93.605 million students, including 16.954 million new entrants, and 15.811 million graduates. There were 368 thousand students enrolled in special education schools, with 66 thousand new entrants and 51 thousand graduates. Kindergartens accommodated 38.947 million children.

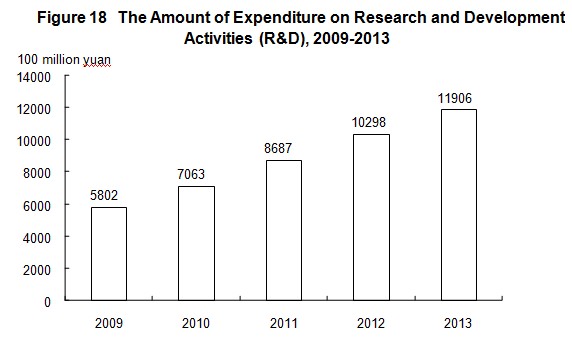
Expenditures on research and development activities (R&D) was worth 1,190.6 billion yuan in 2013, up 15.6 percent over 2012, accounting for 2.09 percent of GDP. Of this total, 56.9 billion yuan was appropriated for fundamental research programs. A total number of 3,543 projects under the National Key Technology Research and Development Program and 2,118 projects under the Hi-tech Research and Development Program (the 863 Program) were implemented. The year 2013 saw a total of 132 national engineering research centers, 143 national engineering laboratories. The number of state validated enterprise technical centers reached 1,002. Accumulatively, 141 venture investment enterprises were established under the support of State Venture Capital Investment Plans to Emerging industries[33], with a total fund size approaching 39.0 billion yuan, and an investment to 422 venture businesses. Some 2,377 thousand patent applications were accepted from home and abroad, of which 2,210 thousand were domestic applications, accounting for 93.0 percent of the total. A total number of 825 thousand patent applications for new inventions were accepted, of which 693 thousand were from domestic applicants or 84.0 percent of the total. A total of 1,313 thousand patents were authorized, of which 1,210 thousand were domestic patents, accounting for 92.2 percent of the total. A total of 208 thousand patents for new inventions were authorized, of which 138 thousand were domestic ones, accounting for 66.6 percent. Till the end of year 2013, the number of patents in force was 4.195 million, of which 3.525 million patents were domestic ones, accounting for 84.0 percent; the number of patents for inventions in force was 1,034 thousand, of which 545 thousand were domestic ones, accounting for 52.7 percent. A total of 295 thousand technology transfer contracts were signed, representing 746.90 billion yuan in value, up 16.0 percent over the previous year.
The year 2013 saw 14 times of successful launch of satellites. Shenzhou X Manned Spacecraft and Tiangong-1 Target Spacecraft successfully conducted the first fly-around and rendezvous experiment. Chang’e-3 lunar probe made a successful soft-landing on an extraterrestrial body and did inspection for the first time. The manned submersible Jiaolong achieved a transformation from deep sea trial to scientific application.
By the end of 2013, there were altogether 30,098 laboratories for product inspection, including 556 national inspection centers. There were 174 agencies for product quality and management system certification, which accumulatively certified products in 110,949 enterprises. A total of 1,870 national standards were developed or revised in the year, including 1,161 new standards. There were 1,687 seismological monitor stations and 32 regional seismological monitor network stations. The number of oceanic observation stations was 79. Mapping and geographic information departments published 1,585 maps.
At the end of 2013, there were 2,055 art-performing groups, 2,638 museums, 3,073 public libraries and 3,298 culture centers in the cultural system throughout China. Subscribers to cable television programs and digital cable television programs numbered 224 million and 169 million respectively. Radio broadcasting and television broadcasting coverage rates were 97.8 percent and 98.4 percent respectively. Totally 15,783 episodes of 441 TV series and 199,132 minutes of TV cartoons were made in 2013. The country produced 638 feature movies and 186 science, educational, documentary, cartoon and special movies[34]. A total of 47.8 billion copies of newspapers and 3.4 billion copies of magazines were issued, and 8.3 billion copies of books were published. By the end of the year, there were 4,122 archives in China and 120.59 million documents were made accessible to the public.
In 2013, Chinese athletes won 124 world championships on 22 sports events and broke 13 world records. Chinese physically-challenged athletes won 306 world championships in 28 international sports competitions.
XI. Public Health and Social Services
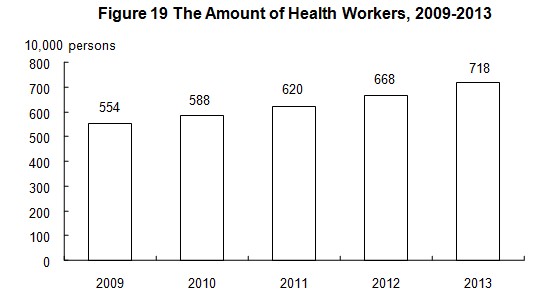
The public health and social services continued to make progress. By the end of 2013, there were 973,597 medical and health institutions in China, including 24,720 hospitals, 36,978 township health centers, 33,976 community health service centers, 184,058 clinics, 649,080 village clinics, 3,519 epidemic disease prevention centers and 2,994 health monitoring institutions. There were 7.18 million health workers in China, including 2.79 million practicing doctors and assistant practicing doctors and 2.78 million registered nurses. The medical and health institutions in China possessed 6.18 million beds, of which, hospitals possessed 4.58 million and township health centers had 1.13 million.
By the end of 2013, there were all together 47 thousand social welfare institutions[35] of various types providing 5.094 million beds, accommodating 3,100 thousand inmates. Of this total, 43 thousand were elder-caring organizations providing 4.746 million beds, accommodating 2,943 thousand inmates. There were 19 thousand community service centers and 103 thousand community service stations. Minimum living allowances were granted to 20.613 million urban residents and 53.821 million rural residents, and 5.382 million rural residents received five-guarantees supporting[36]. Another 12.293 million needy people in urban areas were financed to participate in urban medical insurance system, and 41.325 million needy people in rural areas were financed to participate in new rural cooperative medical care system.
XII. Resources, Environment and Work Safety
In 2013, the total supply of state-owned land for construction use[37] was 730 thousand hectares, a growth of 5.8 percent over the previous year. Of this total, the supply for mining storage was 210 thousand hectares, up 3.2 percent; that for real estate[38] was 200 thousand hectares, up 26.8 percent; and that for infrastructure facilities was 320 thousand hectares, down 2.9 percent.
The total stock of water resources in 2013 was 2,786.0 billion cubic meters. The annual average precipitation was 665 millimeters. At the end of 2013, 613 large reservoirs in China stored 348.8 billion cubic meters of water, down 5 percent. With an increase of 0.6 percent over 2012, the total water consumption reached 617.0 billion cubic meters, of which water consumption for living purposes rose by 2.7 percent, for industrial use increased by 1.4 percent, for agricultural use down by 0.1 percent, and for ecological water supplement grew by 1.6 percent. Water consumption for every 10 thousand yuan worth of GDP produced[39] was 121 cubic meters, a decline of 6.5 percent over the previous year. Water consumption for every 10 thousand yuan worth of industrial value added was 68 cubic meters, down by 5.7 percent. Per capita water consumption was 453 cubic meters, maintaining the same level as 2012.
In 2013, a total of 6.09 million hectares of forests were planted, of which 4.18 million hectares were afforested by manpower. Some 2.49 million hectares were afforested through key afforestation projects, accounting for 40.9 percent of the total planted area of the year. By the end of 2013, there were 2,697 natural reserves including 407 national ones. A total of 57 thousand square kilometers of eroded land was put under treatment programs, and 20 thousand square kilometers of land was closed for nurture and protection in areas suffering water and soil erosion.
The average temperature in 2013 was 10.2℃. Typhoon hit China 9 times in 2013.
Preliminary estimation indicated that the total energy consumption in 2013 amounted to 3.75 billion tons of standard coal equivalent, up 3.7 percent over 2012. The consumption of coal grew by 3.7 percent; crude oil, up 3.4 percent; natural gas, up 13.0 percent; and electric power, up 7.5 percent. The national energy consumption per 10,000 yuan worth of GDP went down by 3.7 percent.
Monitoring of water quality on 704 sections of the 10 major river basins[40] in China showed that 71.7 percent of the sections met the national quality standard from Grade I to Grade III for surface water; and 8.9 percent were worse than Grade V. Generally, the water quality in the 10 major basins maintained stable with slight pollution.
Monitoring of oceanic water quality at 301 offshore monitoring stations indicated that oceanic water met the national quality standard Grade I and II in 66.4 percent of the stations; water quality at 8.0 percent of the stations met Grade III standard; and water of Grade IV or inferior quality was found at 25.6 percent of the stations.
At the end of 2013, the daily treatment capacity of city sewage reached 122.46 million cubic meters, up 4.4 percent over that in 2012. City sewage treatment rate was 87.9 percent, up 0.6 percentage points. The floor space with central heating systems in urban area amounted to 5.41 billion square meters, up 4.5 percent. Greenery coverage reached 36.0 percent of the urban area, up 0.3 percentage point.
In 2013, natural disasters hit 31.35 million hectares of crops, of which 3.84 million hectares of crops were demolished. Flood and waterlog caused a direct economic loss of 188.4 billion yuan. Drought caused a direct economic loss of 90.5 billion yuan. Disasters from low temperature, frost and snow made a total direct economic loss of 26 billion yuan. Oceanic disasters caused a direct economic loss of 16.5 billion yuan. The country recorded 41 earthquakes with magnitude 5 and over, 14 of which caused disasters, causing a direct economic loss of 99.5 billion yuan. The year 2013 witnessed 3,929 forest fires, with 14 thousand hectares of forests damaged.
The death toll due to work accidents amounted to 69,434 people. The death toll from work accidents for every 100 million yuan worth of GDP was 0.124 people, a decline of 12.7 percent. Work accidents in industrial, mining and commercial enterprises caused 1.52 deaths out of every 100 thousand employees, down 7.3 percent. The road traffic death toll per 10 thousand vehicles was 2.3 persons, down 8.0 percent. The death toll for one million tons of coal produced in coalmines was 0.288 person, down 23.0 percent.
Notes:
1. All figures in this Communiqué are preliminary statistics. Statistics in this Communiqué do not include Hong Kong SAR, Macao SAR and Taiwan Province. Due to the rounding-off reasons, the subentries may not add up to the aggregate totals.
2. Population live in places other than their household registration refers to those whose current residences are different from the registered towns or streets from which they have been away for more than half a year.
3. Floating population refers to the population who live in places other than their household registration, excluding those with current residence different from the place of their household registration in the same city. Population live in places other than their household registration in the same city refer to those whose current residence are different from the registered towns or streets in the same district or in different districts in the same municipality or prefecture-level city.
4. As the age at entry into employment is 16 in China, the data of population aged 16 to 59 ((including people not yet reaching the age of 60) have been published since 2013. According to the definitions in previous Communiqués, the number of people aged 0 to 14 (including people not yet reaching the age of 15) totaled 223.29 million, the number of people aged 15 to 59 (including people not yet reaching the age of 60) reached 935 million.
5. Gross domestic product (GDP) and value added as quoted in this Communiqué are calculated at current prices whereas their growth rates are at constant prices.
6. The number of migrant workers includes those who are employed outside their villages and towns for more than six months in the year and those who do non-agricultural work in their villages and towns for more than six months in the year.
7. The producer prices for farm products refer to the prices of farm products sold directly by producers.
8. Public revenue refers to the revenue with taxes as the main body which was collected by the government as social manager by virtue of state political rights.
9. Data for the public revenue from 2009 to 2012 as shown in the figure were final accounts, and the revenue of 2013 was executive accounts.
10. From 2013, according to the “National Industrial Classification of All Economic Activities” (GB/T 4754-2011), industries was grouped by mining, manufacturing and production and supply of electricity, heat, gas and water, instead of light industry and heavy industry.
11. Six highly energy-consuming industries are: manufacture of raw chemical materials and chemical products, manufacture of non-metallic mineral products, smelting and pressing of ferrous metals, smelting and pressing of non-ferrous metals, oil processing, coking and nuclear fuel processing, and production and supply of electricity and heat.
12. Natural gas includes natural gas from gas fields, natural gas from oil fields (gas from oil fields gas zones and dissolved gas associated with oil fields) and natural gas from coal mines (i.e. methane gas from coal mines).
13. Output and consumption of rolled steel include duplicated counting of rolled steel as intermediate inputs used for producing other types of rolled steel.
14. The national total of fixed assets investment is larger than the aggregate sum by adding up the subtotals of fixed assets investment in the eastern areas, central areas, western areas and northeast areas due to the fact that some of the trans-regional investments are not covered by regional figures. The eastern areas include 10 provinces and municipalities: Beijing, Tianjin, Hebei, Shanghai, Jiangsu, Zhejiang, Fujian, Shandong, Guangdong and Hainan; central areas cover 6 provinces: Shanxi, Anhui, Jiangxi, Henan, Hubei and Hunan; western areas include 12 provinces, autonomous regions and municipality: Inner Mongolia, Guangxi, Chongqing, Sichuan, Guizhou, Yunnan, Tibet, Shaanxi, Gansu, Qinghai, Ningxia and Xinjiang; northeastern areas include 3 provinces: Liaoning, Jilin and Heilongjiang.
15. The investment in real estate includes the investment made in real estate development, construction of buildings for own use, property management, intermediary services and other real estate development.
16. According to the “National Industrial Classification of All Economic Activities” (GB/T 4754-2011), a revision was made to the classification of three industries: services in farming, forestry, animal husbandry and fishery, mining auxiliary activities in mining and metal products, machinery and equipment repairing in manufacturing were grouped into the tertiary industry.
17. High-speed railways refer to railways with a highest operating speed reaching 200 km/h or above.
18. In addition to China National Petroleum Corporation and China Petrochemical Corporation, China National Offshore Oil Corporation was added for data of pipeline transportation in 2013.
19. The turnover of post and telecommunication services is calculated at constant prices of 2010.
20. The capacity of mobile phone switchboard refers to the number of maximum concurrent users calculated by the mobile phone switchboard according to certain calling model and switchboard processing capacity.
21. 3G refers to the third generation cellular mobile communication system. 3G mobile phone users refer to those who have records in the billing system and use 3G network resources at the end of the reporting period.
22. The number of mobile Internet surfer refers to the number of Chinese residents aged over 6 and above who connected to and surfed on the Internet via mobile phones in the past six months.
23. To standardize the name of indicators, the number of travelers, the number of tourists and travelers in previous communiqués are all referred to as tourists.
24. Social financing refers to the total funds raised by real economy from the financial system over a period of time. It is an increment.
25. 2013 witnessed no Initial Public Offering.
26. Non-public new issue or targeted placement excludes assets subscription.
27. Corporate debenture bonds include debt financing instruments of non-financial businesses, enterprise bonds, corporate bonds and convertible bonds.
28. The original premium income received by the insurance companies refers to the premium income from original insurance contracts confirmed by the insurance companies.
29. The median of per capita income refers to the per capita income of household lied in the middle of all surveyed households which are ranked from low to high(or from high to low) based on per capita income level.
30. In the fourth quarter of 2012, the National Bureau of Statistics of China (NBS) conducted the integrated survey of urban and rural households, unifying the names, classification and statistical standards of urban and rural households and selecting 160 thousand urban and rural households across the country to conduct direct surveys. On its basis, per capita disposable income of national residents was calculated according to the new definitions which make urban and rural households comparable. Meanwhile, per capita net income of rural households and per capita disposable income of urban households were also surveyed and calculated according to the old definitions to make the data comparable with previous years.
31. According to the statistical system of the National Health and Family Planning Commission, the total expenditure of new cooperative medical care system in rural areas only covers the first nine months of the year.
32. Vocational secondary schools include regular specialized secondary schools, adult specialized secondary schools, vocational high schools and skilled workers schools. The data concerning skilled workers schools come from that of 2012.
33. Venture capital investment plan for new emerging industries refers to the activities in which the central government special funds, together with the local government funds and social funds set up venture investment enterprises, or invest in the venture businesses in the form of equity investment to foster or promote the development of emerging industries.
34. Special movies refer to those using different display modes in terms of projection techniques, equipment and program as compared with the ordinary cinemas, such as IMAX movies, 3D movies, 4D movies, multidimensional movies and full dome movies.
35. Social service institutions with accommodation include adoption agencies as well as aid agencies, community agencies, military sanatoriums, military supply stations and etc.
36. Five-guarantees supporting in rural areas refers to villagers who are aged, disabled or under the age of 16 and have no ability to work, no source of income and no statutory obligors to provide for them, bring them up or support them, or whose statutory obligors have no ability to provide for them, bring them up or support them, shall enjoy life-care and physical care in terms of food, clothing, housing, medical care and funeral expenses.
37. Total supply of state-owned land for construction use refers to the supply of state-owned land for construction use with the land-used right sold, allocated or leased to units or individuals by the municipal or county governments according to annual land supply plan and in line with relevant laws in the reporting period.
38. Land used for real estate refers to the sum of land used for commercial service and for residence.
39. The consumption of water and energy for producing 10 thousand yuan worth of GDP and water consumption for every 10 thousand yuan worth of industrial value added are calculated at 2010 constant prices.
40. Ten major river basins include 7 major water systems (the Yangtze River, Yellow River, Pearl River, Songhua River, Huaihe River, Haihe River and Liaohe River), and rivers in Zhejiang and Fujian Provinces, rivers in Northwest China and rivers in Southwest China.
41. The new national Standards on Air Quality was put into effect in 2013. Since the data for the whole year are under tabulating and analysis, the new set of data on air quality in 2013 is left vacant for the time being. The ministry concerned will officially release the aggregates for year 2013 in March 2014.
Data Sources:
In this Communiqué, data of newly increased employed people, unemployment rate through unemployment registration and social security are from the Ministry of Human Resources and Social Security; financial data are from the Ministry of Finance; data of foreign exchange reserves and exchange rate are from the State Administration of Foreign Exchange; data of output of aquatic products are from the Ministry of Agriculture; data of production of timber, forestry and forest fires are from the State Forestry Administration; data of areas with effective irrigation system and water resources are from the Ministry of Water Resources; data of newly increased power generating capacity and newly increased power transformer equipment with a capacity of over 220 kilovolts are from China Electricity Council; data of new railways put into operation, double-track railways put into operation, electrified railways put into cooperation and railway transportation are from the Ministry of Railways; data of new highways, new cargo-handling capacity of berths for over 10000-tonnage ships, highway transportation, waterway transportation and volume of freight handled by ports are from the Ministry of Transport; data of new lines of optical-fiber cables, new capacity of phone switchboards, the number of phone users and internet users etc. are from the Ministry of Industry and Information Technology; data of indemnificatory housing, treatment of city sewage, area with central heating systems and greenery coverage are from the Ministry of Housing and Urban-Rural Development; data of imports and exports of goods are from the General Administration of Customs; data of imports and exports of services, foreign direct investment, overseas direct investment, overseas contracted projects and overseas labor contracts are from the Ministry of Commerce; data of civil aviation are from the General Administration of Civil Aviation; data of pipelines are from China National Petroleum Corporation, China Petrochemical Corporation and China National Offshore Oil Corporation; data of motor vehicles for civilian use and the road traffic death toll are from the Ministry of Public Security; data of post services are from the State Post Bureau; data of tourism are from the National Tourism Administration and the Ministry of Public Security; data of money and finance and corporate debenture bonds are from the People’s Bank of China; data of listed companies are from the China Securities Regulatory Commission; data of insurances are from China Insurance Regulatory Commission; data of health and new cooperative medical care system in rural areas are from the National Health and Family Planning Commission; data of education are from the Ministry of Education; data of national technology research and development program and technology transfer contracts are from the Ministry of Science and Technology; data of national engineering research centers, enterprise technical centers and venture capital investment for boosting new emerging industries are from the National Development and Reform Commission; data of patents are from the State Intellectual Property Office; data of satellite launch are from the State Administration of Science, Technology and Industry for National Defense; data of quality inspection, development and revision of national standards are from the General Administration of Quality Supervision, Inspection and Quarantine; data of earthquakes are from the China Seismological Bureau; data of oceanic observation stations, direct economic loss caused by oceanic disasters are from the State Oceanic Administration; data of mapping are from the National Administration of Surveying, Mapping and Geoinformation; data of art-performing groups, museums, public libraries and culture centers are from the Ministry of Culture; data of radio, television, movies, newspapers, magazines and books are from the State Administration of Press, Publication, Radio, Film and Television; data of documents are from the State Archives Administration; data of sports are from the General Administration of Sport; data of physically-challenged athletes are from the China Disabled Persons’ Federation; data of social services, minimum living allowances, five-guarantees supporting, areas of crops hit by natural disasters, direct economic loss caused by flood and waterlog, direct economic loss caused by drought, direct economic loss caused by low temperature, frost and snow are from the Ministry of Civil Affairs; data of supply of state-owned land for construction use are from the Ministry of Land and Resources; data of natural reserves and environment monitoring are from the Ministry of Environmental Protection; data of average temperature and typhoon are from the China Meteorological Administration; data of work safety are from the State Administration of Work Safety; all the other data are from the National Bureau of Statistics.