Statistical Communiqué on the 2011 National Economic and Social Development
Statistical Communiqué of the People's Republic of China
on the 2011 National Economic and Social Development[1]
National Bureau of Statistics of China
February 22, 2012
In 2011, faced with the complicated and volatile domestic and international economic environment, under the firm leadership of the CPC Central Committee and the State Council, the people of all nationalities of China, taking Deng Xiaoping Theory and the important thought of “Three Represents” as the guidance, the scientific development as the theme and the transformation of economic development mode as the mainline, carried out the package of plans and policies aiming at strengthening and improving the macro control. As a result, national economic performance maintained steady and rapid development, all social undertakings achieved new progress, and a good start was achieved for the Twelfth Five-Year Period.
I. General Outlook
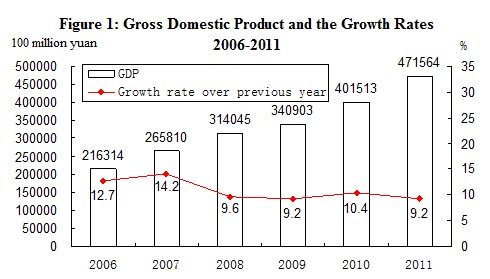
In 2011, the gross domestic product (GDP)[2] of the year was 47,156.4 billion yuan, up by 9.2 percent over the previous year. Of this total, the value added of the primary industry was 4,771.2 billion yuan, up by 4.5 percent, that of the secondary industry was 22,059.2 billion yuan, up by 10.6 percent and the tertiary industry was 20,326.0 billion yuan, up by 8.9 percent. The value added of the primary industry accounted for 10.1 percent of the GDP, that of the secondary industry accounted for 46.8 percent, and that of the tertiary industry accounted for 43.1 percent.
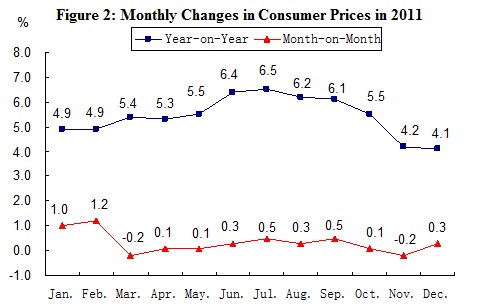
The consumer price in 2011 went up by 5.4 percent over the previous year. Of this total, the prices for food went up by 11.8 percent. The prices for investment in fixed assets increased by 6.6 percent. The producer prices and the purchasing prices for manufactured goods were up by 6.0 percent and 9.1 percent respectively. The producer prices for farm products[3] were up by 16.5 percent.
|
Table 1: General Level of Consumer Prices in 2011 Unit: % | |||
|
Item |
National Average |
| |
|
Rural | ||
|
|
|
|
|
|
General level of consumer prices |
5.4 |
5.3 |
5.8 |
|
Food |
11.8 |
11.6 |
12.4 |
|
Tobacco, liquor and articles |
2.8 |
3.0 |
2.4 |
|
Clothing |
2.1 |
2.2 |
1.9 |
|
Household appliances and maintaining services |
2.4 |
2.7 |
1.5 |
|
Medical, health and personal articles |
3.4 |
3.4 |
3.3 |
|
Transportation and telecommunications |
0.5 |
0.2 |
1.3 |
|
Recreation, education, culture articles and services |
0.4 |
0.3 |
0.8 |
|
Housing |
5.3 |
5.1 |
5.7 |
|
|
|
|
|
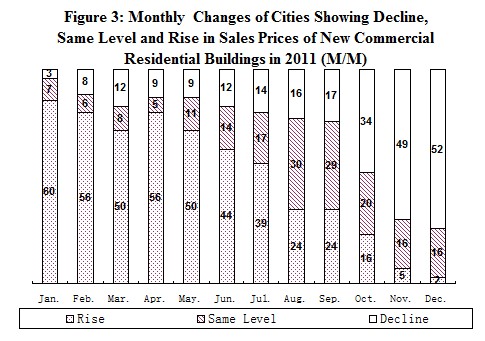
The number of cities among 70 large and medium-sized cities showing the decline of monthly sales prices (month-on-month) for new commercial residential buildings was gradually increasing. In December, fifty-two cities witnessed the decline of the sales prices, which were 49 more than that in January.
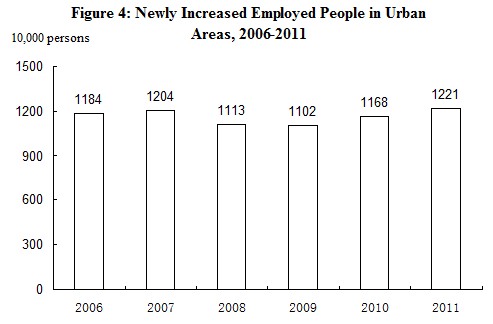
At the end of year 2011, the number of employed people in
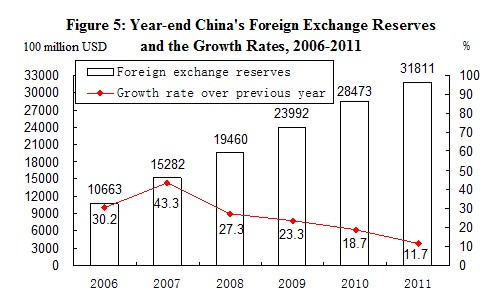
At the end of 2011, China’s foreign exchange reserves reached 3,181.1 billion US dollars, an increase of 333.8 billion US dollars as compared with that at the end of the pervious year. At the end of the year, the exchange rate was 6.3009 RMB to 1 USD, an appreciation by 5.1 percent over that at the end of 2010.
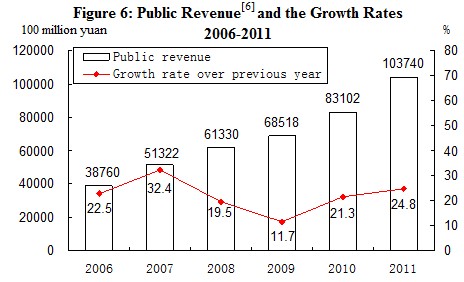
In 2011,the total public revenue[5] reached 10,374.0 billion yuan, up by 24.8 percent or an increase of 2,063.9 billion yuan over that in the previous year. Of this total, the taxes collected in the whole year reached 8,972.0 billion yuan, up by 22.6 percent or an increase of 1,651.0 billion yuan over 2010.
II. Agriculture
In 2011, the sown area of grain was 110.57 million hectares, an increase of 700 thousand hectares compared with that in the previous year; the sown area of cotton was 5.04 million hectares, a rise of 190 thousand hectares; the sown area of oil-bearing crops was 13.79 million hectares, a decrease of 100 thousand hectares; the sown area of sugar crops was 1.95 million hectares, an increase of 40 thousand hectares.
The total output of grain in 2011 was 571.21 million tons, an increase of 24.73 million tons or up by 4.5 percent over the previous year. Of this total, the output of summer crops was 126.27 million tons, increased by 2.5 percent, and that of the early rice was 32.76 million tons, increased by 4.5 percent over the previous year. The output of autumn grain was 412.18 million tons, an increase of 5.1 percent.

In 2011, the output of cotton was 6.60 million tons, an increase of 10.7 percent over the previous year, that of oil-bearing crops was 32.79 million tons, up by 1.5 percent and that of sugar crops was 125.20 million tons, an increase of 4.3 percent, that of tobacco was 2.87 million tons, up by 5.1 percent, and that of tea was 1.62 million tons, up by 9.9 percent.
The total output of meat for the year reached 79.57 million tons, up by 0.4 percent over the previous year. Of this total, the output of pork was 50.53 million tons, down by 0.4 percent, and that of beef and mutton was 6.48 and 3.93 million tons, decreased by 0.9 percent and 1.4 percent respectively. At the end of the year, 467.67 million pigs were registered in the total stocks, up by 0.7 percent, and 661.70 million pigs were slaughtered, down by 0.8 percent. The total output of eggs was 28.11 million tons, up by 1.8 percent. The production of milk was 36.56 million tons, up by 2.2 percent.
The total output of aquatic products was 56.00 million tons, up by 4.2 percent. Of this total, the output of cultured aquatic products was 40.26 million tons, up by 5.2 percent; and that of fished aquatic products was 15.74 million tons, up by 1.9 percent over the previous year.
The total production of timber for the year 2011 reached 72.72 million cubic meters, a drop of 10.1 percent.
Over 1.81 million hectares of farmland was increased with effective irrigation systems and another additional 2.21 million hectares of farmland was guaranteed by water-saving irrigation systems.
III. Industry and Construction
In 2011, the total value added of the industrial sector was 18,857.2 billion yuan, up by 10.7 percent over the previous year. The value added of industrial enterprises above the designated size[7] increased by 13.9 percent. Of the industrial enterprises above the designated size, the value added of the state-owned and state-holding enterprises grew by 9.9 percent, that of the collective enterprises went up by 9.3 percent, that of the share-holding enterprises increased by 15.8 percent, that of the enterprises by foreign investors and investors from Hong Kong, Macao and Taiwan soared by 10.4 percent and 19.5 percent growth for private enterprises. The growth of the light industry was 13.0 percent and that of the heavy industry was 14.3 percent.

In 2011, of the industrial enterprises above designated size, the growth of value added for processing of food from agricultural products was 14.1 percent over the previous year; for textile industry was 8.3 percent; for manufacture of general machinery 17.4 percent; for manufacture of special purpose machinery 19.8 percent; for manufacture of transport equipment 12.0 percent; for manufacture of communication equipment, computers and other electronic equipment 15.9 percent and for manufacture of electrical machinery and equipment 14.5 percent. The growth of the value added for the major six high energy consuming industries[8] was 12.3 percent, of which, that of the manufacture of non-metallic mineral products was 18.4 percent, manufacture of raw chemical materials and chemical products 14.7 percent, smelting and pressing of non-ferrous metals 13.6 percent, smelting and pressing of ferrous metals 9.7 percent, production and supply of electric power and heat power 10.1 percent and 7.6 percent for processing of petroleum, coking, processing of nuclear fuel. The value added growth for the high-tech industry was 16.5 percent over the previous year.
|
Table 2: Output of Major Industrial Products and the Growth Rates in 2011 | |||
|
Product |
Unit |
Output |
Increase over 2010 (%) |
|
|
|
|
|
|
Yarn |
10000 tons |
2900.0 |
6.7 |
|
Cloth |
100 million meters |
837.0 |
4.6 |
|
Chemical fibers |
10000 tons |
3390.0 |
9.7 |
|
Sugar (final product) |
10000 tons |
1187.4 |
6.2 |
|
Cigarettes |
100 million |
24474.0 |
3.0 |
|
Color TV sets |
10000 |
12231.4 |
3.4 |
|
Of which: LCD TV sets |
10000 |
10298.5 |
15.2 |
|
Household refrigerators |
10000 |
8699.2 |
19.2 |
|
Room air conditioners |
10000 |
13912.5 |
27.8 |
|
Total primary energy production |
100 million tons of standard coal equivalent |
31.8 |
7.0 |
|
Coal |
100 million tons |
35.2 |
8.7 |
|
Crude oil |
100 million tons |
2.04 |
0.3 |
|
Natural gas |
100 million cubic meters |
1030.6 |
8.7 |
|
Electricity |
100 million kilowatt-hours |
47000.7 |
11.7 |
|
Of which: Thermal-power |
100 million kilowatt-hours |
38253.2 |
14.8 |
|
Hydro-power |
100 million kilowatt-hours |
6940.4 |
-3.9 |
|
Nuclear-power |
100 million kilowatt-hours |
863.5 |
16.9 |
|
Crude steel |
10000 tons |
68388.3 |
7.3 |
|
Rolled steel[9] |
10000 tons |
88258.2 |
9.9 |
|
Ten kinds of nonferrous metals |
10000 tons |
3434.0 |
10.0 |
|
Of which: Refined copper (copper) |
10000 tons |
517.9 |
12.9 |
|
Aluminum electrolyze |
10000 tons |
1767.7 |
12.1 |
|
Aluminum oxide |
10000 tons |
3417.2 |
18.1 |
|
Cement |
100 million tons |
20.9 |
10.8 |
|
Sulfuric acid |
10000 tons |
7466.4 |
5.3 |
|
Soda ash |
10000 tons |
2308.2 |
13.4 |
|
Caustic soda |
10000 tons |
2466.2 |
10.7 |
|
Ethylene |
10000 tons |
1527.5 |
7.5 |
|
Chemical fertilizers (100 percent equivalent) |
10000 tons |
6217.2 |
-1.9 |
|
Power-generating equipment |
10000 kilowatts |
14410.4 |
11.9 |
|
Motor vehicles |
10000 |
1841.6 |
0.8 |
|
Of which: Basic passenger cars (cars) |
10000 |
1012.7 |
5.8 |
|
Large & medium tractors |
10000 |
40.2 |
19.3 |
|
Integrated circuits |
100 million pieces |
719.6 |
10.3 |
|
Program-controlled switchboards |
10000 lines |
3034.0 |
-3.3 |
|
Mobile telephones |
10000 |
113257.6 |
13.5 |
|
Micro-computers |
10000 |
32036.7 |
30.3 |
|
|
|
|
|
The profits made by the industrial enterprises above the designated size in 2011 were 5,454.4 billion yuan, an increase of 25.4 percent over the same period of last year.
Table 3: Profits and Growth Rates of Industrial Enterprises Unit: 100 million yuan Item Total Profits Increase over 2010 (%) Industrial enterprises above designated size 54544 25.4 Of which: State-owned and state-holding enterprises 14989 15.0 Of which: Collective enterprises 882 34.0 Share-holding enterprises 31651 31.2 Enterprises by foreign investors or investors from Hong Kong, Macao and Taiwan 14038 10.6 Of which: Private enterprises 16620 46.0
above the Designated Size in 2011
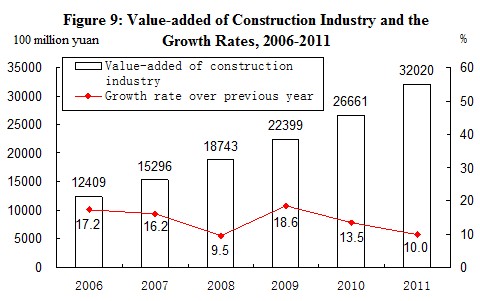
In 2011, the value added of construction enterprises in China was 3,202.0 billion yuan, up by 10.0 percent over the previous year. The profits made by construction enterprises qualified for general contracts and specialized contracts reached 424.1 billion yuan, up by 24.4 percent, of which the profits made by the state-owned and state-holding enterprises were 117.2 billion yuan, up by 36.0 percent.
IV. Investment in Fixed Assets
The completed investment in fixed assets[10] of the country in 2011 was 31,102.2 billion yuan, up by 23.6 percent over the previous year. The real growth was 15.9 percent after deducting the price factors. Of the total investment, the investment in fixed assets (excluding rural households) was 30,193.3 billon yuan, up by 23.8 percent; and the investment in rural households reached 908.9 billion yuan, up by 15.3 percent. The investment in eastern areas[11] was 13,031.9 billion yuan, up by 20.1 percent over the previous year, in central areas was 7,078.3 billion yuan, a growth of 27.5 percent, in western areas 7,184.9 billion yuan, a growth of 28.7 percent, and in northeastern areas 3,268.7 billion yuan, up by 30.4 percent.
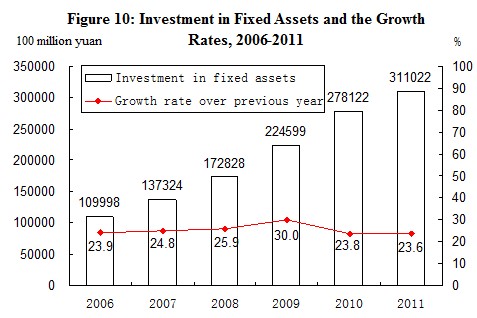
Table 4: Fixed Assets Investment (Excluding Rural Households) Unit: 100 million yuan Sector Investment Increase over 2010 (%) Total 301933 23.8 Agriculture, Forestry, Animal Husbandry and Fishing 6792 25.0 Mining 11810 21.4 Of Which: Mining and Washing of Coal 4897 25.9 Extraction of Petroleum and Natural Gas 3057 12.5 Manufacturing 102594 31.8 Of Which: Processing of Food from Agricultural Products 5229 44.1 Manufacture of Foods 2386 23.1 Textile Industry 3669 30.9 Manufacture of Textiles, Garments, Shoes and Hats 2267 43.0 Processing of Petroleum, Coking, Processing Nuclear Fuel 2234 10.1 Manufacture of Raw Chemical Materials and Chemical Products 8899 26.4 Manufacture of Non-Metallic Mineral Products 10448 31.8 Smelting and Pressing of Ferrous Metals 3860 14.6 Smelting and Pressing of Non-Ferrous Metals 3861 36.4 Manufacture of Metal Products 5045 23.1 Manufacture of General Machinery 7702 30.6 Manufacture of Special Purpose Machinery 5893 39.2 Manufacture of Transport Equipment 8406 27.2 Manufacture of Electric Machinery and Equipment 7851 44.6 Manufacture of Communication Equipment, Computers and Other Electronic Equipment 5266 34.2 Production and Supply of Electricity, Gas and Water 14607 3.8 Of Which: Production and Supply of Electric Power and Heat Power 11557 1.8 Construction 3253 42.9 Transport, Storage and Post 27260 1.8 Information Transmission, Computer Services and Software 2161 0.4 Wholesale and Retail Trade 7322 40.1 Lodging and Catering Services 3916 34.3 Banking 628 42.0 Real Estate[12] 75685 29.7 Leasing and Business Services 3374 40.3 Scientific Research, Technical Service and Geologic Prospecting 1650 39.4 Water Conservancy, Environment and Public Facilities Management 24537 14.2 Services to Households and Other Services 1217 52.9 Education 3882 13.7 Health, Social Security and Social Welfare 2331 28.1 Culture, Sports and Entertainment 3148 21.3 Public Management and Social Organization 5766 18.1 Table 5: Newly Increased Production Capacity Item Unit Volume Newly increased power generating capacity 10000 kilowatts 9041 Newly increased power transformer equipment with a capacity of over 220 kilovolts 10000 kilovolt-amperes 20906 New railways put into operation Kilometer 2167 Of which, high-speed railways[13] Kilometer 1421 Double-track railways put into operation Kilometer 1889 Electrified railways put into operation Kilometer 3398 New highways Kilometer 55285 Of which: Expressways Kilometer 9124 New cargo-handling capacity of berths for over 10000-tonnage ships 10000 tons 26639 New lines of optical-fiber cables 209 New capacity of digital cellular mobile phone switchboards 10000 subscribers 20406
and Its Growth by Sector in 2011
through Fixed Assets Investment in 2011
In 2011, the investment in real estate development was 6,174.0 billion yuan, up by 27.9 percent. Of this total, the investment in commercial residential buildings reached 4,430.8 billion yuan, an increase of 30.2 percent, that in office buildings was 254.4 billion yuan, up by 40.7 percent, and that in buildings for commercial business was 737.0 billion yuan, up by 30.5 percent.
In 2011, the newly started construction of affordable housing projects in urban areas amounted to 10.43 million units (households), and the affordable housing projects in urban areas basically completed were 4.32 million units.
Table 6: Main Indicators for Real Estate Development Item Unit Volume Increase over 2010 (%) Finished Value of Investment 100 million yuan 1740 27.9 Of which: residential buildings 100 million yuan 44308 30.2 Of which: 90 square meters and below 100 million yuan 13637 28.0 Floor space of houses under construction 10000 square meters 507959 25.3 Of which: residential buildings 10000 square meters 388439 23.4 Floor space of houses newly started 10000 square meters 190083 16.2 Of which: residential buildings 10000 square meters 146035 12.9 Floor space of houses completed 10000 square meters 89244 13.3 Of which: residential buildings 10000 square meters 71692 13.0 Sales of commercial buildings 10000 square meters 109946 4.9 Of which: residential buildings 10000 square meters 97030 3.9 Sources of capital this year 100 million yuan 83246 14.1 Of which: domestic loans 100 million yuan 12564 0.0 Individual mortgage 100 million yuan 8360 -12.2 Land space purchased this year 10000 square meters 40973 2.6 Purchase of land 100 million yuan 8049 -1.9
and Sales and Its Growth in 2011
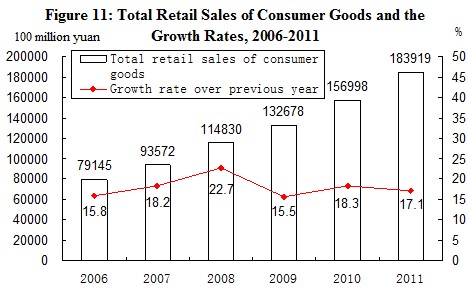
In 2011, the total retail sales of consumer goods reached 18,391.9 billion yuan, a growth of 17.1 percent over the previous year, or a real growth of 11.6 percent after deducting price factors. An analysis on different areas[14] showed that the retail sales of consumer goods in urban areas stood at 15,955.2 billion yuan, up by 17.2 percent, and that in rural areas reached 2,436.7 billion yuan, up by 16.7 percent. Grouped by consumption patterns, the income of retail sales of commodities was 16,328.4 billion yuan, up by 17.2 percent, and that of catering industry was 2,063.5 billion yuan, up by 16.9 percent.
Of the total retail sales of commodities by enterprises above designated size, the year-on-year growth of sales for motor vehicles was 14.6 percent, that for grain and oil was 29.1 percent, for meat and eggs 27.6 percent, for clothing 25.1 percent, for daily necessities 24.1 percent, for cultural and office goods 27.6 percent. The sales of telecommunication equipment increased by 27.5 percent. The growth of sales for cosmetics was 18.7 percent, for gold, silver and jewelry 42.1 percent, for traditional Chinese drugs and western drugs 21.5 percent, for electric and electronic appliances for household use and audio-video equipment 21.6 percent, for furniture 32.8 percent and building and decoration materials 30.1 percent.
VI. Foreign Economic Relations
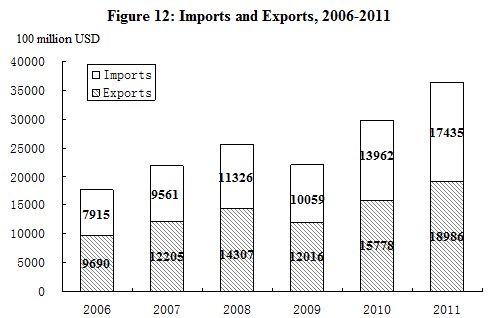
The total value of imports and exports in 2011 reached 3,642.1 billion US dollars, up by 22.5 percent over the previous year. Of this total, the value of goods export was 1,898.6 billion US dollars, increased by 20.3 percent, and the value of goods import was 1,743.5 billion US dollars, up by 24.9 percent. The balance of imports and exports was (exports minus imports) 155.1 billion US dollars, a decrease of 26.4 billion US dollars over the previous year.
Table 7: Total Value of Imports and Exports and the Growth Rates in 2011 Unit: 100 million USD Item Value Increase over 2010 (%) Total import and export of goods 36421 22.5 Exports 18986 20.3 Of which: General trade 9171 27.3 Processing trade 8354 12.9 Of which: Mechanical and electronic products 10856 16.3 High & new-tech products 5488 11.5 Of which: State-owned 2672 14.1 Foreign-funded 9953 15.4 Others 6360 32.2 Imports 17435 24.9 Of which: General trade 10075 31.0 Processing trade 4698 12.5 Of which: Mechanical and electronic products 7533 14.1 High & new-tech products 4630 12.2 Of which: State-owned 4934 27.1 Foreign-funded 8648 17.1 Others 3852 42.9 Trade surplus (exports minus imports) 1551 —
Item Volume Increase over 2010(%) Value (100 million USD) Increase over 2010 (%) Coal 10000 tons 1466 -23.0 27 20.6 Rolled steel 10000 tons 4888 14.9 513 39.2 Textile yarns and textile articles ---- — — 947 22.9 Clothes and clothing accessories ---- — — 1532 18.3 Footwear ---- — — 417 17.1 Furniture ---- — — 379 15.0 Automatic data processing machines and components 10000 sets 183427 10.1 1763 7.5 Handheld mobiles and car telephones 10000 sets 87509 15.5 628 34.3 Containers 10000 units 324 29.6 114 57.7 Liquid crystal display panels 10000 units 244141 8.5 295 11.5 Motor vehicles (including a complete set of spare sets) 10000 sets 82 52.2 99 60.5
Table 8: Main Export Commodities in Volume and Value
and the Growth Rates in 2011
Unit
Item Volume (10000 tons) Increase over 2010 (%) Value (100 million USD) Increase over 2010 (%) Cereals and cereal flour 545 -4.6 20 33.8 Soybean 5264 -3.9 298 18.9 Edible vegetable oil 657 -4.4 77 28.0 Iron ore 68608 10.9 1124 40.9 Aluminum oxide 188 -56.4 8 -48.1 Coal 18240 10.8 209 23.6 Crude oil 25378 6.0 1967 45.3 Petroleum products refined 4060 10.1 327 45.5 Plastics in primary forms 2304 -3.7 472 8.3 Paper pulp 1445 27.1 119 35.3 Rolled steel 1558 -5.2 216 7.3 Copper and copper alloys 407 -5.1 368 12.0
Table 9: Main Import Commodities in Volume and Value
and the Growth Rates in 2011
Unit: 100 million USD Country or region Exports Increase over 2010 (%) Imports Increase over 2010 (%) European Union 3560 14.4 2112 25.4 United States 3245 14.5 1222 19.6 Hong Kong, China 2680 22.8 155 26.4 ASEAN 1701 23.1 1928 24.6 Japan 1483 22.5 1946 10.1 Republic of Korea 829 20.6 1627 17.6 India 505 23.5 234 12.1 Russia 389 31.4 403 55.6 Taiwan, China 351 18.3 1249 7.9
Table 10: Imports and Exports by Major Countries and Regions
and the Growth Rates in 2011
The year 2011 witnessed the establishment of 27,712 enterprises with foreign direct investment in non-financial sectors, up by 1.1 percent over the previous year; and the foreign capital actually utilized was 116.0 billion US dollars, up by 9.7 percent.
Table 11: Total Value of Foreign Direct Investment in Non-financial Sectors and the Growth Rates in 2011 Sector Enterprises Increase over 2010 (%) Actually Utilized Value (100 million USD) Increase over 2010 (%) Total 27712 1.1 1160.1 9.7 Of which: Agriculture, Forestry, Animal Husbandry and Fishing 865 -6.9 20.1 5.1 Manufacturing 11114 0.6 521.0 5.1 Production and Supply of Electricity, Gas and Water 214 1.9 21.2 -0.3 Transport, Storage, Post and Telecommunication Services 413 4.3 31.9 42.2 Information Transmission, Computer Services and Software 993 -5.1 27.0 8.5 Wholesales & Retail Trade 7259 7.0 84.2 27.7 Real Estate 466 -32.4 268.8 12.1 Leasing and Business Services 3518 2.9 83.8 17.6 Services to Households and Other Services 212 -2.3 18.8 -8.2
In 2011, the accomplished business revenue through contracted overseas engineering projects was 103.4 billion US dollars, up by 12.2 percent, and the number of labor forces sent abroad through overseas labor contracts was 452 thousand, an increase of 41 thousand.
VII. Transportation, Post, Telecommunications and Tourism
In 2011, the total freight traffic reached 36.9 billion tons, up by 13.7 percent over the previous year, and the freight flows were 15,901.4 billion ton-kilometers, grew by 12.1 percent.
|
| |||
|
Item |
Unit |
Volume |
Increase over 2010 (%) |
|
|
|
|
|
|
Total freight traffic |
100 million tons |
368. 5 |
13.7 |
|
Railways |
100 million tons |
39.3 |
8.0 |
|
Highways |
100 million tons |
281.3 |
14.9 |
|
Waterways |
100 million tons |
42.3 |
11.7 |
|
Civil aviation |
10 000 tons |
552.8 |
-1.8 |
|
Pipelines |
100 million tons |
5.4 |
9.0 |
|
Freight flows |
100 million ton-kilometers |
159014.1 |
12.1 |
|
Railways |
100 million ton-kilometers |
29465.8 |
6.6 |
|
Highways |
100 million ton-kilometers |
51333.2 |
18.3 |
|
Waterways |
100 million ton-kilometers |
75196.2 |
9.9 |
|
Civil aviation |
100 million ton-kilometers |
171.7 |
-4.0 |
|
Pipelines |
100 million ton-kilometers |
2847.2 |
29.6 |
|
|
|
|
|
|
| |||
|
Item |
Unit |
Volume |
Increase over 2010 (%) |
|
|
|
|
|
|
Total passenger traffic |
100 million persons |
351.8 |
7.6 |
|
Railways |
100 million persons |
18.6 |
11.1 |
|
Highways |
100 million persons |
327.9 |
7.4 |
|
Waterways |
100 million persons |
2.4 |
8.6 |
|
Civil aviation |
100 million persons |
2.9 |
9.2 |
|
Passenger flows |
100 million person-kilometers |
30935.8 |
10.9 |
|
Railways |
100 million person-kilometers |
9612.3 |
9.7 |
|
Highways |
100 million person-kilometers |
16732.6 |
11.4 |
|
Waterways |
100 million person-kilometers |
74.2 |
2.6 |
|
Civil aviation |
100 million person-kilometers |
4516.7 |
11.8 |
|
|
|
|
|
The volume of freight handled by ports above the designated size throughout the year totaled 9.07 billion tons, up 11.9 percent over the previous year, of which freight for foreign trade was 2.75 billion tons, up 10.8 percent. Container shipping of ports above the designated size reached 162.31 million standard containers, up by 11.4 percent.
The total number of motor vehicles for civilian use reached 105.78 million (including 12.28 million tri-wheel motor vehicles and low-speed trucks) by the end of 2011, up 16.4 percent, of which private-owned vehicles numbered 78.72 million, up 20.4 percent. The total number of cars for civilian use stood at 49.62 million, up by 23.2 percent, of which private-owned cars numbered 43.22 million, up by 25.5 percent.
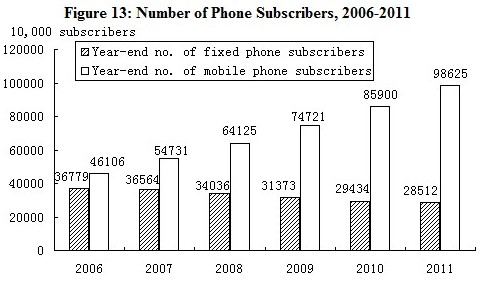
The turnover of post and telecommunication services[15] totaled 1,337.9 billion yuan, up 16.5 percent over the previous year. Of this total, post services accounted for 160.8 billion yuan, up 25.0 percent, and telecommunication services 1,177.2 billion yuan, up 15.5 percent. By the end of 2011, with a decrease of 30.70 million lines of office switchboards, the total capacity stood at 434.67 million lines. The newly increased capacity of mobile phone switchboard[16] was 204.06 million lines with the total capacity reaching 1,706.91 million lines. The year also saw 285.12 million fixed telephone subscribers. This included 191.10 million urban subscribers and 94.02 million rural subscribers. Mobile phone users numbered 986.25 million by the end of 2011, with 127.25 million new subscribers in the year. Of this total, the number of
The year 2011 saw 2.64 billion domestic tourists, up 13.2 percent over the previous year. The revenue from domestic tourism totaled 1,930.6 billion yuan, up 23.6 percent. The number of inbound visitors to China totaled 135.42 million, a year-on-year increase of 1.2 percent. Of this total, 27.11 million were foreigners, up 3.8 percent; and 108.31 million were Chinese compatriots from Hong Kong, Macao and Taiwan, up 0.6 percent. Of all the inbound tourists, overnight visitors counted 57.58 million, up 3.4 percent. Foreign exchange earnings from international tourism topped 48.5 billion US dollars, up 5.8 percent. The number of China’s outbound visitors totaled 70.25 million, up 22.4 percent. Of this total, 64.12 million were on private visits, a year-on-year rise of 24.5 percent, or 91.3 percent of all outgoing visitors.
VIII. Financial Intermediation
By the end of 2011, money supply of broad sense (M2) was 85.2 trillion yuan, reflecting a year-on-year increase of 13.6 percent. Money supply of narrow sense (M1) was 29.0 trillion yuan, up 7.9 percent. Cash in circulation (M0) was 5.1 trillion yuan, up 13.8 percent.
Savings deposit in Renminbi and foreign currencies in all items of financial institutions totaled 82.7 trillion yuan at the end of 2011, an increase of 9.9 trillion yuan. Of this total, the savings deposit in Renminbi stood at 80.9 trillion yuan, an increase of 9.6 trillion yuan. Loans in Renminbi and foreign currencies in all items of financial institutions reached 58.2 trillion yuan, an increase of 7.9 trillion yuan. Of this total, that in Renminbi was 54.8 trillion yuan, an increase of 7.5 trillion yuan. Table 14: Savings Deposit and Loans in RMB and Foreign Currencies in All Financial Institutions and the Growth Rates at the end of 2011 Unit: 100 million yuan Item Year-end figure Increase over 2010 (%) Savings deposit 826701 13.5 Of which: By households 351957 15.5 Of which: Deposits in RMB 348046 15.7 By non-financial enterprises 313981 9.5 Loans 581893 15.9 Of which: Domestic short-term loans 217480 21.8 Domestic medium and long-term loans 333747 11.8
Loans in Renminbi from rural financial cooperation institutions (i.e. rural credit cooperatives, rural cooperation banks, and rural commercial banks) totaled 6,677.8 billion yuan by the end of 2011, an increase of 1,001.2 billion yuan as compared with the beginning of 2011. The loans in Renminbi for consumption use from all financial institutions totaled 8,871.7 billion yuan, an increase of 1,480.3 billion yuan. Of all consumption loans, short-term loans for individuals totaled 1,355.5 billion yuan, an increase of 396.5 billion yuan, and medium- and long-term loans for individuals reached 7,516.2 billion yuan, an increase of 1,083.8 billion yuan.
Funds raised in 2011 by enterprises through issuing stocks and share rights on stock market amounted to 678.0 billion yuan, a decrease of 349.5 billion yuan from the previous year. Of this total,
In 2011, corporate funds raised by the non-listed companies reached 348.5 billion yuan, a decrease of 14.2 billion yuan over that in the previous year. The short-term financing funds of enterprises were 802.9 billion yuan, an increase of 128.7 billion yuan; and the medium-term notes were 727.0 billion yuan, an increase of 234.6 billion yuan.
The premium[18] received by the insurance companies totaled 1,433.9 billion yuan in 2011, up[19] 10.5 percent over the previous year. Of this total, life insurance premium amounted to 869.6 billion yuan, health and casualty insurance premium 102.5 billion yuan, and property insurance premium 461.8 billion yuan. Insurance companies paid an indemnity worth of 392.9 billion yuan, of which, life insurance indemnity was 130.1 billion yuan, health and casualty insurance indemnity 44.1 billion yuan, and property insurance indemnity 218.7 billion yuan.
IX. Education, Science & Technology and Culture
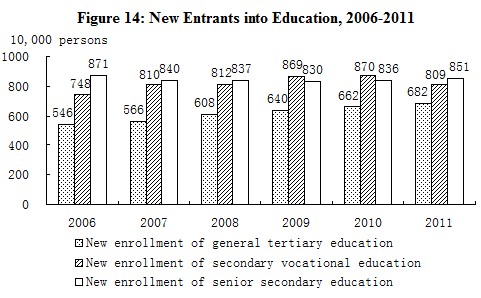
In 2011, the post-graduate education enrollment was 1.646 million students with 560 thousand new students and 430 thousand graduates. The general tertiary education enrollment was 23.085 million students with 6.815 million new students and 6.082 million graduates. Vocational secondary schools of various types had 21.966 million enrolled students, including 8.089 million new entrants, and 6.627 million graduates. Senior secondary schools had 24.548 million enrolled students, including 8.508 million new entrants, and 7.877 million graduates. Students enrolled in junior secondary schools totaled 50.668 million, including 16.347 million new entrants, and 17.367 million graduates. The country had a primary education enrollment of 99.264 million students, including 17.368 million new entrants, and 16.628 million graduates. There were 399 thousand students enrolled in special education schools, with 64 thousand new entrants and 44 thousand graduates. Kindergartens accommodated 34.244 million children.
The amount of expenditures on research and development activities (R&D) was worth 861.0 billion yuan in 2011, up 21.9 percent over 2010, accounting for 1.83 percent of GDP. Of this total, 39.6 billion yuan was appropriated for fundamental research programs. A total number of 952 projects under the National Key Technology Research and Development Program and 524 projects under the Hi-tech Research and Development Program (the 863 Program) were implemented. The year 2011 saw a total of 130 national engineering research centers, 119 national engineering laboratories, 101 national and local joint engineering research centers and 116 national and local joint engineering laboratories. The number of state validated enterprise technical centers reached 793 by the end of the year. The technical centers at the provincial level numbered 6,824. Venture capital investment plan had been implemented to boost new emerging industries, with accumulatively 61 venture investment enterprises being supported to be established and 108 venture businesses being invested. Some 1,633 thousand patent applications were accepted from home and abroad, of which 1,479 thousand were domestic applications, accounting for 90.5 percent of the total. A total number of 526 thousand patent applications for new inventions were accepted, of which 404 thousand were from domestic applicants or 76.7 percent of the total. A total of 961 thousand patents were authorized in 2011, of which 864 thousand were domestic patents, accounting for 89.9 percent of the total. A total of 172 thousand patents for new inventions were authorized, of which 106 thousand were domestic ones, accounting for 61.5 percent. Till the end of year 2011, the number of patents in force was 2.740 million, of which 2.202 million patents were domestic ones, accounting for 80.4 percent; the number of patents in force for inventions was 697 thousand, of which 318 thousand were domestic ones, accounting for 45.7 percent. A total of 256 thousand technology transfer contracts were signed, representing 476.36 billion yuan in value, up 21.9 percent over the previous year. The year 2011 saw 19 times of successful launch of satellites. Tiangong-1 Target Spacecraft and Shenzhou VIII Spacecraft were launched successfully and completed space rendezvous and docking mission in 2011. The manned submersible Jiaolong successfully completed the 5,000 meters sea trial test.
By the end of 2011, there were altogether 25,669 laboratories for product inspection, including 476 national inspection centers. There were 174 organizations for product certification and management system certification, which accumulatively certified products in 83,549 enterprises. A total of 3,740 authorized measurement institutions enforced compulsory inspection on 61.79 million measurement instruments in the year. A total of 1,993 national standards were developed or revised in the year, including 1,559 new standards. There were 4,034 weather warning signals sent by national and provincial meteorological stations, and 4,337 weather alerts. There were 1,480 seismological monitor stations and 32 seismological monitor network stations. The numbers of oceanic observation stations were 74. Mapping and geographic information departments published 2,103 maps.
At the end of 2011, there were 2,481 art-performing groups, 2,571 museums, 2,925 public libraries, 3,276 culture centers, 197 radio broadcasting stations, 213 television stations, 2,153 radio broadcasting and television stations and 44 educational television stations in the cultural system throughout China. Subscribers to cable television programs numbered 201.52 million. Subscribers to digital cable television programs were 114.55 million. Radio broadcasting and television broadcasting coverage rates were 97.1 percent and 97.8 percent respectively. Totally 14,939 episodes of 469 TV series and 261,444 minutes of animated TV series were made in 2011. The country produced 558 feature movies and 131 science, educational, documentary, cartoon and special movies[20]. A total of 46.7 billion copies of newspapers and 3.3 billion copies of magazines were issued, and 7.7 billion copies of books were published. By the end of the year, there were 4,107 archives in China and 103.76 million documents were made accessible to the public.
In 2011, Chinese athletes won 138 world championships on 24 sports events. Four athletes and 1 team broke 8 world records on 8 occasions.
X. Public Health and Social Services
By the end of 2011, there were 953,432 medical and health institutions in China, including 21,638 general hospitals, 37,374 township health centers, 32,812 community health service centers, 177,754 clinics, 659,596 village clinics, 3,499 epidemic disease prevention centers and 3,005 health monitoring institutions. There were 6.20 million health workers in China, including 2.51 million practicing doctors and assistant practicing doctors and 2.24 million registered nurses. The medical and health institutions in China possessed 5.15 million beds, of which, general hospitals possessed 3.68 million and township health centers had 1.03 million. In 2011, 3.238 million people were infected by A or B class infectious diseases, with 15,264 reported deaths. The incidence of infectious disease was 241.44 per 100 thousand, with the death rate standing at 1.14 per 100 thousand.
By the end of 2011, there were all together 45 thousand social welfare institutions[21] of various types providing 3.672 million beds, accommodating 2,796 thousand inmates. Of this total, 32 thousand were rural elder-caring organizations providing 2.326 million beds, accommodating 1,828 thousand inmates. There were 148 thousand community service facilities, of which there were 14 thousand community service centers and 49 thousand community service stations. By the end of 2011, a total of 22.768 million urban residents received the government minimum living allowances, 337 thousand less than the previous year. About 53.135 million rural residents received the government minimum living allowance, an increase of 995 thousand and 5.520 million rural residents received government five-guarantees relief[22], a drop of 43 thousand. Medial aid was provided to 7,114 thousand needy people in cities and 15,581 thousand needy people in rural areas. Another 12.765 million needy people in urban areas were financed to participate in urban medical insurance system, and 45.443 million needy people in rural areas were financed to participate in new type of rural cooperative medical care system.
By the end of 2011, the total number of Chinese population at the mainland reached 1,347.35 million, an increase of 6.44 million over that at the end of 2010. Of this total, urban population numbered 690.79 million, accounting for 51.3 percent, the first time for the proportion to exceed 50 percent. The year 2011 saw 16.04 million births, a crude birth rate of 11.93 per thousand, and 9.60 million deaths, or a crude death rate of 7.14 per thousand. The natural growth rate was 4.79 per thousand. The sex ratio at birth was 117.78. The number of population that are separated from their household registration[23] reached 271 million, of which 230 million were floating population[24].
|
Table 15: Population and Its Composition by the end of 2011 Unit: 10,000 persons | ||
|
Item |
Population |
Proportion (%) |
|
|
|
|
|
National Total |
134735 |
100.0 |
|
Of which: Urban |
69079 |
51.3 |
|
Rural |
65656 |
48.7 |
|
Of which: Male |
69068 |
51.3 |
|
Female |
65667 |
48.7 |
|
Of which: Aged 0-14 |
22164 |
16.5 |
|
Aged 15-59 |
94072 |
69.8 |
|
Aged 60 and over |
18499 |
13.7 |
|
Of which: Aged 65 and over |
12288 |
9.1 |
|
|
|
|
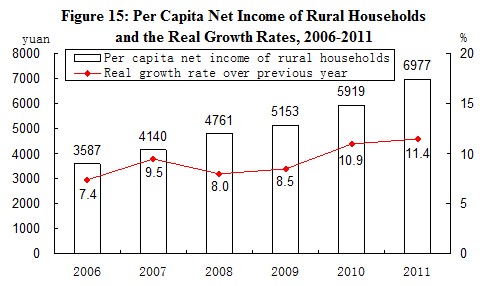
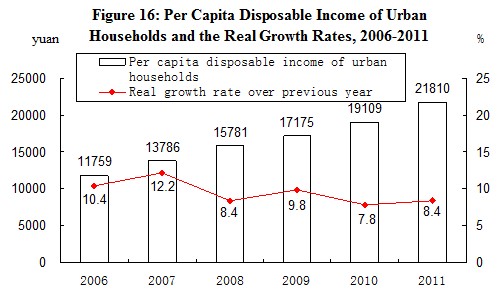
In 2011, the annual per capita net income of rural households was 6,977 yuan, up by 17.9 percent, or a real increase of 11.4 percent over the previous year when the factors of price increase were deducted. The median of per capita net income[25] of rural households was 6,194 yuan, up by 19.1 percent. The annual per capita disposable income of urban households was 21,810 yuan, up by 14.1 percent, or a real increase of 8.4 percent. The median of per capita disposable income of urban households was 19,118 yuan, up by 13.5 percent. The proportion of expenditure on food to the total expenditure of households was 40.4 percent for rural households and 36.3 percent for urban households.
At the end of 2011, a total of 283.92 million people participated in basic pension program, a year-on-year increase of 26.85 million. Of this total, 215.74 million were staff and workers, and 68.19 million were retirees. A total of 472.91 million people participated in urban basic health insurance program, an increase of 40.28 million, of whom 252.26 million people participated in urban basic health insurance program for staff and workers[26], and 220.66 million people participated in programs for residents. A total of 46.41 million people participated in urban basic health insurance programs were migrant workers coming from the rural areas, an increase of 580 thousand. Some 143.17 million people participated in unemployment insurance programs, an increase of 9.41 million. A total of 176.89 million people participated in work accident insurance, an increase of 15.28 million, of which 68.37 million were migrant workers coming from the rural areas, an increase of 5.37 million. A total of 138.80 million people participated in maternity insurance programs, an increase of 15.44 million. By the end of September 2011, a total of 2,646 counties (cities, districts) conducted the new cooperative medical care system in rural areas, with a participation rate of 97.5 percent. The total expenditure of the new cooperative medical care system in rural areas reached 111.4 billion yuan, benefiting 840 million people. In the pilot areas of new rural social pension insurance, some 326.43 million people participated in insurance program. The number of people receiving unemployment insurance payment stood at 1.97 million. In 2011, the government raised the rural poverty line to annual per capita net income of 2,300 yuan (2010 constant prices). According to the new standard, the population who need support in rural areas numbered 122.38 million at the end of the year.
XII. Resources, Environment and Work Safety
In 2011, the total supply of state-owned land for construction[27] use was 588 thousand hectares, a growth of 37.2 percent over the previous year. Of this total, that for mining storage, 193 thousand hectares, up 26.2 percent, for real estate[28], 167 thousand hectares, up 9.2 percent, and for infrastructure facilities, 228 thousand hectares, up 86.1 percent.
The total stock of water resources in 2011 was 2,402.2 billion cubic meters. The annual average precipitation was 567 millimeters. At the end of 2011, 422 large reservoirs in China stored 195.6 billion cubic meters of water, or 6.9 billion cubic meters less than that at the end of 2010. Total water consumption went up by 1.0 percent to reach 608.0 billion cubic meters, of which water consumption for living purposes rose by 2.5 percent, for industrial use grew by 0.9 percent, for agricultural use increased by 0.8 percent, and for ecological water supplement dropped by 4.0 percent. Water consumption for every 10 thousand yuan worth of GDP produced[29] was 139 cubic meters, a decline of 7.3 percent. Water consumption for every 10 thousand yuan worth of industrial value added was 82 cubic meters, down by 8.9 percent. Per capita water consumption was 452 cubic meters, up by 0.4 percent.
In 2011, a total of 6.14 million hectares of forest were planted, of which 4.14 million were afforested by manpower. Some 3.11 million hectares were afforested through key afforestation projects, accounting for 50.7 percent of the total planted area of the year. By the end of 2011, there were 2,640 natural reserves including 335 national ones. A total of 39 thousand square kilometers of eroded land were put under comprehensive treatment programs, and 28 thousand square kilometers of land were closed for nurture and protection in areas suffering water and soil erosion. By the end of 2011, the total forest areas with set ownership were 173.33 million hectares, of this total, 151.00 million hectares obtained the forest ownership certifications.
The average temperature in 2011 was 9.3℃. Typhoon hit China 7 times in 2011.
Preliminary estimation indicated that the total energy consumption in 2011 amounted to 3.48 billion tons of standard coal equivalent, up 7.0 percent over 2010. The consumption of coal grew by 9.7 percent; crude oil, up 2.7 percent; natural gas, up 12.0 percent; and electric power, up 11.7 percent. The national energy consumption per 10,000 yuan worth of GDP went down by 2.01 percent. The consumption of major kinds of raw materials[30] included 840 million tons of rolled steel, up 9.0 percent; 7.86 million tons of copper, up by 5.2 percent; 17.24 million tons of electrolytic aluminum, up by 12.1 percent; 15.28 million tons of ethylene, up by 7.5 percent; and 2.07 billion tons of cement, up 11.2 percent.
Monitoring of water quality on 398 sections of the 7 major water systems in China showed that 56.3 percent of the sections met the national quality standard from Grade I to Grade III for surface water, up by 0.3 percentage point over the previous year; and 15.3 percent were worse than Grade V, down by 2.0 percentage points compared with that in the previous year. Generally, the water quality in the 7 major water systems kept stable.
Monitoring of oceanic water quality at 301 offshore monitoring stations indicated that oceanic water met the national quality standard Grade I and II in 62.8 percent of the stations; water quality at 12.0 percent of the stations met Grade III standard; and water of Grade IV or inferior quality was found at 25.2 percent of the stations.
In the 330 cities covered by air quality monitoring program, 293 cities reached or topped air quality standard Grade II, accounting for 88.8 percent of all cities under the program; 33 cities attained Grade III, accounting for 10.0 percent; and air quality in 4 cities was inferior to Grade III, accounting for 1.2 percent. Of the 316 cities subject to noise monitoring program, 5.1 percent enjoyed fairly good environment, 72.8 percent had good environment, 21.5 percent had light noise pollution, and 0.6 percent experienced medium noise pollution in downtown areas.
At the end of 2011, the daily treatment capacity of city sewage reached 112.55 million cubic meters, up 7.8 percent over that in 2010. City sewage treatment rate was 82.6 percent, up 0.3 percentage point. The floor space with central heating systems amounted to 4.56 billion square meters, up 4.6 percent. Greenery coverage reached 34.7 percent of the urban area, up 0.2 percentage point.
In 2011, natural disasters caused 309.6 billion yuan worth of direct economic loss, down by 42.0 percent compared with that in the previous year. Natural disasters hit 32.47 million hectares of crops, down by 13.2 percent, of which 2.89 million hectares of crops were demolished, down by 40.5 percent. Flood and waterlog, landslide and debris flow caused a direct economic loss of 126.0 billion yuan, a drop of 64.0 percent. Drought caused a direct economic loss of 92.8 billion yuan, up by 22.6 percent. Disasters from low temperature, frost and snow made a total direct economic loss of 29.0 billion yuan, down by 8.9 percent. Oceanic disasters caused a direct economic loss of 6.05 billion yuan, down by 54.4 percent. The occurrence of red tides hit an accumulative area of 1,145 square kilometers, down by 89.5 percent. The country recorded 17 earthquakes with magnitude 5 and over, 15 of which caused disasters, causing a direct economic loss of 6.01 billion yuan. The year 2011 witnessed 5,550 forest fires, down by 28.1 percent.
The death toll due to work accidents amounted to 75,572 people, a year-on-year decrease of 5.0 percent. The death toll from work accidents every 100 million yuan worth of GDP was 0.173 people, a decline of 13.9 percent. Work accidents in industrial, mining and commercial enterprises caused 1.88 deaths out of every 100 thousand employees, down 11.7 percent. The road traffic death toll per 10 thousand vehicles was 2.8 persons, down 12.5 percent. The death toll for producing one million tons of coal in coalmines was 0.564 persons, down 24.7 percent.
Notes:
1. All figures in this Communiqué are preliminary statistics. Statistics in this Communiqué do not include Hong Kong SAR, Macao SAR and Taiwan Province. Due to the rounding-off reasons, the subentries may not add up to the aggregate totals.
2. Gross domestic product (GDP) and value added as quoted in this Communiqué are calculated at current prices, whereas their growth rates are at constant prices.
3. The producer prices for farm products refer to the prices of farm products sold directly by producers.
4. The number of migrant workers includes those who obtain employment outside their villages and towns for more than six months in the year and those who do non-agricultural work in their villages and towns for more than six months in the year.
5. Public revenue refers to the revenue with taxes as the main body which was collected by the government as social manager by virtue of state political rights. It is the same as fiscal revenue which was quoted in previous years.
6. In the figure, the public revenue from 2006 to 2010 was final accounts, and the revenue of 2011 was executive accounts.
7. From 2011, the cut-off size of industrial enterprises above designated size raised from an annual revenue from primary activities above 5 million yuan to 20 million yuan
8. Six highly energy-consuming industries are: manufacture of raw chemical materials and chemical products, manufacture of non-metallic mineral products, smelting and pressing of ferrous metals, smelting and pressing of non-ferrous metals, oil processing, coking and nuclear fuel processing, and production and supply of electricity and heat.
9. Output and consumption of rolled steel include duplicated counting of rolled steel as intermediate inputs used for producing other types of rolled steel.
10. From 2011, the cut-off size of fixed assets investment projects rose from a total planned investment above 500 thousand yuan to 5 million yuan, thus the completed investment in fixed assets of the country in 2011 is incomparable with that in 2010, but the growth rates over previous years are calculated on a comparable basis. Meantime, the monthly statistical system of fixed assets investment expanded the coverage from urban areas to rural enterprises and institutions, and defined it as the investment in fixed assets (excluding rural households).
11. The national total of fixed assets investment is larger than the aggregate sum by adding up the subtotals of fixed assets investment in the eastern areas, central areas, western areas and northeast areas due to the fact that some of the trans-regional investments are not covered by regional figures. The eastern areas include 10 provinces and municipalities: Beijing, Tianjin, Hebei, Shanghai, Jiangsu, Zhejiang, Fujian, Shandong, Guangdong and Hainan; central areas cover 6 provinces: Shanxi, Anhui, Jiangxi, Henan, Hubei and Hunan; western areas include 12 provinces, autonomous regions and municipality: Inner Mongolia, Guangxi, Chongqing, Sichuan, Guizhou, Yunnan, Tibet, Shaanxi, Gansu, Qinghai, Ningxia and Xinjiang; northeastern areas include 3 provinces: Liaoning, Jilin and Heilongjiang.
12. The investment in real estate includes the investment made in real estate development, construction of buildings for own use, property management, intermediary services and other real estate development.
13. High-speed railways refer to railways with a highest operating speed reaching
14. From 2010, new grouping method is adopted for the statistics on the total retail sales of consumer goods: grouping according to operation location changes from city, county and below county level to urban and rural areas; grouping according to industries is cancelled and new grouping according to retail sales of commodities and earnings of catering is added.
15. The turnover of post and telecommunication services in 2011 is calculated at constant prices of 2010, while that from 2001 to 2010 are calculated at 2000 constant prices. Therefore, the volume of 2011 cannot be compared with that of 2010, but the growth rate over previous year is calculated on a comparable basis.
16. The capacity of mobile phone switchboard refers to the number of maximum concurrent users calculated by the mobile phone switchboard according to certain calling model and switchboard processing capacity.
17.
18. The original premium income received by the insurance companies refers to the premium income from original insurance contracts confirmed by the insurance companies.
19. The growth rate of original premium income is calculated according to the Interpretation No.2 to the Accounting Standards for Enterprises which started its full scale operation in 2011.
20. Special movies refer to those using different display modes in terms of projection techniques, equipment and program as compared with the ordinary cinemas, such as IMAX movies, 3D movies, 4D movies, multidimensional movies and fulldome movies.
21. Social service institutions with accommodation include adoption agencies as well as aid agencies, community agencies, military sanatoriums, military supply stations and etc.
22. Five-guarantees relief in rural areas refers to villagers who are aged, disabled or under the age of 16 and have no ability to work, no source of income and no statutory obligors to provide for them, bring them up or support them, or whose statutory obligors have no ability to provide for them, bring them up or support them, shall enjoy life-care and physical care in terms of food, clothing, housing, medical care and funeral expenses.
23. Population live in places other than their household registration refer to those whose current residences are different from the registered towns or streets which they have left for more than half a year.
24. Floating population refer to the population who live in places other than their household registration, excluding those with current residence different from the place of their household registration in the same city. Population live in places other than their household registration in the same city refer to those whose current residence are different from the registered towns or streets in the same district or in different districts in the same municipality or prefecture-level city.
25. The median of per capita income refers to the per capita income of household lied in the middle of all surveyed households which are ranked from low to high based on per capital income level.
26. The number of people covered in urban basic health insurance programs for staff and workers include staff and workers and retirees insured. The urban basic health insurance programs for residents cover the urban non-employed residents who are not insured by the urban basic health insurance programs for staff and workers.
27. Total supply of state-owned land for construction use refers to the supply of state-owned land for construction use with the land-used right sold, allocated or leased to units or individuals by the municipal or county governments according to annual land supply plan and in line with relevant laws in the reporting period.
28. Land used for real estate refers to the sum of land used for commercial service and for residence.
29. The consumption of water and energy for producing 10 thousand yuan worth of GDP and water consumption for every 10 thousand yuan worth of industrial value added are calculated at 2010 constant prices, while that of 2006 to 2010 are calculated at 2005 constant prices. Therefore, the volume of 2011 could not be compared with that of 2010, but the growth rate over previous year is calculated on a comparable basis.
30. The consumption of major kinds of raw materials is the apparent consumption, i.e. the output plus net imports (imports-exports); inventory change is not included.
Data Sources:
In this communiqué, data of newly increased employed people, unemployment rate through unemployment registration and social security are from the Ministry of Human Resources and Social Security; data of foreign exchange reserves and exchange rate are from the State Administration of Foreign Exchange; financial data are from the Ministry of Finance; data of output of aquatic products are from the Ministry of Agriculture; data of production of timber, forestry and forest fires are from the State Forestry Administration; data of areas with effective irrigation system and water resources are from the Ministry of Water Resources; data of newly increased power generating capacity and newly increased power transformer equipment with a capacity of over 220 kilovolts are from China Electricity Council; data of new railways put into operation, double-track railways put into operation, electrified railways put into cooperation and railway transportation are from the Ministry of Railways; data of new highways, new cargo-handling capacity of berths for over 10000-tonnage ships, highway transportation, waterway transportation and volume of freight handled by ports are from the Ministry of Transport; data of new lines of optical-fiber cables, new capacity of digital cellular mobile phone switchboards, the number of phone users and internet users etc. are from the Ministry of Industry and Information Technology; data of indemnificatory housing, treatment of city sewage, area with central heating systems and greenery coverage are from the Ministry of Housing and Urban-Rural Development; data of imports and exports of goods are from the General Administration of Customs; data of foreign direct investment, overseas direct investment, overseas contracted projects and overseas labor contracts are from the Ministry of Commerce; data of civil aviation are from the General Administration of Civil Aviation; data of pipelines are from China National Petroleum Corporation and China Petrochemical Corporation; data of motor vehicles for civilian use are from the Ministry of Public Security; data of post services are from the State Post Bureau; data of tourism are from the National Tourism Administration and the Ministry of Public Security; data of money and finance are from the People’s Bank of China; data of listed companies are from the China Securities Regulatory Commission; data of corporate funds, national engineering research centers, enterprise technical centers and venture capital investment for boosting new emerging industries are from the National Development and Reform Commission; data of insurances are from China Insurance Regulatory Commission; data of education are from the Ministry of Education; data of national technology research and development program and technology transfer contracts are from the Ministry of Science and Technology; data of patents are from the State Intellectual Property Office; data of satellite launch are from the State Administration of Science, Technology and Industry for National Defense; data of quality inspection, development and revision of national standards are from the General Administration of Quality Supervision, Inspection and Quarantine; data of weather warning, average temperature and typhoon are from the China Meteorological Administration; data of earthquakes are from the China Seismological Bureau; data of mapping are from the State Bureau of Surveying and Mapping; data of oceanic observation stations, direct economic loss caused by oceanic disasters and occurrence area of red tides are from the State Oceanic Administration; data of art-performing groups, museums, public libraries and culture centers are from the Ministry of Culture; data of radio, television and movies are from the Administration of Radio, Film and Television; data of newspapers, magazines and books are from the General Administration of Press and Publication; data of documents are from the State Archives Administration; data of sports are from the General Administration of Sport; data of health and new cooperative medical care system in rural areas are from the Ministry of Health; data of social services, minimum living allowances, five-guarantees relief, direct economic loss caused by natural disasters, areas of crops hit by natural disasters, direct economic loss and death roll caused by flood and waterlog, landslide and debris flow, direct economic loss caused by drought, direct economic loss and death roll caused by low temperature, frost and snow are from the Ministry of Civil Affairs; data of supply of state-owned land for construction use are from the Ministry of Land and Resources; data of environment monitoring are from the Ministry of Environmental Protection; data of work safety are from the State Administration of Work Safety; all the other data are from the National Bureau of Statistics.
In case of any discrepancy between English translation and the original Chinese text, the Chinese edition shall prevail.