Statistical Communiqué of the People's Republic of China on the 2012 National Economic and Social Development
Statistical Communiqué of the People's Republic of China on the 2012 National Economic and Social Development[1]
National Bureau of Statistics of China
February 22, 2013
In 2012, faced with the complicated and severe international situation and arduous tasks of domestic reform, development and stability, under the firm leadership of the CPC Central Committee and the State Council, the people of all nationalities of China, taking the scientific development as the theme and the transformation of economic development mode as the mainline, following the general tone of making progress while ensuring the stability, carried out the package of plans and policies aiming at strengthening and improving the macro control. As a result, national economic performance maintained steady development, all social undertakings achieved new progress, and a good foundation was laid for the comprehensive construction of a well-off society.
I. General Outlook
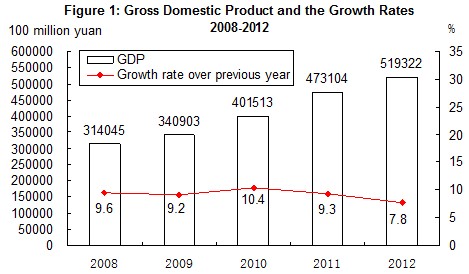
In 2012, the gross domestic product (GDP)[2] of the year was 51,932.2 billion yuan, up by 7.8 percent over the previous year. Of this total, the value added of the primary industry was 5,237.7 billion yuan, up by 4.5 percent, that of the secondary industry was 23,531.9 billion yuan, up by 8.1 percent and the tertiary industry was 23,162.6 billion yuan, up by 8.1 percent. The value added of the primary industry accounted for 10.1 percent of the GDP, that of the secondary industry accounted for 45.3 percent, and that of the tertiary industry accounted for 44.6 percent.
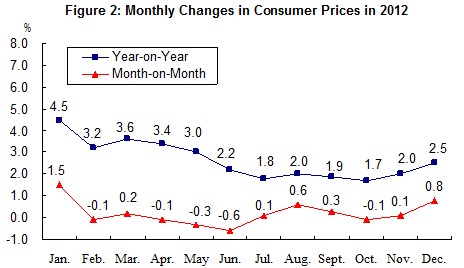
The consumer price in 2012 went up by 2.6 percent over the previous year. Of this total, the prices for food went up by 4.8 percent. The prices for investment in fixed assets increased by 1.1 percent. The producer prices and the purchasing prices for manufactured goods were down by 1.7 percent and 1.8 percent respectively. The producer prices for farm products[3] were up by 2.7 percent.
Item National Average Rural General level of consumer prices 2.6 2.7 2.5 Food 4.8 5.1 4.0 Tobacco, liquor and articles 2.9 2.9 2.7 Clothing 3.1 2.9 3.8 Household appliances and maintaining services 1.9 2.1 1.5 Medical, health and personal articles 2.0 2.0 2.1 Transportation and telecommunications -0.1 -0.3 0.6 Recreation, education, culture articles and services 0.5 0.4 1.0 Housing 2.1 2.2 1.9
Table 1: General Level of Consumer Prices in 2012
Unit: %
Urban
The number of cities among 70 large and medium-sized cities showing the rise of monthly sales prices (month-on-month) for new commercial residential buildings was 54 at the end of the 2012.

At the end of year 2012, the number of employed people in China was 767.04 million, and that in urban areas was 371.02 million. The newly increased employed people in urban areas numbered 12.66 million. The urban unemployment rate through unemployment registration was 4.1 percent at the year end, maintaining the same level as 2011. The total migrant workers[4] in 2012 were 262.61 million, up by 3.9 percent over that of 2011. Of which, the migrant workers left hometown and worked in other provinces were 163.36 million, increased by 3.0 percent, the migrant workers worked in local provinces reached 99.25 million, up by 5.4 percent.

At the end of 2012, China’s foreign exchange reserves reached 3,311.6 billion US dollars, an increase of 130.4 billion US dollars as compared with that at the end of the previous year. At the end of the year, the exchange rate was 6.2855 RMB to 1 USD, an appreciation by 0.25 percent over that at the end of 2011.

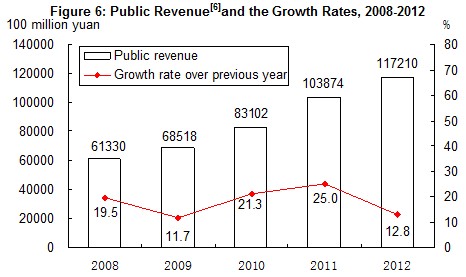
In 2012, the total public revenue[5] reached 11,721.0 billion yuan, up by 12.8 percent or an increase of 1,333.5 billion yuan over that in the previous year. Of this total, the taxes collected in the whole year reached 10,060.1 billion yuan, up by 12.1 percent or an increase of 1,086.2 billion yuan over 2011.
II. Agriculture
In 2012, the sown area of grain was 111.27 million hectares, an increase of 690 thousand hectares compared with that in the previous year; the sown area of cotton was 4.70 million hectares, a decrease of 340 thousand hectares; the sown area of oil-bearing crops was 13.98 million hectares, an increase of 120 thousand hectares; the sown area of sugar crops was 2.03 million hectares, an increase of 90 thousand hectares.
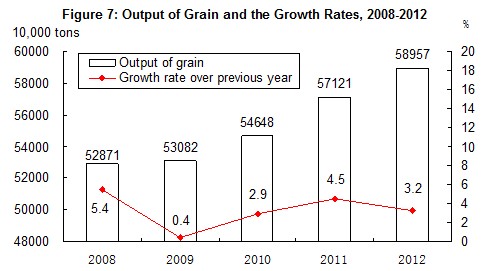
The total output of grain in 2012 was 589.57 million tons, an increase of 18.36 million tons or up by 3.2 percent over the previous year. Of this total, the output of summer crops was 129.95 million tons, increased by 2.8 percent, and that of the early rice was 33.29 million tons, increased by 1.6 percent over the previous year. The output of autumn grain was 426.33 million tons, an increase of 3.5 percent. Among the main grain crops, the output of rice was 204.29 million tons, up by 1.6 percent; that of wheat was 120.58 million tons, up by 2.7 percent; and that of corn was 208.12 million tons, a rise of 8.0 percent.
In 2012, the output of cotton was 6.84 million tons, an increase of 3.8 percent over the previous year, that of oil-bearing crops was 34.76 million tons, up by 5.1 percent and that of sugar crops was 134.93 million tons, an increase of 7.8 percent, that of tobacco was 3.20 million tons, up by 11.5 percent, and that of tea was 1.80 million tons, up by 11.2 percent.
The total output of meat for the year reached 83.84 million tons, up by 5.4 percent over the previous year. Of this total, the output of pork was 53.35 million tons, up by 5.6 percent; that of beef was 6.62 million tons, increased by 2.3 percent; and that of mutton and poultry was 4.01 and 18.23 million tons, increased by 2.0 percent and 6.7 percent respectively. At the end of the year, 474.92 million pigs were registered in the total stocks, up by 1.6 percent, and 696.28 million pigs were slaughtered, up by 5.2 percent. The total output of eggs was 28.61 million tons, up by 1.8 percent. The production of milk was 37.44 million tons, up by 2.3 percent.
The total output of aquatic products was 59.06 million tons, up by 5.4 percent. Of this total, the output of cultured aquatic products was 43.05 million tons, up by 7.0 percent; and that of fished aquatic products was 16.01 million tons, up by 1.3 percent over the previous year.
The total production of timber for the year 2012 reached 80.88 million cubic meters, a drop of 0.7 percent.
Over 1.72 million hectares of farmland was increased with effective irrigation systems and another additional 2.35 million hectares of farmland was guaranteed by water-saving irrigation systems.
III. Industry and Construction
In 2012, the total value added of the industrial sector was 19,986.0 billion yuan, up by 7.9 percent over the previous year. The value added of industrial enterprises above the designated size increased by 10.0 percent. Of the industrial enterprises above the designated size, the value added of the state-owned and state-holding enterprises grew by 6.4 percent, that of the collective enterprises went up by 7.1 percent, that of the share-holding enterprises increased by 11.8 percent, that of the enterprises by foreign investors and investors from Hong Kong, Macao and Taiwan soared by 6.3 percent and 14.6 percent growth for private enterprises. The growth of the light industry was 10.1 percent and that of the heavy industry was 9.9 percent.
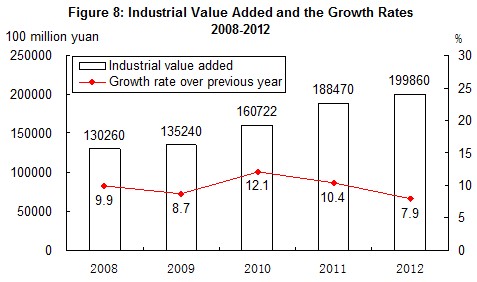
In 2012, of the industrial enterprises above designated size[7], the growth of value added for processing of food from agricultural products was 13.6 percent over the previous year; for textile industry was 12.2 percent; for manufacture of general machinery 8.4 percent; for manufacture of special purpose machinery 8.9 percent; for manufacture of automobiles 8.4 percent; for manufacture of communication equipment, computers and other electronic equipment 12.1 percent and for manufacture of electrical machinery and equipment 9.7 percent. The growth of the value added for the major six high energy consuming industries[8] was 9.5 percent, of which, that of the manufacture of non-metallic mineral products was 11.2 percent, manufacture of raw chemical materials and chemical products 11.7 percent, smelting and pressing of non-ferrous metals 13.2 percent, smelting and pressing of ferrous metals 9.5 percent, production and supply of electric power and heat power 5.0 percent and 6.3 percent for processing of petroleum, coking, processing of nuclear fuel. The value added growth for the high-tech industry was 12.2 percent over the previous year.
Table 2: Output of Major Industrial Products Product Unit Output Increase over 2011 (%) Yarn 10000 tons 2984.0 9.8 Cloth 100 million meters 840.8 3.3 Chemical fibers 10000 tons 3800.0 12.1 Sugar (final product) 10000 tons 1406.8 18.5 Cigarettes 100 million 25160.9 2.8 Color TV sets 10000 12823.3 4.8 Of which: LCD TV sets 10000 11418.3 10.9 Household refrigerators 10000 8427.0 -3.1 Room air conditioners 10000 13281.1 -4.5 Total primary energy production 100 million tons of standard coal equivalent 33.3 4.8 Coal 100 million tons 36.5 3.8 Crude oil 100 million tons 2.07 2.3 Natural gas 100 million cubic meters 1072.2 4.4 Electricity 100 million kilowatt-hours 49377.7 4.8 Of which: Thermal-power 100 million kilowatt-hours 38554.5 0.6 Hydro-power 100 million kilowatt-hours 8608.5 23.2 Nuclear-power 100 million kilowatt-hours 973.9 12.8 Crude steel 10000 tons 71716.0 4.7 Rolled steel[9] 10000 tons 95317.6 7.6 Ten kinds of nonferrous metals 10000 tons 3672.2 6.9 Of which: Refined copper (copper) 10000 tons 574.0 9.5 Aluminum electrolyze 10000 tons 1985.8 12.3 Aluminum oxide 10000 tons 3769.6 10.3 Cement 100 million tons 22.1 5.3 Sulfuric acid 10000 tons 7686.3 2.7 Soda ash 10000 tons 2408.8 5.0 Caustic soda 10000 tons 2696.1 9.0 Ethylene 10000 tons 1486.8 -2.7 Chemical fertilizers (100 percent equivalent) 10000 tons 7296.0 10.1 Power-generating equipment 10000 kilowatts 13005.6 -9.7 Motor vehicles 10000 1927.7 4.7 Of which: Basic passenger cars (cars) 10000 1077.1 6.4 Large & medium tractors 10000 46.3 15.3 Integrated circuits 100 million pieces 823.1 14.4 Program-controlled switchboards 10000 lines 2826.3 -6.8 Mobile telephones 10000 118154.3 4.3 Micro-computers 10000 35411.0 10.5
and the Growth Rates in 2012
The profits made by the industrial enterprises above the designated size in 2012 were 5,557.8 billion yuan, an increase of 5.3 percent over the same period of last year. Of this total, the profits of the state-owned and state-holding enterprises were 1,416.3 billion yuan, down by 5.1 percent; that of the collective enterprises were 81.9 billion yuan, up by 7.5 percent; that of the share-holding enterprises 3,286.7 billion yuan, up by 7.2 percent; that of the enterprises by foreign investors and investors from Hong Kong, Macao and Taiwan 1,268.8 billion yuan, down by 4.1 percent; and that of private enterprises were 1,817.2 billion yuan, a rise of 20.0 percent.
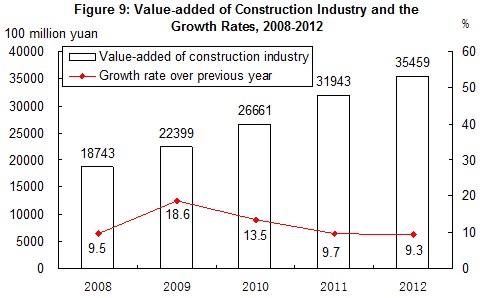
In 2012, the value added of construction enterprises in China was 3,545.9 billion yuan, up by 9.3 percent over the previous year. The profits made by construction enterprises qualified for general contracts and specialized contracts reached 481.8 billion yuan, up by 15.6 percent, of which the profits made by the state-owned and state-holding enterprises were 123.6 billion yuan, up by 21.9 percent.
IV. Investment in Fixed Assets
The completed investment in fixed assets of the country in 2012 was 37,467.6 billion yuan, up by 20.3 percent over the previous year. The real growth was 19.0 percent after deducting the price factors. Of the total investment, the investment in fixed assets (excluding rural households) was 36,483.5 billon yuan, up by 20.6 percent; and the investment in rural households reached 984.1 billion yuan, up by 8.3 percent. The investment in eastern areas[10] was 15,174.2 billion yuan, up by 16.5 percent over the previous year, in central areas was 8,790.9 billion yuan, a growth of 24.1 percent, in western areas 8,874.9 billion yuan, a growth of 23.1 percent, and in northeastern areas 4,124.3 billion yuan, up by 26.3 percent.
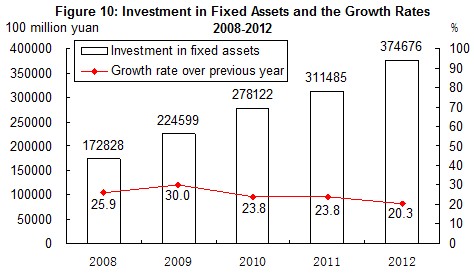
Table 3: Fixed Assets Investment (Excluding Rural Households) Unit: 100 million yuan Sector Investment Increase over 2011 (%) Total 364835 20.6 Agriculture, Forestry, Animal Husbandry and Fishing 9004 32.2 Mining 13129 11.8 Manufacturing 124971 22.0 Production and Supply of Electricity, Heat, Gas and Water 16536 12.8 Construction 4036 24.6 Wholesale and Retail Trade 9816 33.0 Transport, Storage and Post 30296 9.1 Lodging and Catering Services 5102 30.2 Information Transmission, Computer Services and Software 2834 30.6 Banking 932 46.2 Real Estate[11] 92357 22.1 Leasing and Business Services 4645 37.4 Scientific Research and Technical Service 2176 27.8 Water Conservancy, Environment and Public Facilities Management 29296 19.5 Services to Households, maintenance and Other Services 1718 26.0 Education 4679 20.3 Health and Social Work 2645 23.0 Culture, Sports and Entertainment 4299 36.2 Public Management, Social Security and Social Organization 6363 9.2
and Its Growth by Sector in 2012
In the investment in fixed assets (excluding rural households), the investment in the primary industry was 900.4 billion yuan, up by 32.2 percent; that in the secondary industry was 15,867.2 billion yuan, up by 20.2 percent; and that in the tertiary industry was 19,715.9 billion yuan, up by 20.6 percent.
Table 4: Newly Increased Production Capacity Item Unit Volume Newly increased power generating capacity 10000 kilowatts 8020 Newly increased power transformer equipment with a capacity of over 220 kilovolts 10000 kilovolt-amperes 18208 New railways put into operation Kilometer 5382 Of which, high-speed railways[12] Kilometer 2723 Double-track railways put into operation Kilometer 4763 Electrified railways put into operation Kilometer 6054 New highways Kilometer 58672 Of which: Expressways Kilometer 9910 New cargo-handling capacity of berths for over 10000-tonnage ships 10000 tons 49522 New lines of optical-fiber cables 267
through Fixed Assets Investment in 2012
In 2012, the investment in real estate development was 7,180.4 billion yuan, up by 16.2 percent. Of this total, the investment in residential buildings reached 4,937.4 billion yuan, an increase of 11.4 percent, that in office buildings was 336.7 billion yuan, up by 31.6 percent, and that in buildings for commercial business was 931.2 billion yuan, up by 25.4 percent.
In 2012, the newly started construction of affordable housing projects in urban areas amounted to 7.81 million units (households), and the affordable housing projects in urban areas basically completed were 6.01 million units.
Table 5: Main Indicators for Real Estate Development Item Unit Volume Increase over 2011 (%) Value of Investment 100 million yuan 71804 16.2 Of which: residential buildings 100 million yuan 49374 11.4 Of which: 90 square meters and below 100 million yuan 16789 21.9 Floor space of houses under construction 10000 square meters 573418 13.2 Of which: residential buildings 10000 square meters 428964 10.6 Floor space of houses newly started 10000 square meters 177334 -7.3 Of which: residential buildings 10000 square meters 130695 -11.2 Floor space of houses completed 10000 square meters 99425 7.3 Of which: residential buildings 10000 square meters 79043 6.4 Sales of commercial buildings 10000 square meters 111304 1.8 Of which: residential buildings 10000 square meters 98468 2.0 Sources of capital this year 100 million yuan 96538 12.7 Of which: domestic loans 100 million yuan 14778 13.2 Individual mortgage 100 million yuan 10524 21.3 Land space purchased this year 10000 square meters 35667 -19.5 Transaction value of land this year[13] 100 million yuan 7410 -16.7
and Sales and Its Growth in 2012
V. Domestic Trade
In 2012, the total retail sales of consumer goods reached 21,030.7 billion yuan, a growth of 14.3 percent over the previous year, or a real growth of 12.1 percent after deducting price factors. An analysis on different areas showed that the retail sales of consumer goods in urban areas stood at 18,241.4 billion yuan, up by 14.3 percent, and that in rural areas reached 2,789.3 billion yuan, up by 14.5 percent. Grouped by consumption patterns, the income of retail sales of commodities was 18,685.9 billion yuan, up by 14.4 percent, and that of catering industry was 2,344.8 billion yuan, up by 13.6 percent.
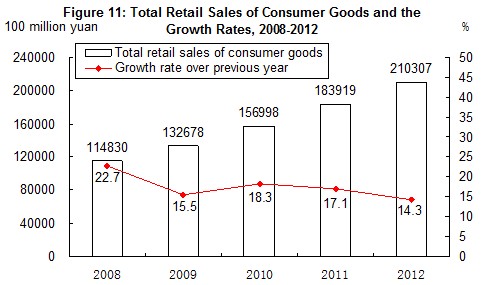
Of the total retail sales of commodities by enterprises above designated size, the year-on-year growth of sales for motor vehicles was 7.3 percent, that for grain and oil was 19.9 percent, for meat and eggs 18.0 percent, for clothing 17.7 percent, for daily necessities 17.5 percent, for cultural and office goods 17.7 percent. The sales of telecommunication equipment increased by 28.9 percent. The growth of sales for cosmetics was 17.0 percent, for gold, silver and jewelry 16.0 percent, for traditional Chinese drugs and western drugs 23.0 percent, for electric and electronic appliances for household use and audio-video equipment 7.2 percent, for furniture 27.0 percent and building and decoration materials 24.6 percent.
VI. Foreign Economic Relations
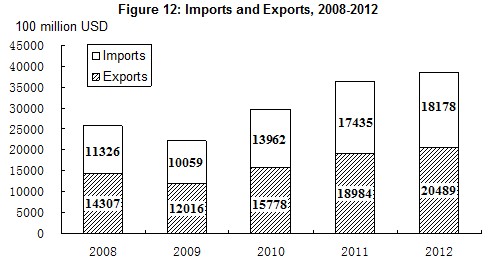
The total value of imports and exports in 2012 reached 3,866.8 billion US dollars, up by 6.2 percent over the previous year. Of this total, the value of goods export was 2,048.9 billion US dollars, increased by 7.9 percent, and the value of goods import was 1,817.8 billion US dollars, up by 4.3 percent. The balance of imports and exports was (exports minus imports) 231.1 billion US dollars, an increase of 76.2 billion US dollars over the previous year.
Table 6: Total Value of Imports and Exports and the Growth Rates in 2012 Unit: 100 million USD Item Value Increase over 2011 (%) Total import and export of goods 38668 6.2 Exports 20489 7.9 Of which: General trade 9880 7.7 Processing trade 8628 3.3 Of which: Mechanical and electronic products 11794 8.7 High & new-tech products 6012 9.6 Of which: State-owned 2563 -4.1 Foreign-funded 10227 2.8 Others 7699 21.1 Imports 18178 4.3 Of which: General trade 10218 1.4 Processing trade 4812 2.4 Of which: Mechanical and electronic products 7824 3.8 High & new-tech products 5068 9.5 Of which: State-owned 4954 0.3 Foreign-funded 8712 0.8 Others 4512 17.2 Trade surplus (exports minus imports) 2311 —
Table 7: Main Export Commodities in Volume Item Volume Increase over 2011(%) Value (100 million USD) Increase over 2011 (%) Coal (including lignite) 10000 tons 926 -36.8 16 -41.6 Rolled steel 10000 tons 5573 14.0 515 0.5 Textile yarns and textile articles ---- — — 958 1.2 Clothes and clothing accessories ---- — — 1591 3.9 Footwear ---- — — 468 12.2 Furniture ---- — — 488 28.7 Automatic data processing machines and components 10000 sets 183275 -0.1 1853 5.1 Handheld mobiles and car telephones 10000 sets 101447 15.9 810 29.1 Containers 10000 units 248 -23.5 84 -26.1 Liquid crystal display panels 10000 units 316650 29.7 363 22.9 Motor vehicles (including a complete set of spare sets) 10000 sets 99 20.1 127 27.5
and Value and the Growth Rates in 2012
Unit
Table 8: Main Import Commodities in Volume Item Volume (10000 tons) Increase over 2011 (%) Value (100 million USD) Increase over 2011 (%) Cereals and cereal flour 1398 156.7 48 134.2 Soybean 5838 11.2 350 17.6 Edible vegetable oil 845 28.7 97 25.6 Iron ore 74355 8.4 956 -15.0 Aluminum oxide 502 165.1 18 133.3 Coal (including lignite) 28851 29.8 287 20.2 Crude oil 27102 6.8 2207 12.1 Petroleum products refined 3982 -1.9 330 0.6 Plastics in primary forms 2370 2.9 462 -2.2 Paper pulp 1646 14.0 110 -7.5 Rolled steel 1366 -12.3 178 -17.5 Copper and copper alloys 465 14.1 386 4.9
and Value and the Growth Rates in 2012
Table 9: Imports and Exports by Major Countries Unit: 100 million USD Country or region Exports Increase over 2011 (%) Imports Increase over 2011 (%) United States 3518 8.4 1329 8.8 European Union 3340 -6.2 2121 0.4 Hong Kong, China 3235 20.7 180 15.9 ASEAN 2043 20.1 1958 1.5 Japan 1516 2.3 1778 -8.6 Republic of Korea 877 5.7 1686 3.7 India 477 -5.7 188 -19.6 Russia 441 13.2 441 9.2 Taiwan, China 368 4.8 1322 5.8
and Regions and the Growth Rates in 2012
The year 2012 witnessed the establishment of 24,925 enterprises with foreign direct investment in non-financial sectors, down by 10.1 percent over the previous year; and the foreign capital actually utilized was 111.7 billion US dollars, down by 3.7 percent.
Table 10: Total Value of Foreign Direct Investment Sector Enterprises Increase over 2011 (%) Actually Utilized Value (100 million USD) Increase over 2011 (%) Total 24925 -10.1 1117.2 -3.7 Of which: Agriculture, Forestry, Animal Husbandry and Fishing 882 2.0 20.6 2.7 Manufacturing 8970 -19.3 488.7 -6.2 Production and Supply of Electricity, Gas and Water 187 -12.6 16.4 -22.6 Transport, Storage, Post and Telecommunication Services 397 -3.9 34.7 8.9 Information Transmission, Computer Services and Software 926 -6.8 33.6 24.4 Wholesales & Retail Trade 7029 -3.2 94.6 12.3 Real Estate 472 1.3 241.2 -10.3 Leasing and Business Services 3229 -8.2 82.1 -2.0 Services to Households and Other Services 192 -9.4 11.6 -38.2
in Non-financial Sectors and the Growth Rates in 2012
In 2012, the overseas direct investment (non-financial sectors) by Chinese investors was 77.2 billion US dollars, up by 28.6 percent over the previous year.
In 2012, the accomplished business revenue through contracted overseas engineering projects was 116.6 billion US dollars, up by 12.7 percent, and the number of labor forces sent abroad through overseas labor contracts was 512 thousand, an increase of 13.3 percent.
VII. Transportation, Post, Telecommunications and Tourism
In 2012, the total freight traffic reached 41.2 billion tons, up by 11.5 percent over the previous year, and the freight flows were 17,314.5 billion ton-kilometers, grew by 8.7 percent. The volume of freight handled by ports above the designated size throughout the year totaled 9.74 billion tons, up 6.8 percent over the previous year, of which freight for foreign trade was 3.01 billion tons, up 8.8 percent. Container shipping of ports above the designated size reached 176.51 million standard containers, up by 8.1 percent.
Table 11: Freight Traffic by All Means of Transportation Item Unit Volume Increase over 2011 (%) Total freight traffic 100 million tons 412.1 11.5 Railways 100 million tons 39.0 -0.7 Highways 100 million tons 322.1 14.2 Waterways 100 million tons 45.6 7.0 Civil aviation 10 000 tons 541.6 -2.0 Pipelines 100 million tons 5.3 -7.8 Freight flows 100 million ton-kilometers 173145.1 8.7 Railways 100 million ton-kilometers 29187.1 -0.9 Highways 100 million ton-kilometers 59992.0 16.8 Waterways 100 million ton-kilometers 80654.5 6.9 Civil aviation 100 million ton-kilometers 162.2 -6.8 Pipelines 100 million ton-kilometers 3149.3 9.1
and the Growth Rates in 2012
In 2012, the total passenger traffic reached 37.9 billion persons, up by 7.6 percent over 2011, and the passenger flows were 3,336.9 billion person-kilometers, grew by 7.7 percent.
Table 12: Passenger Traffic by All Means of Item Unit Volume Increase over 2011 (%) Total passenger traffic 100 million persons 379.0 7.6 Railways 100 million persons 18.9 4.8 Highways 100 million persons 354.3 7.8 Waterways 100 million persons 2.6 4.3 Civil aviation 100 million persons 3.2 9.2 Passenger flows 100 million person-kilometers 33368.8 7.7 Railways 100 million person-kilometers 9812.3 2.1 Highways 100 million person-kilometers 18468.4 10.2 Waterways 100 million person-kilometers 77.4 3.9 Civil aviation 100 million person-kilometers 5010.7 10.4
Transportation and the Growth Rates in 2012
The total number of motor vehicles for civilian use reached 120.89 million (including 11.45 million tri-wheel motor vehicles and low-speed trucks) by the end of 2012, up 14.3 percent, of which private-owned vehicles numbered 93.09 million, up 18.3 percent. The total number of cars for civilian use stood at 59.89 million, up by 20.7 percent, of which private-owned cars numbered 53.08 million, up by 22.8 percent.
The turnover of post and telecommunication services[14] totaled 1,502.2 billion yuan, up 13.0 percent over the previous year. Of this total, post services accounted for 203.7 billion yuan, up 26.7 percent, and telecommunication services 1,298.5 billion yuan, up 11.1 percent. In post services, the number of mail delivery reached 7.074 billion, parcel delivery 69 million and express delivery 5.685 billion. In 2012, with an increase of 4.78 million lines of office switchboards, the total capacity stood at 439.06 million lines. The newly increased capacity of mobile phone switchboard[15] was 112.34 million lines with the total capacity reaching 1,828.70 million lines. The year also saw 278.15 million fixed telephone subscribers. This included 188.93 million urban subscribers and 89.22 million rural subscribers. Mobile phone users numbered 1,112.16 million by the end of 2012, with 125.90 million new subscribers in the year. Of this total, the number of 3G mobile phone users[16] reached 232.80 million. In total, the number of fixed and mobile phone users reached 1,390.31 million, an increase of 118.96 million as compared with that at the end of 2011. Phone coverage was 103.2 sets per 100 persons. The number of Internet users was 564 million, of which wide-band users was 530 million, and the coverage rate of Internet was 42.1 percent.

The year 2012 saw 2.96 billion domestic tourists, up 12.1 percent over the previous year. The revenue from domestic tourism totaled 2,270.6 billion yuan, up 17.6 percent. The number of inbound visitors to China totaled 132.41 million, a year-on-year decrease of 2.2 percent. Of this total, 27.19 million were foreigners, up 0.3 percent; and 105.21 million were Chinese compatriots from Hong Kong, Macao and Taiwan, down by 2.9 percent. Of all the inbound tourists, overnight visitors counted 57.72 million, up 0.3 percent. Foreign exchange earnings from international tourism topped 50.0 billion US dollars, up 3.1 percent. The number of China’s outbound visitors totaled 83.18 million, up 18.4 percent. Of this total, 77.06 million were on private visits, a year-on-year rise of 20.2 percent, or 92.6 percent of all outgoing visitors.
VIII. Financial Intermediation
By the end of 2012, money supply of broad sense (M2) was 97.4 trillion yuan, reflecting a year-on-year increase of 13.8 percent. Money supply of narrow sense (M1) was 30.9 trillion yuan, up 6.5 percent. Cash in circulation (M0) was 5.5 trillion yuan, up 7.7 percent.
Savings deposit in Renminbi and foreign currencies in all items of financial institutions totaled 94.3 trillion yuan at the end of 2012, an increase of 11.6 trillion yuan. Of this total, the savings deposit in Renminbi stood at 91.8 trillion yuan, an increase of 10.8 trillion yuan. Loans in Renminbi and foreign currencies in all items of financial institutions reached 67.3 trillion yuan, an increase of 9.1 trillion yuan. Of this total, that in Renminbi was 63.0 trillion yuan, an increase of 8.2 trillion yuan. In 2012, the total social financing[17] reached 15.8 trillion yuan, or 2.9 trillion yuan more than that in 2011 on a comparable basis.
Table 13: Savings Deposit and Loans in RMB and Foreign Currencies in All Financial Institutions and the Growth Rates at the end of 2012 Unit: 100 million yuan Item Year-end figure Increase over 2011 (%) Savings deposit 943102 14.1 Of which: By households 410201 16.6 Of which: Deposits in RMB 406192 16.7 By non-financial enterprises 345124 9.9 Loans 672875 15.6 Of which: Domestic short-term loans 268152 23.3 Domestic medium and long-term loans 363894 9.0
Loans in Renminbi from rural financial institutions (i.e. rural credit cooperatives, rural cooperation banks, and rural commercial banks) totaled 7,832.0 billion yuan by the end of 2012, an increase of 1,154.4 billion yuan as compared with the beginning of the year. The loans in Renminbi for consumption use from all financial institutions totaled 10,435.7 billion yuan, an increase of 1,565.6 billion yuan. Of all consumption loans, short-term loans for individuals totaled 1,936.7 billion yuan, an increase of 582.6 billion yuan, and medium- and long-term loans for individuals reached 8,499.0 billion yuan, an increase of 983.0 billion yuan.
Funds raised in 2012 by enterprises through issuing stocks and share rights on stock market amounted to 584.1 billion yuan, a decrease of 93.9 billion yuan from the previous year. Of this total, 154 A-shares were issued, receiving 103.4 billion yuan worth of capital altogether, a decrease of 179.1 billion yuan. The refinancing of A-shares (including rationing shares, public newly issued, nonpublic newly issued[18] and warrants) received 209.3 billion yuan worth of capital altogether, a decrease of 15.5 billion yuan from 2011. The listed companies financed 271.3 billion yuan through convertible bonds, bonds with attached warrants and corporate bonds, an increase of 100.6 billion yuan. A total of 74 growth enterprise board stocks were issued, receiving 35.1 billion yuan.
In 2012, 3.7 trillion yuan corporate debenture bonds[19] were issued, an increase of 1.4 trillion yuan over the previous year.
The premium[20] received by the insurance companies totaled 1,548.8 billion yuan in 2012, up 8.0 percent over the previous year. Of this total, life insurance premium amounted to 890.8 billion yuan, health and casualty insurance premium 124.9 billion yuan, and property insurance premium 533.1 billion yuan. Insurance companies paid an indemnity worth of 471.6 billion yuan, of which, life insurance indemnity was 150.5 billion yuan, health and casualty insurance indemnity 39.5 billion yuan, and property insurance indemnity 281.6 billion yuan.
IX. Education, Science & Technology and Culture
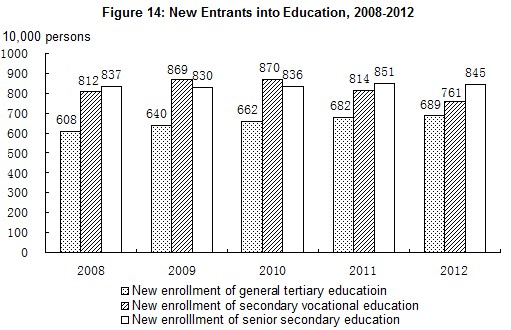
In 2012, the post-graduate education enrollment was 1.720 million students with 590 thousand new students and 486 thousand graduates. The general tertiary education enrollment was 23.913 million students with 6.888 million new students and 6.247 million graduates. Vocational secondary schools of various types had 21.203 million enrolled students, including 7.610 million new entrants, and 6.736 million graduates. Senior secondary schools had 24.672 million enrolled students, including 8.446 million new entrants, and 7.915 million graduates. Students enrolled in junior secondary schools totaled 47.631 million, including 15.708 million new entrants, and 16.608 million graduates. The country had a primary education enrollment of 96.959 million students, including 17.147 million new entrants, and 16.416 million graduates. There were 379 thousand students enrolled in special education schools, with 66 thousand new entrants and 49 thousand graduates. Kindergartens accommodated 36.858 million children.
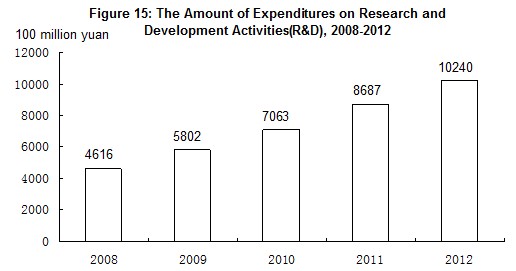
The amount of expenditures on research and development activities (R&D) was worth 1,024.0 billion yuan in 2012, up 17.9 percent over 2011, accounting for 1.97 percent of GDP. Of this total, 49.8 billion yuan was appropriated for fundamental research programs. A total number of 1,701 projects under the National Key Technology Research and Development Program and 1,165 projects under the Hi-tech Research and Development Program (the 863 Program) were implemented. The year 2012 saw a total of 130 national engineering research centers, 128 national engineering laboratories, 149 national and local joint engineering research centers and 180 national and local joint engineering laboratories. The number of state validated enterprise technical centers reached 887 and the technical centers at the provincial level numbered 8,137. Venture capital investment plan[21] had been implemented to boost new emerging industries, accumulatively 102 venture investment enterprises were supported to be established with nearly 29 billion yuan, and 238 venture businesses were invested. Some 2,051 thousand patent applications were accepted from home and abroad, of which 1,886 thousand were domestic applications, accounting for 91.9 percent of the total. A total number of 653 thousand patent applications for new inventions were accepted, of which 523 thousand were from domestic applicants or 80.1 percent of the total. A total of 1,255 thousand patents were authorized in 2012, of which 1,144 thousand were domestic patents, accounting for 91.1 percent of the total. A total of 217 thousand patents for new inventions were authorized, of which 137 thousand were domestic ones, accounting for 63.2 percent. Till the end of year 2012, the number of patents in force was 3.509 million, of which 2.899 million patents were domestic ones, accounting for 82.6 percent; the number of patents in force for inventions was 875 thousand, of which 435 thousand were domestic ones, accounting for 49.7 percent. A total of 282 thousand technology transfer contracts were signed, representing 643.71 billion yuan in value, up 35.1 percent over the previous year. The year 2012 saw 19 times of successful launch of satellites. Shenzhou IX Spacecraft and Tiangong-1 Target Spacecraft completed the first space rendezvous and docking mission successfully in 2012. Beidou-2 Navigation Satellite System completed regional networking and started to offer services. The manned submersible Jiaolong achieved 7,000 meters sea trial test successfully.
By the end of 2012, there were altogether 28,128 laboratories for product inspection, including 509 national inspection centers. There were 173 organizations for product certification and management system certification, which accumulatively certified products in 105,224 enterprises. A total of 3,496 authorized measurement institutions enforced compulsory inspection on 62.67 million measurement instruments in the year. A total of 1,986 national standards were developed or revised in the year, including 1,375 new standards. There were 5,123 weather warning signals sent by national and provincial meteorological stations, and 4,049 weather alerts. There were 1,687 seismological monitor stations and 32 regional seismological monitor network stations. The number of oceanic observation stations was 79. Mapping and geographic information departments published 1,662 maps.
At the end of 2012, there were 2,089 art-performing groups, 2,838 museums, 2,975 public libraries and 3,286 culture centers in the cultural system throughout China. There were totally 2,579 radio and television broadcasting institutions of various types. Subscribers to cable television programs numbered 214 million. Subscribers to digital cable television programs were 143 million. Radio broadcasting and television broadcasting coverage rates were 97.5 percent and 98.2 percent respectively. Totally 17,703 episodes of 506 TV series and 222,838 minutes of TV cartoons were made in 2012. The country produced 745 feature movies and 148 science, educational, documentary, cartoon and special movies[22]. A total of 47.6 billion copies of newspapers and 3.4 billion copies of magazines were issued, and 8.1 billion copies of books were published. By the end of the year, there were 4,107 archives in China and 116.62 million documents were made accessible to the public.
In 2012, Chinese athletes won 107 world championships on 24 sports events and broke 14 world records. On the London Olympic Games, China won 88 medals with 38 gold medals, winning the second place in the gold medal tally and overall medal table. On London Para Olympic Games, Chinese athletes won 95 gold medals, topping both the gold medal tally and overall medal standings.
X. Public Health and Social Services
By the end of 2012, there were 961,830 medical and health institutions in China, including 23,005 general hospitals, 37,128 township health centers, 33,646 community health service centers, 179,644 clinics, 663,355 village clinics, 3,506 epidemic disease prevention centers and 3,037 health monitoring institutions. There were 6.50 million health workers in China, including 2.52 million practicing doctors and assistant practicing doctors and 2.42 million registered nurses. The medical and health institutions in China possessed 5.57 million beds, of which, general hospitals possessed 4.03 million and township health centers had 1.06 million. In 2012, 3.217 million people were infected by A or B class infectious diseases, with 16,721 reported deaths. The incidence of infectious disease was 238.76 per 100 thousand, with the death rate standing at 1.24 per 100 thousand.

By the end of 2012, there were all together 47 thousand social welfare institutions[23] of various types providing 4.298 million beds, accommodating 2,967 thousand inmates. Of this total, 42 thousand were elder-caring organizations providing 3.810 million beds, accommodating 2,620 thousand inmates. There were 16 thousand community service centers and 72 thousand community service stations. By the end of 2012, minimum living allowances were granted to 21.425 million urban residents and 53.409 million rural residents, and 5.459 million rural residents received five-guarantees supporting[24]. Medical aid was provided to 6,664 thousand needy people in cities and 19,084 thousand needy people in rural areas. Another 11.589 million needy people in urban areas were financed to participate in urban medical insurance system, and 39.151 million needy people in rural areas were financed to participate in new type of rural cooperative medical care system.
XI. Population, Living Conditions and Social Security
By the end of 2012, the total number of Chinese population at the mainland reached 1,354.04 million, an increase of 6.69 million over that at the end of 2011. Of this total, urban population numbered 711.82 million, accounting for 52.6 percent, or 1.3 percentage points higher than that at the end of the previous year. The year 2012 saw 16.35 million births, a crude birth rate of 12.10 per thousand, and 9.66 million deaths, or a crude death rate of 7.15 per thousand. The natural growth rate was 4.95 per thousand. The sex ratio at birth was 117.70. The number of population aged 0-14 (under the age of 15) was 222.87 million, accounting for 16.5 percent of the total population, which was 0.01 percentage point higher than that at the end of 2011; the number of working-age population aged 15-59 (under the age of 60) was 937.27 million, accounting for 69.2 percent of the total, or 0.60 percentage point lower, which was a decrease of 3.45 million compared with that at the end of 2011; and the number of population aged 60 and over reached 193.90 million, accounting for 14.3 percent of the total, which was 0.59 percentage point higher than that at the end of 2011. The number of population that are separated from their household registration[25] reached 279 million, of which 236 million were floating population[26].
|
Table 14: Population and Its Composition by the end of 2012 Unit: 10,000 persons | ||
|
Item |
Population |
Proportion (%) |
|
|
|
|
|
National Total |
135404 |
100.0 |
|
Of which: Urban |
71182 |
52.6 |
|
Rural |
64222 |
47.4 |
|
Of which: Male |
69395 |
51.3 |
|
Female |
66009 |
48.7 |
|
Of which: Aged 0-14 (under the age of 15) |
22287 |
16.5 |
|
Aged 15-59 (under the age of 60) |
93727 |
69.2 |
|
Aged 60 and over |
19390 |
14.3 |
|
Of which: Aged 65 and over |
12714 |
9.4 |
|
|
|
|
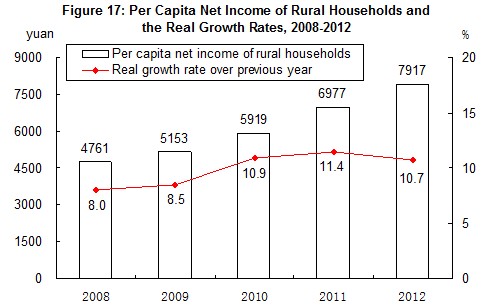
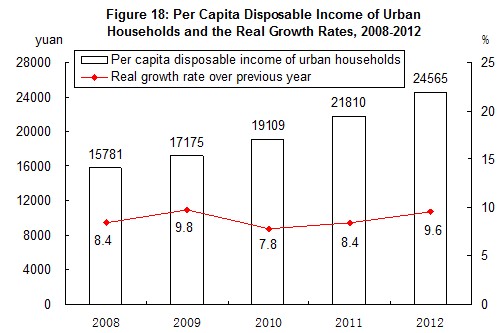
In 2012, the annual per capita net income of rural households was 7,917 yuan, up by 13.5 percent, or a real increase of 10.7 percent over the previous year when the factors of price increase were deducted. The median of per capita net income[27] of rural households was 7,019 yuan, up by 13.3 percent. The annual per capita disposable income of urban households was 24,565 yuan, up by 12.6 percent, or a real increase of 9.6 percent. The median of per capita disposable income of urban households was 21,986 yuan, up by 15.0 percent. The proportion of expenditure on food to the total expenditure of households was 39.3 percent for rural households and 36.2 percent for urban households.
At the end of 2012, a total of 303.79 million people participated in urban basic pension program for staff and workers, a year-on-year increase of 19.88 million. Of this total, 229.78 million were staff and workers, and 74.01 million were retirees. A total of 483.70 million people participated in social pension insurance program for urban and rural residents, an increase of 151.87 million, of whom 130.75 million received pension. A total of 535.89 million people participated in urban basic health insurance program, an increase of 62.46 million, of whom 264.67 million people participated in urban basic health insurance program for staff and workers[28], and 271.22 million people participated in programs for residents. A total of 49.96 million people participated in urban basic health insurance programs were migrant workers coming from the rural areas, an increase of 3.55 million. Some 152.25 million people participated in unemployment insurance programs, an increase of 9.08 million. The number of people receiving unemployment insurance payment stood at 2.04 million. A total of 189.93 million people participated in work accident insurance, an increase of 12.97 million, of which 71.73 million were migrant workers coming from the rural areas, an increase of 3.45 million. A total of 154.45 million people participated in maternity insurance programs, an increase of 15.53 million. By the end of the year 2012, a total of 2,566 counties (cities, districts) conducted the new cooperative medical care system in rural areas, with a participation rate of 98.1 percent. In the first nine months of 2012, the total expenditure[29] of the new cooperative medical care system in rural areas reached 171.7 billion yuan, benefiting 1.15 billion people. In 2012, according to the rural poverty line of annual per capita net income below 2,300 yuan (2010 constant prices), the population in poverty in rural areas numbered 98.99 million at the end of the year, or 23.39 million less than that at the end of 2011.
XII. Resources, Environment and Work Safety
In 2012, the total supply of state-owned land for construction use[30] was 690 thousand hectares, a growth of 17.5 percent over the previous year. Of this total, that for mining storage, 203 thousand hectares, up 5.6 percent; for real estate[31], 160 thousand hectares, down 4.2 percent; and for infrastructure facilities, 327 thousand hectares, up 43.4 percent.
The total stock of water resources in 2012 was 2,841.0 billion cubic meters. The annual average precipitation was 676 millimeters. At the end of 2012, 422 large reservoirs in China stored 212.0 billion cubic meters of water, or 16.4 billion cubic meters more than that at the end of 2011. Total water consumption maintained the same level as 2011 and reached 611.0 billion cubic meters, of which water consumption for living purposes rose by 3.2 percent, for industrial use dropped by 0.8 percent, for agricultural use down by 0.5 percent, and for ecological water supplement grew by 7.2 percent. Water consumption for every 10 thousand yuan worth of GDP produced[32] was 129 cubic meters, a decline of 7.2 percent. Water consumption for every 10 thousand yuan worth of industrial value added was 76 cubic meters, down by 8.0 percent. Per capita water consumption was 452 cubic meters, down by 0.4 percent.
In 2012, a total of 6.01 million hectares of forests were planted, of which 4.10 million were afforested by manpower. Some 2.74 million hectares were afforested through key afforestation projects, accounting for 45.6 percent of the total planted area of the year. By the end of 2012, there were 2,640 natural reserves including 363 national ones. A total of 42 thousand square kilometers of eroded land was put under treatment programs, and 26 thousand square kilometers of land was closed for nurture and protection in areas suffering water and soil erosion. By the end of 2012, the total forest areas with set ownership were 180 million hectares, of this total, 171.87 million hectares obtained the forest ownership certifications.
The average temperature in 2012 was 9.4℃. Typhoon hit China 7 times in 2012.
Preliminary estimation indicated that the total energy consumption in 2012 amounted to 3.62 billion tons of standard coal equivalent, up 3.9 percent over 2011. The consumption of coal grew by 2.5 percent; crude oil, up 6.0 percent; natural gas, up 10.2 percent; and electric power, up 5.5 percent. The national energy consumption per 10,000 yuan worth of GDP went down by 3.6 percent.
Monitoring of water quality on 571 sections of the 7 major water systems in China showed that 63.9 percent of the sections met the national quality standard from Grade I to Grade III for surface water; and 12.4 percent were worse than Grade V. Generally, the water quality in the 7 major water systems kept stable with light pollution.
Monitoring of oceanic water quality at 301 offshore monitoring stations indicated that oceanic water met the national quality standard Grade I and II in 69.4 percent of the stations; water quality at 6.6 percent of the stations met Grade III standard; and water of Grade IV or inferior quality was found at 23.9 percent of the stations.
Of the 316 cities subject to noise monitoring program, 3.5 percent enjoyed fairly good environment, 75.9 percent had good environment, 20.3 percent had light noise pollution, and 0.3 percent experienced medium noise pollution in downtown areas.
At the end of 2012, the daily treatment capacity of city sewage reached 118.58 million cubic meters, up 4.9 percent over that in 2011. City sewage treatment rate was 84.9 percent, up 1.3 percentage points. The floor space with central heating systems in urban area amounted to 4.92 billion square meters, up 3.8 percent. Greenery coverage reached 35.5 percent of the urban area, up 0.2 percentage point.
In 2012, natural disasters hit 24.96 million hectares of crops, down by 23.1 percent, of which 1.83 million hectares of crops were demolished, down by 36.9 percent. Flood and waterlog caused a direct economic loss of 166.1 billion yuan, an increase of 31.8 percent. Drought caused a direct economic loss of 24.4 billion yuan, down by 73.7 percent. Disasters from low temperature, frost and snow made a total direct economic loss of 6.1 billion yuan, down by 79.0 percent. Oceanic disasters caused a direct economic loss of 15.5 billion yuan, up by 150 percent. The country recorded 16 earthquakes with magnitude 5 and over, 11 of which caused disasters, causing a direct economic loss of 8.3 billion yuan. The year 2012 witnessed 3,966 forest fires, down by 28.5 percent.
The death toll due to work accidents amounted to 71,983 people, a year-on-year decrease of 4.7 percent. The death toll from work accidents every 100 million yuan worth of GDP was 0.142 people, a decline of 17.9 percent. Work accidents in industrial, mining and commercial enterprises caused 1.64 deaths out of every 100 thousand employees, down 12.8 percent. The road traffic death toll per 10 thousand vehicles was 2.5 persons, down 10.7 percent. The death toll for producing one million tons of coal in coalmines was 0.374 person, down 33.7 percent.
Notes:
1. All figures in this Communiqué are preliminary statistics. Statistics in this Communiqué do not include Hong Kong SAR, Macao SAR and Taiwan Province. Due to the rounding-off reasons, the subentries may not add up to the aggregate totals.
2. Gross domestic product (GDP) and value added as quoted in this Communiqué are calculated at current prices, whereas their growth rates are at constant prices.
3. The producer prices for farm products refer to the prices of farm products sold directly by producers.
4. The number of migrant workers includes those who obtain employment outside their villages and towns for more than six months in the year and those who do non-agricultural work in their villages and towns for more than six months in the year.
5. Public revenue refers to the revenue with taxes as the main body which was collected by the government as social manager by virtue of state political rights.
6. In the figure, the public revenue from 2008 to 2011 was final accounts, and the revenue of 2012 was executive accounts.
7. From 2012, the NBS implemented the new Industrial Classification for National Economic Activities, adjusting the classification of industry into 41 branches from the original 39. Therefore, the industrial classification for the investment in fixed assets (excluding rural households) is adjusted according to the new standard.
8. Six highly energy-consuming industries are: manufacture of raw chemical materials and chemical products, manufacture of non-metallic mineral products, smelting and pressing of ferrous metals, smelting and pressing of non-ferrous metals, oil processing, coking and nuclear fuel processing, and production and supply of electricity and heat.
9. Output of rolled steel includes duplicated counting of rolled steel as intermediate inputs used for producing other types of rolled steel.
10. The national total of fixed assets investment is larger than the aggregate sum by adding up the subtotals of fixed assets investment in the eastern areas, central areas, western areas and northeast areas due to the fact that some of the trans-regional investments are not covered by regional figures. The eastern areas include 10 provinces and municipalities: Beijing, Tianjin, Hebei, Shanghai, Jiangsu, Zhejiang, Fujian, Shandong, Guangdong and Hainan; central areas cover 6 provinces: Shanxi, Anhui, Jiangxi, Henan, Hubei and Hunan; western areas include 12 provinces, autonomous regions and municipality: Inner Mongolia, Guangxi, Chongqing, Sichuan, Guizhou, Yunnan, Tibet, Shaanxi, Gansu, Qinghai, Ningxia and Xinjiang; northeastern areas include 3 provinces: Liaoning, Jilin and Heilongjiang.
11. The investment in real estate includes the investment made in real estate development, construction of buildings for own use, property management, intermediary services and other real estate development.
12. High-speed railways refer to railways with a highest operating speed reaching 200km/h or above.
13. Transaction value of land refers to the final value for real estate development enterprises to conduct the transaction of land ownership, which is different from the value of land purchased.
14. The turnover of post and telecommunication services is calculated at constant prices of 2010.
15. The capacity of mobile phone switchboard refers to the number of maximum concurrent users calculated by the mobile phone switchboard according to certain calling model and switchboard processing capacity.
16. 3G refers to the third generation cellular mobile communication system (3rd-generation, abbreviated as 3G), 3G mobile phone users refer to those who have records in the billing system and use 3G network resources at the end of the reporting period.
17. Social financing refers to the total funds raised by real economy from the financial system over a period of time. It is an increment.
18. Non-public new issue, also called as targeted placement, excludes non-cash assets subscription.
19. Corporate debenture bonds include debt financing instruments of non-financial businesses, enterprise bonds, corporate bonds and convertible bonds.
20. The original premium income received by the insurance companies refers to the premium income from original insurance contracts confirmed by the insurance companies.
21. Venture capital investment plan for new emerging industries refers to the activities in which the central government special funds, together with the local government funds and social funds set up venture investment enterprises, or invest in the venture businesses in the form of equity investment to foster or promote the development of emerging industries.
22. Special movies refer to those using different display modes in terms of projection techniques, equipment and program as compared with the ordinary cinemas, such as IMAX movies, 3D movies, 4D movies, multidimensional movies and fulldome movies.
23. Social service institutions with accommodation include adoption agencies as well as aid agencies, community agencies, military sanatoriums, military supply stations and etc.
24. Five-guarantees supporting in rural areas refers to villagers who are aged, disabled or under the age of 16 and have no ability to work, no source of income and no statutory obligors to provide for them, bring them up or support them, or whose statutory obligors have no ability to provide for them, bring them up or support them, shall enjoy life-care and physical care in terms of food, clothing, housing, medical care and funeral expenses.
25. Population live in places other than their household registration refer to those whose current residences are different from the registered towns or streets which they have left for more than half a year.
26. Floating population refer to the population who live in places other than their household registration, excluding those with current residence different from the place of their household registration in the same city. Population live in places other than their household registration in the same city refer to those whose current residence are different from the registered towns or streets in the same district or in different districts in the same municipality or prefecture-level city.
27. The median of per capita income refers to the per capita income of household lied in the middle of all surveyed households which are ranked from low to high based on per capita income level.
28. The number of people covered in urban basic health insurance programs for staff and workers includes staff and workers and retirees insured. The urban basic health insurance programs for residents cover the urban non-employed residents who are not insured by the urban basic health insurance programs for staff and workers.
29. According to the statistical system of the Ministry of Health, the total expenditure of new cooperative medical care system in rural areas and the number of people benefited only cover the first nine months of the year.
30. Total supply of state-owned land for construction use refers to the supply of state-owned land for construction use with the land-used right sold, allocated or leased to units or individuals by the municipal or county governments according to annual land supply plan and in line with relevant laws in the reporting period.
31. Land used for real estate refers to the sum of land used for commercial service and for residence.
32. The consumption of water and energy for producing 10 thousand yuan worth of GDP and water consumption for every 10 thousand yuan worth of industrial value added are calculated at 2010 constant prices.
Data Sources:
In this communiqué, data of newly increased employed people, unemployment rate through unemployment registration and social security are from the Ministry of Human Resources and Social Security; data of foreign exchange reserves and exchange rate are from the State Administration of Foreign Exchange; financial data are from the Ministry of Finance; data of output of aquatic products are from the Ministry of Agriculture; data of production of timber, forestry and forest fires are from the State Forestry Administration; data of areas with effective irrigation system and water resources are from the Ministry of Water Resources; data of newly increased power generating capacity and newly increased power transformer equipment with a capacity of over 220 kilovolts are from China Electricity Council; data of new railways put into operation, double-track railways put into operation, electrified railways put into cooperation and railway transportation are from the Ministry of Railways; data of new highways, new cargo-handling capacity of berths for over 10000-tonnage ships, highway transportation, waterway transportation and volume of freight handled by ports are from the Ministry of Transport; data of new lines of optical-fiber cables, new capacity of mobile phone switchboards, the number of phone users and internet users etc. are from the Ministry of Industry and Information Technology; data of indemnificatory housing, treatment of city sewage, area with central heating systems and greenery coverage are from the Ministry of Housing and Urban-Rural Development; data of imports and exports of goods are from the General Administration of Customs; data of foreign direct investment, overseas direct investment, overseas contracted projects and overseas labor contracts are from the Ministry of Commerce; data of civil aviation are from the General Administration of Civil Aviation; data of pipelines are from China National Petroleum Corporation and China Petrochemical Corporation; data of motor vehicles for civilian use and the road traffic death toll are from the Ministry of Public Security; data of post services are from the State Post Bureau; data of tourism are from the National Tourism Administration and the Ministry of Public Security; data of money and finance and corporate debenture bonds are from the People’s Bank of China; data of listed companies are from the China Securities Regulatory Commission; data of insurances are from China Insurance Regulatory Commission; data of education are from the Ministry of Education; data of national technology research and development program and technology transfer contracts are from the Ministry of Science and Technology; data of national engineering research centers, enterprise technical centers and venture capital investment for boosting new emerging industries are from the National Development and Reform Commission; data of patents are from the State Intellectual Property Office; data of satellite launch are from the State Administration of Science, Technology and Industry for National Defense; data of quality inspection, development and revision of national standards are from the General Administration of Quality Supervision, Inspection and Quarantine; data of weather warning, average temperature and typhoon are from the China Meteorological Administration; data of earthquakes are from the China Seismological Bureau; data of mapping are from the State Bureau of Surveying and Mapping; data of oceanic observation stations, direct economic loss caused by oceanic disasters are from the State Oceanic Administration; data of art-performing groups, museums, public libraries and culture centers are from the Ministry of Culture; data of radio, television and movies are from the Administration of Radio, Film and Television; data of newspapers, magazines and books are from the General Administration of Press and Publication; data of documents are from the State Archives Administration; data of sports are from the General Administration of Sport; data of Para Olympic Games are from the China Disabled Persons’ Federation; data of health and new cooperative medical care system in rural areas are from the Ministry of Health; data of social services, minimum living allowances, five-guarantees supporting, areas of crops hit by natural disasters, direct economic loss caused by flood and waterlog, direct economic loss caused by drought, direct economic loss caused by low temperature, frost and snow are from the Ministry of Civil Affairs; data of supply of state-owned land for construction use are from the Ministry of Land and Resources; data of natural reserves and environment monitoring are from the Ministry of Environmental Protection; data of work safety are from the State Administration of Work Safety; all the other data are from the National Bureau of Statistics.
In case of any discrepancy between English translation and the original Chinese text, the Chinese edition shall prevail.