Statistical Communiqué of the People's Republic of China on the 2008 National Economic and Social Development
National Bureau of Statistics of China
February 26, 2009
In 2008, under the leadership of the CPC Central Committee and the State Council, the people of all nationalities of China, taking as the guidance of Deng Xiaoping Theory and the important thought of “Three Represents”, implemented earnestly the scientific approach to the economic and social development, they united as one with indomitable spirit to fight against the grief natural disasters and international financial crisis, national economy kept fast growth and all social undertakings achieved new progress.
I. General Outlook
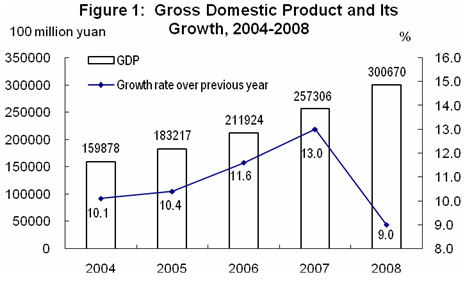
In 2008, the gross domestic product (GDP) of the year was 30,067.0 billion yuan, up by 9.0 percent over the previous year. Analyzed by different industries, the value added of the primary industry was 3,400.0 billion yuan, up by 5.5 percent, that of the secondary industry was 14,618.3 billion yuan, up by 9.3 percent and the tertiary industry was 12,048.7 billion yuan, up by 9.5 percent. The value added of the primary industry accounted for 11.3 percent of the GDP, up by 0.2 percentage point over that in the pervious year, that of the secondary industry accounted for 48.6 percent, up by 0.1 percentage point, and that of the tertiary industry accounted for 40.1 percent, down by 0.3 percentage point.
The general level of consumer prices in China was up by 5.9 percent over the previous year. Of this total, the prices for food went up by 14.3 percent. The prices for investment in fixed assets were up by 8.9 percent. The producer prices for manufactured goods increased by 6.9 percent, of which, the prices for means of production increased by 7.7 percent, and for means of subsistence grew by 4.1 percent. The purchasing prices for raw materials, fuels and power went up by 10.5 percent. The producer prices for farm products were up by 14.1 percent. The prices for means of agricultural production were up by 20.3 percent. The sales prices for housing in 70 large and medium-sized cities were up by 6.5 percent, of which, that for new residential buildings went up by 7.1 percent, for second hand housing grew by 6.2 percent, and the prices for rental and leasing were up by 1.4 percent.
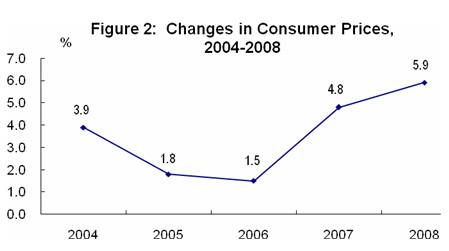
Table 1: General Level of Consumer Prices in 2008
Unit: %
Item |
National Average |
| |
|
Rural | ||
|
|
|
|
|
|
General level of consumer prices |
5.9 |
5.6 |
6.5 |
|
Food |
14.3 |
14.5 |
14.0 |
|
Of Which: Grain |
7.0 |
7.2 |
6.7 |
|
Meat, poultry and related products |
21.7 |
22.6 |
20.0 |
|
Oil |
25.4 |
24.9 |
25.9 |
|
Fresh eggs |
3.7 |
3.8 |
3.6 |
|
Fresh vegetables |
10.7 |
10.5 |
11.3 |
|
Fresh fruits |
9.0 |
8.9 |
9.3 |
|
Tobaccos and alcohols |
2.9 |
3.1 |
2.6 |
|
Clothing |
-1.5 |
-1.8 |
-0.6 |
|
Household appliances and services |
2.8 |
3.0 |
2.4 |
|
Medical, health and personal articles |
2.9 |
2.8 |
3.2 |
|
Transportation and telecommunications |
-0.9 |
-1.6 |
0.7 |
|
Recreational, educational, cultural articles and services |
-0.7 |
-0.9 |
-0.1 |
|
Housing |
5.5 |
4.3 |
8.2 |
|
|
|
|
|
At the end of 2008, the total of employed people in China numbered 774.80 million, 4.90 million more than that of 2007. Of this total, 302.10 million were employed in urban areas, a net increase of 8.60 million, a newly increase of 11.13 million. The urban unemployment rate through unemployment registration was 4.2 percent at the end of 2008, an increase of 0.2 percentage point over that of 2007.
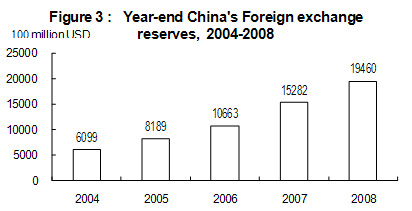
At the end of 2008, China’s foreign exchange reserves reached 1,946.0 billion US dollars, an increase of 417.8 billion US dollars as compared with that at the end of the pervious year. At the end of the year, the exchange rate was 6.8346 RMB to 1 USD, an appreciation by 6.9 percent over that at the end of 2007.
The taxes collected in the whole year reached 5,786.2 billion yuan (excluding tariffs, farm land taxes and deed taxes), up by 17.0 percent or an increase of 841.3 billion yuan over 2007.

II. Agriculture
In 2008, the sown area of grain was 106.70 million hectares, an increase of 1.06 million hectares as compared with that in the previous year; the sown area of cotton was 5.76 million hectares, a decline of 170 thousand hectares; the sown area of oil-bearing crops was 12.71 million hectares, an increase of 1.39 million hectares; the sown area of sugar crops was 1.93 million hectares, an increase of 130 thousand hectares.
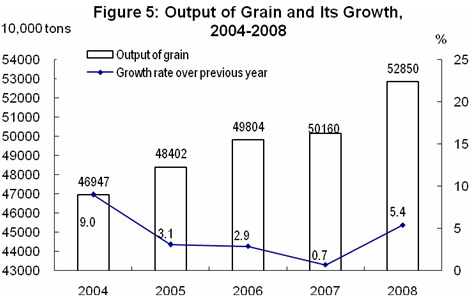
The total output of grain in 2008 was 528.50 million tons, an increase of 26.90 million tons or up by 5.4 percent over the previous year. Of this total, the output of summer crops was 120.41 million tons, up by 2.6 percent, and that of the early rice was 31.58 million tons, maintaining the same level of the previous year. The output of autumn grain was 376.51 million tons, an increase of 6.7 percent.
In 2008, the output of cotton was 7.50 million tons, a decrease of 1.6 percent over the previous year, that of oil-bearing crops was 29.50 million tons, up by 14.8 percent and that of sugar crops was 130.00 million tons, an increase of 6.7 percent, that of tobacco was 2.60 million tons, up by 19.6 percent, and that of tea was 1.24 million tons, up by 6.4 percent.
The total output of meat for the year reached 72.69 million tons, up by 5.9 percent. Of this total, the output of pork was 46.15 million tons, up by 7.6 percent, and that of beef and mutton was 6.10 and 3.76 million tons, down by 0.5 percent and 1.8 percent respectively. At the end of the year, 462.64 million pigs are registered in the total stocks, up by 5.2 percent, and 609.60 million pigs are slaughtered, up by 7.9 percent. The production of milk was 36.51 million tons, up by 3.6 percent; the total output of eggs was 26.38 million tons, up by 4.3 percent.
The total output of aquatic products was 48.95 million tons, up by 3.1 percent. Of this total, the output of cultured aquatic products was 34.26 million tons, up by 4.5 percent; and that of fished aquatic products was 14.69 million tons, maintaining the same level of the previous year.
The total production of timber for the year 2008 reached 78.94 million cubic meters, an increase of 13.2 percent.
Over 1.179 million hectares of farmland was increased with effective irrigation systems and another additional 1.390 million hectares of farmland was guaranteed by water-saving irrigation systems.
III. Industry and Construction
In 2008, the total value added of the industrial sector was 12,911.2 billion yuan, up by 9.5 percent over the previous year. The value added of industrial enterprises above the designated size was up by 12.9 percent. Of this total, that of the state-owned and state-holding enterprises grew by 9.1 percent, that of the collective enterprises went up by 8.1 percent, that of the share-holding enterprises increased by 15.0 percent, that of the enterprises by foreign investors and investors from Hong Kong, Macao and Taiwan soared by 9.9 percent and 20.4 percent growth for private enterprises. Analyzed by light and heavy industries, the growth of the light industry was 12.3 percent and that of the heavy industry was 13.2 percent.

In 2008, of the industrial enterprises above designated size, the growth of value added for the mining and washing of coal industry was 19.1 percent over the previous year, for the extraction of petroleum and natural gas was 6.1 percent, for culture and education, sporting goods manufacturing industry 18.2 percent, for gas production and supply industry 26.8 percent, for processing of food from agricultural product 15.0 percent, for manufacture of general machinery 16.9 percent, for manufacture of transport equipment 15.2 percent, for manufacture of communication equipment, computers and other electronic equipment 12.0 percent and for manufacture of electrical machinery and equipment 18.1 percent, for chemical fiber manufacturing industry 2.2 percent. The growth of the value added for the major six high energy consuming industries were 10.0 percent, of which, that of the manufacture of non-metallic mineral products was 16.9 percent, smelting and pressing of ferrous metals 8.2 percent, manufacture of raw chemical materials and chemical products 10.0 percent, smelting and pressing of non-ferrous metals 12.3 percent, production and supply of electric power and heat power 8.6 percent and 4.3 percent for processing of petroleum, coking, processing of nuclear fuel. The value added growth for the high-tech industry was 14.0 percent over the previous year.
Table 2: Output of Major Industrial Products and the Growth Rates in 2008
|
Product |
Unit |
Output |
Increase over 2007 (%) |
|
|
|
|
|
|
Yarn |
10000 tons |
2148.9 |
3.9 |
|
Cloth |
100 million meters |
710.0 |
5.1 |
|
Chemical fibers |
10000 tons |
2415.0 |
0.1 |
|
Sugar (final product) |
10000 tons |
1449.5 |
14.0 |
|
Cigarettes |
100 million |
22198.8 |
3.5 |
|
Color TV sets |
10000 |
9033.1 |
6.5 |
|
Household refrigerators |
10000 |
4756.9 |
8.2 |
|
Room air conditioners |
10000 |
8230.9 |
2.7 |
|
Total primary energy production |
100 million tons of standard coal equivalent |
26.0 |
5.2 |
|
Coal |
100 million tons |
27.93 |
4.1 |
|
Crude oil |
100 million tons |
1.90 |
2.2 |
|
Natural gas |
100 million cubic meters |
760.8 |
9.9 |
|
Electricity |
100 million kilowatt-hours |
34668.8 |
5.6 |
|
Of which: Thermal-power |
100 million kilowatt-hours |
27900.8 |
2.5 |
|
Hydro-power |
100 million kilowatt-hours |
5851.9 |
20.6 |
|
Crude steel |
10000 tons |
50091.5 |
2.4 |
|
Rolled steel |
10000 tons |
58488.1 |
3.4 |
|
Ten kinds of nonferrous metals |
10000 tons |
2520.3 |
5.9 |
|
Of which: Refined copper (copper) |
10000 tons |
378.9 |
10.1 |
|
Aluminum electrolyze |
10000 tons |
1317.6 |
6.8 |
|
Aluminum oxide |
10000 tons |
2278.2 |
17.0 |
|
Cement |
100 million tons |
14.0 |
2.9 |
|
Sulfuric acid |
10000 tons |
5132.7 |
-5.2 |
|
Soda ash |
10000 tons |
1881.3 |
6.6 |
|
Caustic soda |
10000 tons |
1852.1 |
5.3 |
|
Ethylene |
10000 tons |
998.3 |
-2.9 |
|
Chemical fertilizers (100 percent equivalent) |
10000 tons |
6012.7 |
3.2 |
|
Power-generating equipment |
10000 kilowatts |
13319.4 |
2.5 |
|
Motor vehicles |
10000 |
934.55 |
5.1 |
|
Of which: Cars |
10000 |
503.7 |
5.0 |
|
Large & medium tractors |
10000 |
21.7 |
6.9 |
|
Integrated circuits |
100 million pieces |
417.1 |
1.3 |
|
Program-controlled switchboards |
10000 lines |
4584.0 |
-14.9 |
|
Mobile telephones |
10000 |
55964.0 |
2.0 |
|
Micro-computers |
10000 |
13666.6 |
13.2 |
|
|
|
|
|
The profits made by the industrial enterprises above the designated size in the first 11 months of 2008 were 2,406.6 billion yuan, an increase of 4.9 percent over the same period of last year.
Table 3: Profits and Growth of Industrial Enterprises above the Designated Size in the First Eleven Months of 2008
Unit: 100 million yuan
|
Item |
Total Profits |
Increase over same period last year (%) |
|
|
|
|
|
Industrial enterprises above designated size |
24066 |
4.9 |
|
Of which: State-owned and state-holding enterprises |
7985 |
-14.5 |
|
Of which: Collective enterprises |
687 |
29.5 |
|
Share-holding enterprises |
13467 |
11.4 |
|
Enterprises by foreign investors or investors from Hong Kong, Macao and Taiwan |
6374 |
-3.1 |
|
Of which: Private enterprises |
5495 |
36.6 |
|
|
|
|
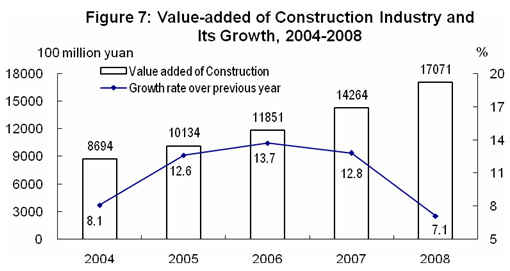
In 2008, the value added of construction enterprises in China was 1,707.1 billion yuan, up by 7.1 percent over the previous year. The profits made by construction enterprises qualified for general contracts and specialized contracts reached 175.6 billion yuan, up by 12.5 percent, of which the profits made by the state-owned and state-holding enterprises were 50.9 billion yuan, up by 21.8 percent. Their paid taxes were 205.8 billion yuan, up by 20.0 percent, of which the taxes paid by the state-owned and state-holding enterprises were 77.1 billion yuan, up by 24.7 percent.
IV. Investment in Fixed Assets
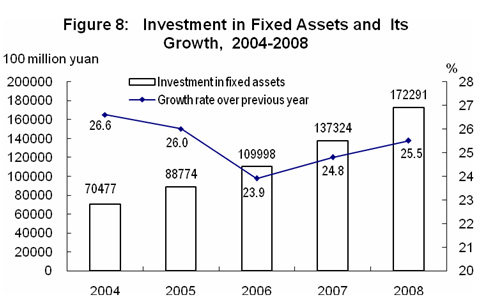
The completed investment in fixed assets of the country in 2008 was 17,229.1 billion yuan, up by 25.5 percent over the previous year. Of the total investment, that in urban areas was 14,816.7 billon yuan, up by 26.1 percent; and that in rural areas reached 2,412.4 billion yuan, up by 21.5 percent. An analysis by regions showed that the investment in east areas was 8,741.2 billion yuan, up by 20.9 percent over the previous year, in central areas was 4,538.4 billion yuan, a growth of 32.6 percent, and in western areas 3,583.9 billion yuan, a growth of 26.9 percent.
In the urban areas, the investment in the primary industry was 225.6 billion yuan, up by 54.5 percent; that in the secondary industry was 6,503.6 billion yuan, up by 28.0 percent; and that in the tertiary industry was 8,087.5 billion yuan, up by 24.1 percent.
Table 4: Fixed Assets Investment in Urban Areas and Its Growth by Sector in 2008
Unit: 100 million yuan
|
Sector |
Investment |
Increase over 2007 (%) |
|
|
|
|
|
Total |
148167 |
26.1 |
|
Agriculture, Forestry, Animal Husbandry and Fishing |
2256 |
54.5 |
|
Mining |
6913 |
31.5 |
|
Of Which: Mining and Washing of Coal |
2411 |
33.6 |
|
Extraction of Petroleum and Natural Gas |
2715 |
22.0 |
|
Manufacturing |
46345 |
30.6 |
|
Of Which: Processing of Food from Agricultural Products |
2058 |
25.7 |
|
Manufacture of Foods |
1137 |
17.8 |
|
Textile Industry |
1534 |
1.3 |
|
Manufacture of Textiles, garments, shoes and hats |
896 |
19.0 |
|
Processing of Petroleum, Coking, Processing Nuclear Fuel |
1832 |
29.4 |
|
Manufacture of Raw Chemical Materials and Chemical Products |
4787 |
35.5 |
|
Manufacture of Non-Metallic Mineral Products |
4113 |
46.6 |
|
Smelting and Pressing of Ferrous Metals |
3240 |
23.8 |
|
Smelting and Pressing of Non-Ferrous Metals |
1854 |
43.1 |
|
Manufacture of Metal Products |
2189 |
38.5 |
|
Manufacture of General Machinery |
3224 |
38.3 |
|
Manufacture of Special Purpose Machinery |
2265 |
34.1 |
|
Manufacture of Transport Equipment |
3787 |
39.1 |
|
Manufacture of Electric Machinery and Equipment |
2334 |
45.1 |
|
Manufacture of Communication Equipment, Computers and Other Electronic Equipment |
2463 |
17.6 |
|
Production and Supply of Electricity, Gas and Water |
10484 |
15.4 |
|
Of Which: Production of Electric Power and Heat Power |
9045 |
14.4 |
|
Construction |
1294 |
30.4 |
|
Transport, Storage and Post |
15552 |
19.7 |
|
Information Transmission, Computer Services and Software |
2130 |
17.1 |
|
Wholesale and Retail Trade |
3166 |
29.2 |
|
Lodging and Catering Services |
1735 |
30.5 |
|
Banking |
247 |
62.6 |
|
Real Estate |
35215 |
23.0 |
|
Leasing and Business Services |
1296 |
50.6 |
|
Scientific Research, Technical Service and Geologic Prospecting |
708 |
35.9 |
|
Water Conservancy, Environment and Public Facilities Management |
12262 |
32.2 |
|
Services to Households and Other Services |
316 |
34.2 |
|
Education |
2355 |
6.0 |
|
Health, Social Security and Social Welfare |
1057 |
30.6 |
|
Culture, Sports and Entertainment |
1423 |
26.0 |
|
Public Management and Social Organization |
3411 |
23.2 |
|
|
|
|
Table 5: Newly Increased Production Capacity through Fixed Assets Investment in 2008
|
Item |
Unit |
Volume |
|
|
|
|
|
Newly increased power generating capacity |
10,000 kilowatts |
9051 |
|
Power transformer equipment with a capacity of over 220 kilovolts |
10,000 kilovolt-amperes |
23222 |
|
New railways put into operation |
Kilometer |
1719 |
|
Double-track railways put into operation |
Kilometer |
1935 |
|
Electrified railways put into operation |
Kilometer |
1955 |
|
New highways |
Kilometer |
99851 |
|
Of which: Expressways |
Kilometer |
6433 |
|
New cargo-handling capacity of berths for over 10000-tonnage ships |
10,000 tons |
33099 |
|
New lines of optical-fiber cables |
10,000 km |
99 |
|
New capacity of digital cellular mobile phone switchboards |
10,000 subscribers |
28855 |
|
|
|
|
In 2008, the investment in real estate development was 3,058.0 billion yuan, up by 20.9 percent. Of this total, the investment in eastern regions was 1,832.5 billion yuan, up by 17.1 percent; that in central China was 628.7 billion yuan, up by 31.7 percent, and that in western regions was 596.7 billion yuan, up by 22.7 percent. Analyzed by engineering purposes, the investment in commercial residential buildings reached 2,208.1 billion yuan, an increase of 22.6 percent, that in office buildings was 111.2 billion yuan, up by 7.4 percent, and that in buildings for commercial business was 320.0 billion yuan, up by 14.9 percent.
Table 6: Main Indicators for Real Estate Development and Sales in 2008
|
Item |
Unit |
Volume |
Increase over 2007 (%) |
|
|
|
|
|
|
Finished Value of Investment |
100 million yuan |
30580 |
20.9 |
|
Of which: residential buildings |
100 million yuan |
22081 |
22.6 |
|
Of which: under 90 square meters |
100 million yuan |
6416 |
50.7 |
|
Of which: economic housing |
100 million yuan |
983 |
19.7 |
|
Floor space of houses under construction |
10000 square meters |
274149 |
16.0 |
|
Of which: residential buildings |
10000 square meters |
216671 |
16.0 |
|
Floor space of houses newly started |
10000 square meters |
97574 |
2.3 |
|
Of which: residential buildings |
10000 square meters |
79889 |
1.4 |
|
Floor space of houses completed |
10000 square meters |
58502 |
-3.5 |
|
Of which: residential buildings |
10000 square meters |
47750 |
-4.2 |
|
Sales of commercial buildings |
10000 square meters |
62089 |
-19.7 |
|
Of which: residential buildings |
10000 square meters |
55886 |
-20.3 |
|
Sources of capital this year |
100 million yuan |
38146 |
1.8 |
|
Of which: domestic loans |
100 million yuan |
7257 |
3.4 |
|
Individual mortgage |
100 million yuan |
3573 |
-29.7 |
|
Land space purchased this year |
10000 square meters |
36785 |
-8.6 |
|
Land space developed this year |
10000 square meters |
26033 |
-5.6 |
|
Purchase of land |
100 million yuan |
5795 |
10.9 |
|
|
|
|
|
V. Domestic Trade
In 2008, the total retail sales of consumer goods reached 10,848.8 billion yuan, up by 21.6 percent over the previous year. An analysis on different areas showed that the retail sales of consumer goods in cities reached 7,373.5 billion yuan, up by 22.1 percent and the retail sales of consumer goods at and below county level was 3,475.3 billion yuan, up by 20.7 percent. Analyzed by different sectors, the sales of the wholesales and retail trade reached 9,119.9 billion yuan, up 21.5 percent; the sales of the lodging and catering industry was 1,540.4 billion yuan, up 24.7 percent, and the sales of the other industries was 188.5 billion yuan, up 3.7 percent.
Of the total retail sales by wholesale and retail enterprises above designated size, the sales of grain and oil was up by 22.7 percent, meat and eggs up by 22.3 percent, clothing up by 25.9 percent, motor vehicles up by 25.3 percent, petroleum and related products up by 39.9 percent, daily necessities up by 17.1 percent, cultural and office goods up by 17.9 percent, telecommunication equipment up by 1.4 percent, electric and electronic appliances for household use and audio-video equipment up by 14.2 percent, building and decoration materials up by 12.0 percent, furniture up 22.6 percent, cosmetics up by 22.1 percent, gold, silver and jewelry up by 38.6 percent and traditional Chinese drugs and western drugs up by 14.8 percent.

VI. Foreign Economic Relations
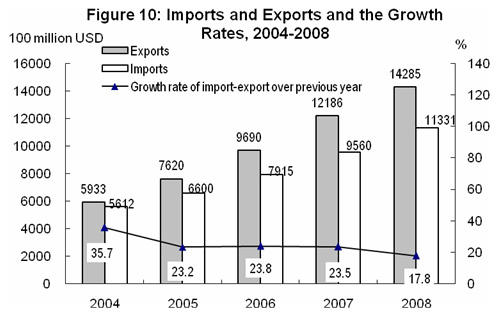
The total value of imports and exports in 2008 reached 2,561.6 billion US dollars, up 17.8 percent over the previous year. Of this total, the value of exports was 1,428.5 billion US dollars, up 17.2 percent, and the value of imports was 1,133.1 billion US dollars, up 18.5 percent. China had a trade surplus (exports minus imports) of 295.5 billion US dollars, an increase of 32.8 billion US dollars over the previous year.
Table 7: Total Value of Imports and Exports and the Growth Rates in 2008
Unit: 100 million USD
|
Item |
Value |
Increase over 2007 (%) |
|
|
|
|
|
Total imports and exports |
25616 |
17.8 |
|
Exports |
14285 |
17.2 |
|
Of which: General trade |
6626 |
22.9 |
|
Processing trade |
6752 |
9.3 |
|
Of which: Mechanical and electronic products |
8229 |
17.3 |
|
High & new-tech products |
4156 |
13.1 |
|
Of which: State-owned |
2572 |
14.4 |
|
Foreign-funded |
7906 |
13.6 |
|
Others |
3807 |
27.9 |
|
Imports |
11331 |
18.5 |
|
Of which: General trade |
5727 |
33.6 |
|
Processing trade |
3784 |
2.7 |
|
Of which: Mechanical and electronic products |
5387 |
7.9 |
|
High & new-tech products |
3419 |
4.3 |
|
Of which: State-owned |
3538 |
31.1 |
|
Foreign-funded |
6200 |
10.8 |
|
Others |
1593 |
25.7 |
|
Trade surplus |
2955 |
--- |
|
|
|
|
Table 8: Main Export Commodities in Volume and Value and the Growth Rates in 2008
|
Item |
Unit |
Volume |
Increase over 2007 (%) |
Value (100 million USD) |
Increase over 2007 (%) |
|
|
|
|
|
|
|
|
Coal |
10000 tons |
4543 |
-14.6 |
52 |
58.9 |
|
Rolled steel |
10000 tons |
5923 |
-5.5 |
634 |
43.8 |
|
Textile yarns and textile articles |
---- |
-- |
-- |
654 |
16.6 |
|
Clothes and clothing accessories |
---- |
-- |
-- |
1198 |
4.1 |
|
Footwear |
---- |
-- |
-- |
297 |
17.2 |
|
Furniture |
---- |
-- |
-- |
269 |
21.5 |
|
Automatic data processing machines and components |
10000 sets |
143236 |
-1.2 |
1350 |
9.1 |
|
Handheld mobiles and car telephones |
10000 sets |
53284 |
10.2 |
385 |
8.2 |
|
Containers |
10000 units |
303 |
-3.3 |
91 |
3.6 |
|
Integrated circuit |
1 million units |
48477 |
19.1 |
243 |
3.3 |
|
Liquid crystal display panels |
10000 units |
202666 |
7.8 |
224 |
13.9 |
|
Motor vehicles (including a complete set of spare sets) |
10000 sets |
64 |
9.4 |
89 |
32.5 |
|
|
|
|
|
|
|
Table 9: Main Import Commodities in Volume and Value and the Growth Rates in 2008
|
Item |
Volume (10000 tons) |
Increase over 2007 (%) |
Value (100 million USD) |
Increase over 2007 (%) |
|
|
|
|
|
|
|
Cereals and cereal flour |
154 |
-1.0 |
7 |
37.0 |
|
Soybean |
3744 |
21.5 |
218 |
90.1 |
|
Edible vegetable oil |
816 |
-2.6 |
90 |
44.0 |
|
Natural rubber (including latex) |
168 |
2.0 |
43 |
32.0 |
|
Synthetic rubber (including latex) |
120 |
-15.0 |
33 |
17.5 |
|
Iron ore |
44356 |
15.9 |
605 |
79.1 |
|
Aluminum oxide |
459 |
-10.5 |
18 |
-9.7 |
|
Crude oil |
17888 |
9.6 |
1293 |
62.0 |
|
Petroleum products refined |
3885 |
15.0 |
300 |
82.7 |
|
Plastics in primary forms |
1771 |
-6.7 |
341 |
5.3 |
|
Paper pulp |
952 |
12.4 |
67 |
20.9 |
|
Rolled steel |
1543 |
-8.6 |
234 |
14.0 |
|
Copper and copper alloys |
264 |
-5.1 |
192 |
-2.3 |
|
|
|
|
|
|
Table 10: Imports and Exports by Major Countries and Regions and the Growth Rates in 2008
Unit: 100 million USD
|
Country or region |
Exports |
Increase over 2007 (%) |
Imports |
Increase over 2007 (%) |
|
|
|
|
|
|
|
European Union |
2929 |
19.5 |
1327 |
19.6 |
|
United States |
2523 |
8.4 |
814 |
17.4 |
|
Hong Kong, China |
1907 |
3.4 |
129 |
0.9 |
|
Japan |
1161 |
13.8 |
1507 |
12.5 |
|
ASEAN |
1141 |
20.7 |
1170 |
7.9 |
|
Republic of Korea |
740 |
31.0 |
1122 |
8.1 |
|
Russia |
330 |
15.9 |
238 |
21.0 |
|
India |
315 |
31.2 |
203 |
38.7 |
|
Taiwan, China |
259 |
10.3 |
1033 |
2.3 |
|
|
|
|
|
|
The year 2008 witnessed the establishment of 27,514 enterprises with foreign direct investment in non-financial sectors, down by 27.3 percent; and the foreign capital actually utilized was 92.4 billion US dollars, up by 23.6 percent. Of the total foreign direct investment actually utilized, the share of investment in manufacturing was 54.0 percent over the pervious year, the real estate 20.1 percent, leasing and business service 5.5 percent, wholesales and retail trade 4.8 percent and transportation, storage and post service 3.1 percent.
Table 11: Total Value of Foreign Direct Investment and the Growth Rates in 2008
|
Sector |
Enterprises |
Increase over 2007 (%) |
Actually Utilized Value (100 million USD) |
Increase over 2007 (%) |
|
|
|
|
|
|
|
Total |
27514 |
-27.3 |
924.0 |
23.6 |
|
Farming, Forestry, Animal Husbandry and Fishery |
917 |
-12.5 |
11.9 |
28.9 |
|
Mining and Quarrying |
149 |
-36.3 |
5.7 |
17.0 |
|
Manufacturing |
11568 |
-39.7 |
498.9 |
22.1 |
|
Production and Supply of Electricity, Gas and Water |
320 |
-9.1 |
17.0 |
58.1 |
|
Construction |
262 |
-14.9 |
10.9 |
151.6 |
|
Transport, Storage, Post and Telecommunication Services |
523 |
-20.5 |
28.5 |
42.1 |
|
Information Transmission, Computer Services and Software |
1286 |
-7.6 |
27.7 |
86.8 |
|
Wholesales & Retail Trade |
5854 |
-7.6 |
44.3 |
65.6 |
|
Lodging & Catering Services |
633 |
-32.5 |
9.4 |
-9.9 |
|
Banking |
25 |
-51.0 |
5.7 |
122.5 |
|
Real Estate |
452 |
-68.7 |
185.9 |
8.8 |
|
Leasing and Business Services |
3138 |
-11.3 |
50.6 |
25.9 |
|
Scientific Research, Technical Services and Geological Prospecting |
1839 |
7.2 |
15.1 |
64.2 |
|
Water Conservancy, Environment Protection and Public Facilities Management |
138 |
-10.4 |
3.4 |
24.7 |
|
Services to Households and Other Services |
205 |
-24.1 |
5.7 |
-21.1 |
|
Education |
24 |
60.0 |
0.4 |
12.2 |
|
Health, Social Security and Social Welfare |
10 |
-23.1 |
0.2 |
63.1 |
|
Culture, Sports and Entertainment |
170 |
-17.9 |
2.6 |
-42.8 |
|
Public Management and Social Organization |
1 |
-- |
0.0 |
-- |
|
International Organization |
-- |
-- |
6.0 |
-- |
|
|
|
|
|
|
In 2008, the overseas direct investment (non-financial sectors) by Chinese investors was 40.7 billion US dollars, up by 63.6 percent over the previous year.
In 2008, the accomplished business revenue through contracted overseas engineering projects was 56.6 billion US dollars, up by 39.4 percent, and the business revenue through overseas labor contracts was 8.1 billion US dollars, up by 19.1 percent over the previous year.
VII. Transportation, Post, Telecommunications and Tourism
The value added of the transportation, storage, post and telecommunication sectors reached 1,659.0 billion yuan in 2008, up 7.6 percent over the previous year.
Table 12: Freight Traffic by All Means of Transportation and the Growth Rates in 2008
|
Item |
Unit |
Volume |
Increase over 2007 (%) | |
|
|
|
|
|
|
|
Total freight traffic |
100 million tons |
249.0 |
9.4 |
|
|
Railways |
100 million tons |
33.1 |
4.7 |
|
|
Highways |
100 million tons |
181.7 |
10.9 |
|
|
Waterways |
100 million tons |
29.7 |
5.7 |
|
|
Civil aviation |
10 000 tons |
407.6 |
1.4 |
|
|
Pipelines |
100 million tons |
4.5 |
15.4 |
|
Freight flows |
100 million ton-kilometers |
105512.9 |
3.8 |
|
|
Railways |
100 million ton-kilometers |
25111.8 |
3.7 |
|
|
Highways |
100 million ton-kilometers |
12998.5 |
14.5 |
|
|
Waterways |
100 million ton-kilometers |
65218.2 |
1.5 |
|
|
Civil aviation |
100 million ton-kilometers |
119.6 |
2.8 |
|
|
Pipelines |
100 million ton-kilometers |
2064.7 |
19.5 |
|
|
|
|
|
|
|
Table 13: Passenger Traffic by All Means of Transportation and the Growth Rates in 2008
|
Item |
Unit |
Volume |
Increase over 2007 (%) |
|
|
|
|
|
|
Total passenger traffic |
100 million persons |
239.7 |
7.8 |
|
Railways |
100 million persons |
14.6 |
11.0 |
|
Highways |
100 million persons |
220.7 |
7.6 |
|
Waterways |
100 million persons |
2.4 |
6.0 |
|
Civil aviation |
10 000 persons |
1.9 |
3.6 |
Passenger flows |
100 million person-kilometers |
23372.2 |
8.2 |
|
Railways |
100 million person-kilometers |
7778.6 |
7.8 |
|
Highways |
100 million person-kilometers |
12636.0 |
9.8 |
|
Waterways |
100 million person-kilometers |
74.8 |
-3.8 |
|
Civil aviation |
100 million person-kilometers |
2882.8 |
3.3 |
|
|
|
|
|
The volume of freight handled by ports above the designated size throughout the year totaled 5.87 billion tons, up 11.5 percent over the previous year, of which freight for foreign trade was 1.92 billion tons, up 7.0 percent. Container shipping handled 128.35 million standard containers, up by 12.2 percent.
The total number of motor vehicles for civilian use reached 64.67 million (including 14.92 million tri-wheel motor vehicles and low-speed trucks) by the end of 2008, up 13.5 percent, of which private-owned vehicles numbered 41.73 million, up 18.1 percent. The total number of cars for civilian use stood at 24.38 million, up by 24.5 percent, of which private-owned cars numbered 19.47 million, up by 28.0 percent.
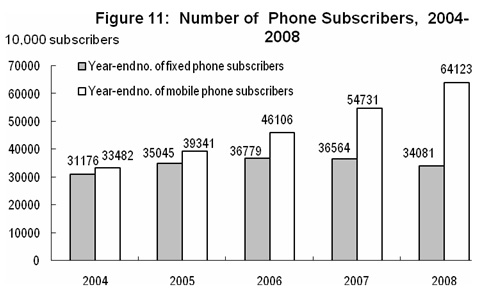
The turnover of post and telecommunication services totaled 2,384.1 billion yuan, up 20.7 percent over the previous year. Of this total, post services accounted for 140.2 billion yuan, up 15.5 percent, and telecommunication services 2,244.0 billion yuan, up 21.0 percent. By the end of 2008, with a decrease of 1.56 million lines of office switchboards, the total capacity reached 510 million lines. The year also saw 340.81 million fixed telephone subscribers. This included 232.00 million urban subscribers and 108.81 million rural subscribers. Mobile phone users numbered 641.23 million by the end of 2008, with 93.92 million new subscribers in the year. In total, the number of fixed and mobile phone users reached 982.04 million, an increase of 69.09 million as compared with that at the end of 2007. Phone coverage is 74.3 sets per 100 persons. The number of Internet users was 300 million and wide-band users reached 270 million.
In 2008, the number of inbound visitors to China totaled 130.03 million, a year-on-year decline of 1.4 percent. Of this total, 24.33 million were foreigners, down 6.8 percent; and 105.70 million were Chinese compatriots from Hong Kong, Macao and Taiwan, down 0.1 percent. Of all the inbound tourists, overnight visitors counted 53.05 million, down 3.1 percent. Foreign exchange earnings from international tourism topped 40.8 billion US dollars, down 2.6 percent. The number of China’s outbound visitors totaled 45.84 million, up 11.9 percent. Of this total, 40.13 million were on private visits, a year-on-year rise of 14.9 percent, or 87.5 percent of all outgoing visitors. The year 2008 saw 1.71 billion domestic tourists, up 6.3 percent. The revenue from domestic tourism totaled 874.9 billion yuan, up 12.6 percent.
VIII. Financial Intermediation
By the end of 2008, money supply of broad sense (M2) was 47.5 trillion yuan, reflecting a year-on-year increase of 17.8 percent. Money supply of narrow sense (M1) was 16.6 trillion yuan, up 9.1 percent. Cash in circulation (M0) was 3.4 trillion yuan, up 12.7 percent. Savings deposit in Renminbi and foreign currencies in all items of financial institutions totaled 47.8 trillion yuan at the end of 2008, up 19.3 percent. Loans in Renminbi and foreign currencies in all items of financial institutions reached 32.0 trillion yuan, up 17.9 percent.
Table 14: Savings Deposit and Loans in RMB and Foreign Currencies in All Financial Institutions and the Growth Rates in 2008
Unit: 100 million yuan
|
Item |
Year-end figure |
Increase over 2007 (%) |
|
|
|
|
|
Savings deposit |
478444 |
19.3 |
|
Of which: By enterprises |
164386 |
13.5 |
|
By urban and rural households |
221503 |
25.7 |
|
Of which: Deposits in RMB |
217885 |
26.3 |
|
Loans |
320049 |
17.9 |
|
Of which: Short-term |
128571 |
12.3 |
|
Medium and long-term |
164160 |
20.2 |
|
|
|
|

Loans in Renminbi from rural financial cooperation institutions (i.e. rural credit cooperatives, rural cooperation banks, and rural commercial banks) totaled 3.7 trillion yuan by the end of 2008, an increase of 590.8 billion yuan as compared with the beginning of 2008. The loans in Renminbi for consumption use from all financial institutions totaled 3.7 trillion yuan, an increase of 460.9 billion yuan. Of all consumption loans, short-term loans for individuals totaled 0.4 trillion yuan, an increase of 103.5 billion yuan, and medium- and long-term loans for individuals reached 3.3 trillion yuan, an increase of 357.5 billion yuan.
Funds raised in 2008 by enterprises through issuing stocks and share rights on stock market amounted to 339.6 billion yuan, a decline of 394.7 billion yuan over the previous year. Of this total, 75 A-shares were issued, receiving 106.6 billion yuan worth of capital altogether, a decline of 348.7 billion yuan. The refinancing of A-shares (including rationing shares, public newly issued, nonpublic newly issued and warrants) received 133.2 billion yuan worth of capital altogether, a decrease of 104.6 billion yuan over 2007. The listed companies financed 99.8 billion yuan through convertible bonds, bonds with attached warrants and corporate bonds, an increase of 58.7 billion yuan.
The total corporate bonds issued throughout the year reached 2,052.0 billion yuan, an increase of 343.7 billion yuan over 2007. Of this total, the financial bonds were 1,179.7 billion yuan, a drop of 11.6 billion yuan; the enterprise (corporate) bonds were 265.5 billion yuan, an increase of 83.4 billion yuan; the short-term financing funds were 433.2 billion yuan, an increase of 98.2 billion yuan; and the medium-term notes were 173.7 billion yuan, an increase of 173.7 billion yuan.
The premium received by the insurance companies totaled 978.4 billion yuan in 2008, up 39.1 percent over the previous year. Of this total, life insurance premium amounted to 665.8 billion yuan, health and casualty insurance premium 78.9 billion yuan, and property insurance premium 233.7 billion yuan. Insurance companies paid an indemnity worth of 297.1 billion yuan, of which, life insurance indemnity was 131.5 billion yuan, health and casualty insurance indemnity 23.8 billion yuan, and property insurance indemnity 141.8 billion yuan.
IX. Education, Science and Technology
In 2008, the post-graduate education enrollment was 1.283 million students with 446 thousand new students and 345 thousand graduates. The general tertiary education enrollment was 20.210 million students with 6.077 million new students and 5.120 million graduates. Vocational secondary schools of various types had 20.563 million enrolled students, including 8.100 million new entrants, and 5.706 million graduates. Senior secondary schools had 24.763 million enrolled students, including 8.370 million new entrants, and 8.361 million graduates. Students enrolled in junior secondary schools totaled 55.742 million, including 18.562 million new entrants, and 18.629 million graduates. The country had a primary education enrollment of 103.315 million students, including 16.957 million new entrants, and 18.650 million graduates. There were 417 thousand students enrolled in special education schools, with 62 thousand new entrants. Kindergartens accommodated 24.750 million children.

The amount of expenditures on research and development activities (R&D) was worth 457.0 billion yuan in 2008, up 23.2 percent over 2007, accounting for 1.52 percent of GDP. Of this total, 20.0 billion yuan was appropriated for fundamental research programs. A total number of 922 projects under the National Key Technology Research and Development Program and 1,205 projects under the Hi-tech Research and Development Program (the 863 Program) were implemented. The year 2008 saw the establishment of 7 new national engineering research centers and 51 national engineering laboratories. The number of state validated enterprise technical centers reached 575 by the end of the year. The technical centers at the provincial level numbered 4,886. Some 828 thousand patent applications were accepted from home and abroad, of which 717 thousand were domestic applications, accounting for 86.6 percent of the total. A total number of 290 thousand patent applications for new inventions were accepted, of which 195 thousand were from domestic applicants or 67.1 percent of the total. A total of 412 thousand patents were authorized in 2008, of which 352 thousand were domestic patents, accounting for 85.5 percent of the total. A total of 94 thousand patents for new inventions were authorized, of which 47 thousand were domestic ones, accounting for 49.7 percent. Till the end of year 2008, the number of patents in force was 1.195 million, of which 925 thousand patents were domestic ones, accounting for 77.4 percent; the number of patents in force for inventions was 337 thousand, of which 128 thousand was domestic ones, accounting for 37.9 percent. A total of 226 thousand technology transfer contracts were signed, representing 266.5 billion yuan in value, up 19.7 percent over the previous year. The year 2008 saw 11 times of successful launch of satellites and Shenzhou-7 manned spacecraft was launched successfully.
By the end of 2008, there were altogether 24,300 laboratories for product inspection, including 376 national inspection centers. There were 170 organizations for product certification and management system certification, which accumulatively certified products in 38 thousand enterprises. A total of 3,701 authorized measurement institutions enforced compulsory inspection on 41.90 million measurement instruments in the year. A total of 6,373 national standards were developed or revised in the year, including 2,714 new standards. There were 1,314 seismological monitor stations and 31 seismological remote monitor network stations. The numbers of oceanic observation stations were 67 and oceanic monitor spots reached 9,200. Mapping departments published 1,834 maps and 309 mapping books.
X. Culture, Public Health and Sports
At the end of 2008, there were 2,575 art-performing groups, 3,171 culture centers, 2,825 public libraries, 1,798 museums, 257 radio broadcasting stations, 277 television stations, 2,069 radio broadcasting and television stations and 45 educational television stations throughout China. Subscribers to cable television programs numbered 163.42 million. Subscribers to digital cable television programs were 45.03 million. Radio broadcasting and television broadcasting coverage rates were 96.0 percent and 97.0 percent respectively. The country produced 406 feature movies and 73 science, educational, documentary, cartoon and special movies. A total of 44.5 billion copies of newspapers and 3.0 billion copies of magazines were issued, and 6.9 billion copies of books published. By the end of the year, there were 3,987 archives in China and 72.67 million documents were made accessible to the public.
By the end of 2008, there were 300 thousand health institutions in China, including 60 thousand general hospitals and health centers, 28 thousand community health service centers, 3,020 maternal and child health-care institutions, 1,344 specialized health institutions, 3,560 epidemic disease prevention centers (stations) and 2,591 health monitoring institutions. There were 4.92 million health workers in China, including 2.05 million practicing doctors and assistant practicing doctors and 1.62 million registered nurses. General hospitals and health centers in China possessed 3.69 million beds. The number of rural health care centers was 39 thousand, possessing 820 thousand beds and employing 874 thousand health care workers. In 2008, 3.541 million people were infected by A or B class infectious diseases, with 12,433 reported deaths. The incidence of infectious disease was 268.01 per 100 thousand, with the death rate standing at 0.94 per 100 thousand.
In 2008, Chinese athletes won 120 world championships on 24 sports events. Eleven athletes and 2 teams broke 16 world records on 16 occasions. On the 2008 Summer Olympic Games, China won 51 gold medals, 21 silver medals and 28 bronze medals, totaled 100 medals, topping the gold medal tally and winning the second in the overall medal table. On Beijing Para Olympic Games, China’s athletes won 89 gold medals, 70 silver medals and 52 bronze medals, topping again both the gold medal tally and overall medal standings. The amateur sports activities were carried out vigorously.
XI. Population, Living Conditions and Social Security
At the end of 2008, the total number of Chinese population reached 1,328.02 million, an increase of 6.73 million over that at the end of 2007. The year 2008 saw 16.08 million births, a crude birth rate of 12.14 per thousand, and 9.35 million deaths, or a crude death rate of 7.06 per thousand. The natural growth rate was 5.08 per thousand. The sex ratio at birth was 120.56.
Table 15: Composition of Population in 2008
Unit:10,000 persons
|
Items |
Population (Year-end figure) |
Percentage (%) | |
|
|
|
|
|
|
National Total |
132802 |
100.0 |
|
|
Of which: Urban |
60667 |
45.7 |
|
|
Rural |
72135 |
54.3 |
|
|
Of which: Male |
68357 |
51.5 |
|
|
Female |
64445 |
48.5 |
|
|
Of which: 0-14 years |
25166 |
19.0 |
|
|
15-59 years |
91647 |
69.0 |
|
|
60 years |
15989 |
12.0 |
|
|
Of which: 65 years and over |
10956 |
8.3 |
|
|
|
|
|
|
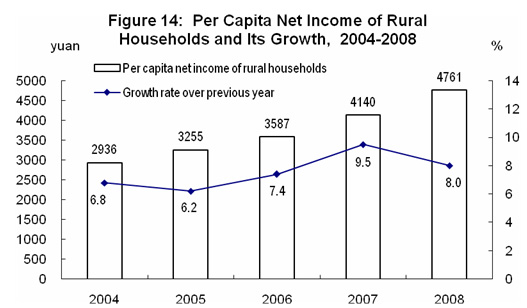
In 2008, the annual per capita net income of rural households was 4,761 yuan, or a real increase of 8.0 percent over the previous year when the factors of price increase were deducted. The annual per capita disposable income of urban households was 15,781 yuan, or a real increase of 8.4 percent. The proportion of expenditure on food to the total expenditure of households was 43.7 percent for rural households and 37.9 percent for urban households. According to the 2008 rural poverty line with annual per capita net income below 1,196 yuan, the population in poverty in rural areas numbered 40.07 million at the end of the year.

At the end of 2008, a total of 218.90 million people participated in basic pension program, a year-on-year increase of 17.53 million. Of this total, 165.97 million were staff and workers, and 52.93 million were retirees. A total of 316.98 million people participated in urban basic health insurance program, an increase of 93.87 million, of whom 200.48 million people participated in urban basic health insurance program for staff and workers, 116.50 million people participated in programs for residents. A total of 42.49 million people participated in urban health insurance programs were migrant workers coming from the rural areas, an increase of 11.18 million. Some 124.00 million people participated in unemployment insurance programs, an increase of 7.55 million. A total of 138.10 million people participated in work accident insurance, an increase of 16.37 million, of which 49.76 million were migrant workers coming from the rural areas, an increase of 9.96 million. A total of 91.81 million people participated in maternity insurance programs, an increase of 14.06 million. A total of 2,729 counties (cities, districts) conducted the new cooperative medical care system in rural areas, with a participation rate of 91.5 percent. The total expenditure of the new cooperative medical care system in rural areas reached 42.9 billion yuan, benefiting 370 million people. In 2008, the urban medical assistance helped 5.13 million people, up by 16.0 percent. The rural medical assistance helped 9.36 million people, up by 148.0 percent. A total of 27.80 million people were funded by the civil affairs departments in the rural cooperative medical care system.
The number of people receiving unemployment insurance payment stood at 2.61 million. A total of 23.34 million urban residents received the government minimum living allowances, or 620 thousand more than the previous year. About 42.91 million rural residents received the government minimum living allowance, an increase of 7.25 million.
Social welfare institutions of various types provided 2.35 million beds by the end of 2008, accommodating 1.89 million inmates. There were 109 thousand community service facilities and 9,871 comprehensive community service centers were set up in urban areas. A total of 60.4 billion yuan worth of social welfare lottery tickets were sold, raising 21.1 billion yuan of social welfare funds. A total of 48.2 billion yuan were received from direct donations.
XII. Resources, Environment and Work Safety
A total of 191.6 thousand hectares of cultivated land was used for construction purpose in 2008. An area of 24.8 thousand hectares of cultivated land was destroyed by disasters, 7.6 thousand hectares of farmland was converted into land for ecological preservation. The structural adjustment to agriculture led to a reduction of 24.9 thousand hectares of cultivated land. Land reclamation and re-development programs added 229.6 thousand hectares of cultivated land. As a result, the year 2008 witnessed a net reduction of 19.3 thousand hectares of cultivated land.
The total stock of water resources in 2008 was 2,712.7 billion cubic meters, a year-on-year increase of 7.4 percent, or 2,048 cubic meters in per capita terms, up by 6.9 percent. The annual average precipitation was 659 millimeters, up by 8.0 percent. Large reservoirs in China stored 196.2 billion cubic meters of water at the end of 2008, 9.3 billion cubic meters more than that at the end of 2007. Total water consumption went up by 0.4 percent to reach 584.0 billion cubic meters, of which water consumption for living purposes rose by 0.6 percent, for industrial use up by 1.8 percent, for agricultural use down by 0.2 percent, and for ecological water supplement down by 0.7 percent. Water consumption for every 10 thousand yuan worth of GDP produced was 231.8 cubic meters, a decline of 7.9 percent. Water consumption for every 10 thousand yuan worth of industrial value added was 130.3 cubic meters, down by 7.0 percent. Per capita water consumption was 440.9 cubic meters, down by 0.1 percent.
National land surveys and geological explorations discovered a total of 209 new mineral deposits in large or medium size, including 38 energy mineral deposits, 90 metallic mineral deposits, 79 non-metallic mineral deposits and 2 aqueous and gaseous deposits. Increased reserves were found for 57 minerals, including 1.34 billion tons of crude oil, 647.2 billion cubic meters of natural gas and 23.11 billion tons of coal.
A total of 4.77 million hectares of forest were planted, of which 3.29 million were afforested by manpower. Some 3.12 million hectares were afforested through key afforestation projects, accounting for 65.4 percent of the total planted area of the year. About 2.31 billion trees were planted in 2008 by volunteers. By the end of 2008, there were 2,538 natural reserves including 303 national ones. A total of 47 thousand square kilometers of eroded land were put under comprehensive treatment programs, and 26 thousand square kilometers of land were closed for nurture and protection in areas suffering water and soil erosion.
Preliminary estimation indicated that the total energy consumption in 2008 amounted to 2.85 billion tons of standard coal equivalent, up 4.0 percent over 2007. The consumption of coal was 2.74 billion tons, up 3.0 percent; crude oil 360 million tons, up 5.1 percent; natural gas 80.7 billion cubic meters, up 10.1 percent; and electric power 3,450.2 billion kilowatt hours, up 5.6 percent. The national energy consumption per 10,000 yuan went down by 4.59 percent. The consumption of major kinds of raw materials included 540 million tons of rolled steel, up 4.2 percent; 5.38 million tons of copper, up by 6.9 percent; 12.60 million tons of electrolytic aluminum, up by 4.3 percent; 9.98 million tons of ethylene, down by 2.9 percent; and 1.37 billion tons of cement, up 3.5 percent.
Monitoring of water quality on 409 sections of the 7 major water systems in China showed that 55.0 percent of the sections met the national quality standard from Grade I to Grade III for surface water, up by 5.1 percentage points; and 20.8 percent were worse than Grade V, down by 2.8 percentage points compared with that in the previous year. Generally, the water quality in the 7 major water systems continued to improve with some river basins still having serious pollution.
Monitoring of oceanic water quality at 301 offshore monitoring stations indicated that oceanic water met the national quality standard Grade I and II in 70.4 percent of the stations, up by 7.6 percentage points from the previous year; water quality at 11.3 percent of the stations met Grade III standard, down by 0.5 percentage points; and water of Grade IV or inferior quality was found at 18.3 percent of the stations, down by 7.0 percentage points. A total of 137 thousand square kilometers of oceanic waters did not meet the quality standard for clean oceanic water, a decrease of 8 thousand square kilometers. Of this total, seriously polluted oceanic area occupied 25 thousand square kilometers. Seriously polluted oceanic area in Bohai Sea occupied 3 thousand square kilometers.
In the 519 cities covered by air quality monitoring program, 399 cities reached or topped air quality standard Grade II, accounting for 76.9 percent of all cities under the program; 113 cities attained Grade III, accounting for 21.8 percent; and air quality in 7 cities was inferior to Grade III, accounting for 1.3 percent. Of the 392 cities subject to noise monitoring program, 7.9 percent enjoyed fairly good environment, 63.8 percent had good environment, 27.0 percent had light noise pollution, and 1.3 percent experienced medium noise pollution in downtown areas.
The average temperature in 2008 was 9.6℃, which was 0.5℃ lower than that in previous year. Typhoon hit China 10 times in 2008, 2 more compared with that in 2007.
At the end of 2008, the daily treatment capacity of city sewage reached 82.95 million cubic meters, up 16.1 percent over that in 2007. City sewage treatment rate was 65.3 percent, up 2.4 percentage points. The floor space with central heating systems amounted to 3.21 billion square meters, up 6.6 percent. Greenery coverage reached 31.6 percent of the urban area, up 0.3 percentage point.
In 2008, natural disasters caused 1,175.2 billion yuan worth of direct economic loss, 4.0 times more than that in previous year. Natural disasters hit 39.99 million hectares of crops, down 18.4 percent, of which 4.03 million hectares of crops was demolished, down 29.8 percent. The year 2008 witnessed 13 thousand forest fires, up by 45.2 percent. Floods and waterlog caused a direct economic loss of 63.5 billion yuan, down by 23.1 percent and left a death roll of 686, down by 41.3 percent. Drought caused a direct economic loss of 30.7 billion yuan, down by 60.9 percent. Oceanic disasters caused a direct economic loss of 20.6 billion yuan, increased by 1.3 times. The occurrence of red tides hit an accumulative area of 13,738 square kilometers, up by 18.3 percent. Disasters from low temperature, frost and snow made a total direct economic loss of 159.5 billion yuan with a death roll of 162. China registered 27 thousand geological disasters which left a death doll of 656 and made a total direct economic loss of 18.37 billion yuan. The country recorded 87 earthquakes with magnitude 5 and over, 17 of which caused disasters, causing a direct economic loss of 852.3 billion yuan and leaving a death roll of 70 thousand. Of this total, Sichuan Wenchuan Earthquake recorded 8.0-magnitude, causing a direct economic loss of 845.1 billion yuan.
The death toll due to work accidents amounted to 91,172 people, a year-on-year decrease of 10.2 percent. The death toll from work accidents every 100 million yuan worth of GDP was 0.312 people, a decline of 24.5 percent. Work accidents in industrial, mining and commercial enterprises caused 2.82 deaths out of every 100 thousand employees, down 7.5 percent. The death toll for producing one million tons of coal in coalmines was 1.182 persons, down 20.4 percent. The year 2008 witnessed 265 thousand traffic accidents, claiming 73 thousand lives, injuring 305 thousand people and causing a direct property loss of 1.01 billion yuan. The road traffic death toll per 10 thousand vehicles was 4.3 persons, a decrease of 0.8 person.
Notes:
1. All figures in this Communiqué are preliminary statistics.
2. Statistics in this Communiqué do not include Hong Kong SAR, Macao SAR and Taiwan Province.
3. Due to the rounding-off reasons, the subentries may not add up to the aggregate totals.
4. Gross domestic product (GDP) and value added as quoted in this Communiqué are calculated at current prices, whereas their growth rates are at constant prices.
5. Six highly energy-consuming industries are: manufacture of raw chemical materials and chemical products, manufacture of non-metallic mineral products, smelting and pressing of ferrous metals, smelting and pressing of non-ferrous metals, oil processing, coking and nuclear fuel processing, and production and supply of electricity and heat.
6. Output and consumption of rolled steel include duplicated counting of rolled steel as intermediate inputs used for producing other types of rolled steel.
7. The national total of fixed assets investment is larger than the aggregate sum by adding up the subtotals of fixed assets investment in the eastern areas, central areas, and western areas due to the fact that some of the trans-regional investments are not covered by regional figures.
8. The investment in real estate includes the investment made in real estate development, construction of buildings for own use, property management, intermediary services and other real estate development.
9. The original premium income received by the insurance companies refers to the premium income from original insurance contracts confirmed by the insurance companies.
10. The number of people covered in urban basic health insurance programs for urban staff and workers include staff and workers and retirees insured. The urban basic health insurance programs for urban residents refer to urban non-employed residents who are not covered by the urban basic health insurance programs for staff and workers.
11. Statistics on poverty population in rural areas are based on the newly revised rural poverty line, which is incomparable with historical data.
12. The consumption of water for producing 10 thousand yuan worth of GDP is calculated at 2005 constant prices. The turnover of post and telecommunication services is calculated at constant prices of 2000.