Statistical Communiqué of the People's Republic of China on the 2007
National Economic and Social Development
National Bureau of Statistics of
February 28, 2008
In 2007, under the leadership of the CPC Central Committee and the State Council, the people of all nationalities of China, taking as the guidance of Deng Xiaoping Theory and the important thought of “Three Represents”, implemented earnestly the scientific approach to the economic and social development, they united as one with enterprising spirit, national economic and social development achieved new progress.
I. General Outlook
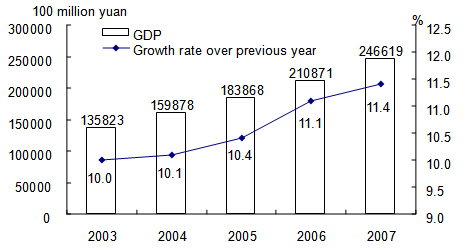
In 2007, the gross domestic product (GDP) of the year was 24,661.9 billion yuan, up by 11.4 percent over the previous year. Analyzed by different industries, the value added of the primary industry was 2,891.0 billion yuan, up by 3.7 percent, that of the secondary industry was 12,138.1 billion yuan, up by 13.4 percent and the tertiary industry was 9,632.8 billion yuan, up by 11.4 percent. The value added of the primary industry accounted for 11.7 percent of the GDP, maintaining the same level of the pervious year, that of the secondary industry accounted for 49.2 percent, up by 0.3 percentage point, and that of the tertiary industry accounted for 39.1 percent, down by 0.3 percentage point. Quarterly data showed that the GDP growth in the first quarter of the year was 11.1 percent; second quarter 11.9 percent, third quarter 11.5 percent and 11.2 percent growth for the fourth quarter.
Figure 1: Gross Domestic Product and its Growth, 2003-2007
The general level of consumer prices in
Figure 2: Changes in Consumer Prices, 2003-2007
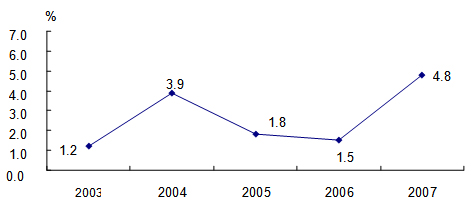
Table 1: General Level of Consumer Prices in 2007
|
Item |
National |
| |
|
Urban |
Rural | ||
|
|
|
|
|
|
General level of consumer prices |
4.8 |
4.5 |
5.4 |
|
Food |
12.3 |
11.7 |
13.6 |
|
Of Which: Grain |
6.3 |
6.4 |
6.2 |
|
Meat, poultry and related products |
31.7 |
31.6 |
31.8 |
|
Oil |
26.7 |
25.5 |
28.3 |
|
Fresh eggs |
22.9 |
23.0 |
22.8 |
|
Fresh vegetables |
7.3 |
6.6 |
9.4 |
|
Fresh fruits |
0.1 |
-0.2 |
1.0 |
|
Tobaccos and alcohols |
1.7 |
1.8 |
1.6 |
|
Clothing |
-0.6 |
-0.9 |
0.2 |
|
Household appliances and services |
1.9 |
1.9 |
2.1 |
|
Medical, health and personal articles |
2.1 |
1.7 |
2.8 |
|
Transportation and telecommunications |
-0.9 |
-1.6 |
0.6 |
|
Recreational, educational, cultural articles and services |
-1.0 |
-0.7 |
-1.6 |
|
Housing |
4.5 |
4.5 |
4.4 |
|
|
|
|
|
At the end of 2007, the total of employed people in
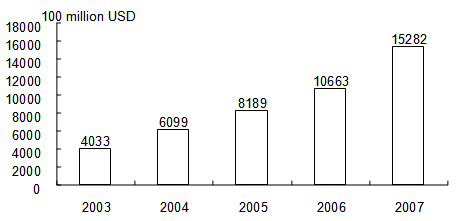
At the end of 2007,
Figure 3: Year-end Foreign Exchange Reserves, 2003-2007
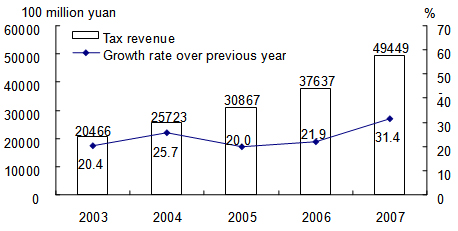
The taxes collected in the whole year reached 4,944.9 billion yuan (excluding tariffs, farm land taxes and deed taxes), up by 31.4 percent or an increase of 1,181.3 billion yuan over 2006.
Figure 4: Tax Revenue and its Growth, 2003-2007
II. Agriculture
In 2007, the sown area of grain was 105.53 million hectares, an increase of 700 thousand hectares as compared with that in the previous year; the sown area of cotton was 5.59 million hectares, an increase of 70 thousand hectares; the sown area of oil-bearing crops was 10.94 million hectares, a decline of 600 thousand hectares; the sown area of sugar crops was 1.67 million hectares, an increase of 100 thousand hectares.
The total output of grain in 2007 was 501.50 million tons, an increase of 3.50 million tons or up by 0.7 percent over the previous year. Of this total, the output of summer crops was 115.34 million tons, up by 1.3 percent, and that of the early rice was 31.96 million tons, up by 0.3 percent. The output of autumn grain was 354.20 million tons, an increase of 0.6 percent.
Figure 5: Output of Grain and its Growth, 2003-2007
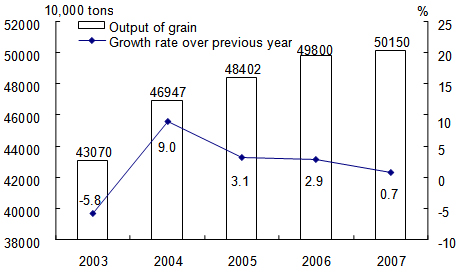
In 2007, the output of cotton was 7.60 million tons, a growth of 1.3 percent over the previous year, that of oil-bearing crops was 24.61 million tons, down by 4.2 percent and that of sugar crops was 111.10 million tons, an increase of 11.4 percent, that of tobacco was 2.39 million tons, down by 3.9 percent, and that of tea was 1.14 million tons, up by 10.9 percent.
The total output of meat for the year reached 68.00 million tons, down by 3.5 percent. Of this total, the output of pork was down by 9.2 percent, and that of beef and mutton went up by 6.1 percent and 5.8 percent respectively. The total output of aquatic products was 47.37 million tons, up by 3.3 percent. The total production of timber for the year 2007 reached 69.74 million cubic meters, an increase of 5.5 percent.
Over 1.07 million hectares of farmland was increased with effective irrigation systems and another additional 1.36 million hectares of farmland was guaranteed by water-saving irrigation systems.
III. Industry and Construction
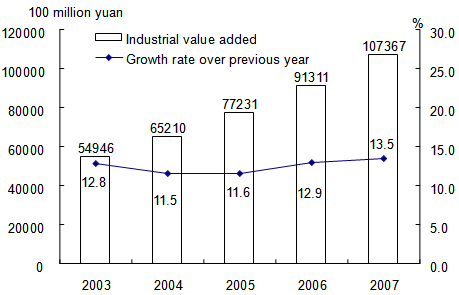
In 2007, the total value added of the industrial sector was 10,736.7 billion yuan, up by 13.5 percent over the previous year. The value added of industrial enterprises above the designated size was up by 18.5 percent. of this total, that of the state-owned and state-holding enterprises grew by 13.8 percent, that of the collective enterprises went up by 11.5 percent, that of the share-holding enterprises increased by 20.6 percent, that of the enterprises by foreign investors and investors from
Figure 6: Industrial Value Added and its Growth, 2003-2007
In 2007, of the industrial enterprises above designated size, the growth of value added for the mining and washing of coal industry was18.1 percent over the previous year, for the extraction of petroleum and natural gas was 3.9 percent, for textile industry 16.2 percent, for processing of food from agricultural product 16.9 percent, for manufacture of general machinery 24.2 percent, for manufacture of transport equipment 26.2 percent, for manufacture of communication equipment, computers and other electronic equipment 18.0 percent and for manufacture of electrical machinery and equipment 21.5 percent. the growth of the value added for the major six high energy consuming industries were 18.9 percent, of which, that of the manufacture of non-metallic mineral products was 24.7 percent, smelting and pressing of ferrous metals 21.4 percent, manufacture of raw chemical materials and chemical products 21.0 percent, smelting and pressing of non-ferrous metals 17.8 percent, production and supply of electric power and heat power 13.8 percent and 13.4 percent for processing of petroleum, coking, processing of nuclear fuel. The value added growth for the high-tech industry was 17.8 percent over the previous year.
Table 2: Output of Major Industrial Products and the Growth Rates in 2007
Product Unit Output Increase over 2006 (%) Yarn 10000 tons 2000.0 14.7 Cloth 100 million meters 660.0 10.3 Chemical fibers 10000 tons 2390.0 15.3 Sugar (final product) 10000 tons 1271.4 34.0 Cigarettes 100 million 21413.8 5.9 Color TV sets 10000 8433.0 0.7 Household refrigerators 10000 4397.1 24.5 Room air conditioners 10000 8014.3 17.0 Total primary energy production 100 million tons of standard coal equivalent 23.7 7.0 Coal 100 million tons 25.36 6.9 Crude oil 100 million tons 1.87 1.1 Natural gas 100 million cubic meters 693.1 18.4 Electricity 100 million kilowatt-hours 32777.2 14.4 Of which: Thermal-power 100 million kilowatt-hours 27218.3 14.9 Hydro-power 100 million kilowatt-hours 4828.8 10.8 Crude steel 10000 tons 48966.0 16.8 Rolled steel 10000 tons 56894.4 21.3 Ten kinds of nonferrous metals 10000 tons 2350.8 22.7 Of which: Refined copper (copper) 10000 tons 344.1 14.6 Aluminum electrolyze 10000 tons 1228.4 32.6 Aluminum oxide 10000 tons 1945.3 46.7 Cement 100 million tons 13.6 9.9 Sulfuric acid 10000 tons 5500.0 9.3 Soda ash 10000 tons 1771.8 13.6 Caustic soda 10000 tons 1759.3 16.4 Ethylene 10000 tons 1047.7 11.4 Chemical fertilizers (100 percent equivalent) 10000 tons 5786.9 8.3 Power-generating equipment 10000 kilowatts 12991.0 11.1 Motor vehicles 10000 888.7 22.1 Of which: Cars 10000 479.8 24.0 Large & medium tractors 10000 20.3 1.9 Integrated circuits 100 million pieces 411.6 22.6 Program-controlled switchboards 10000 lines 5387.1 -27.2 Mobile telephones 10000 54857.9 14.3 Micro-computers 10000 12073.4 29.3
The profits made by the industrial enterprises above the designated size in the first 11 months of 2007 were 2,295.1 billion yuan, an increase of 36.7 percent over the same period of last year.
Table 3: Profits and Growth of Industrial Enterprises above the Designated Size in the First Eleven Months of 2007
Item Total Profits Increase over same period last year (%) Industrial enterprises above designated size 22951 36.7 Of which: State-owned and state-holding enterprises 9662 29.6 Of which: Collective enterprises 566 25.2 Share-holding enterprises 12209 35.1 Enterprises by foreign investors or investors from and 6126 34.3 Of which: Private enterprises 4000 50.9
In 2007, the value added of construction enterprises in
IV. Investment in Fixed Assets
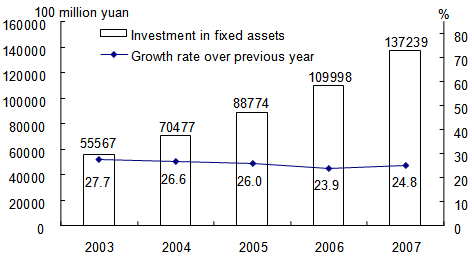
The completed investment in fixed assets of the country in 2007 was 13,723.9 billion yuan, up by 24.8 percent over the previous year. of the total investment, that in urban areas was 11,741.4 billon yuan, up by 25.8 percent; and that in rural areas reached 1,982.5 billion yuan, up by 19.2 percent. An analysis by regions showed that the investment in east areas was 7,231.4 billion yuan, up by 19.9 percent over the previous year, in central areas was 3,428.3 billion yuan, a growth of 33.3 percent, and in western areas 2,819.4 billion yuan, a growth of 28.2 percent.
Figure 7: Investment in Fixed Assets and its Growth, 2003-2007
In the urban areas, the investment in the primary industry was 146.6 billion yuan, up by 31.1 percent; that in the secondary industry was 5,102.0 billion yuan, up by 29.0 percent; and that in the tertiary industry was 6,492.8 billion yuan, up by 23.2 percent.
Table 4: Fixed Assets Investment in Urban Areas and its Growth by Sector in 2007
Unit: 100 million yuan
|
Sector |
Investment |
Increase over 2006 (%) |
|
|
|
|
|
Total |
117414 |
25.8 |
|
Agriculture, Forestry, Animal Husbandry and Fishing |
1466 |
31.1 |
|
Mining |
5271 |
26.9 |
|
Of Which: Mining and Washing of Coal |
1805 |
23.7 |
|
Extraction of Petroleum and Natural Gas |
2230 |
22.4 |
|
Manufacturing |
35497 |
34.8 |
|
Of Which: Processing of Food from Agricultural Products |
1646 |
37.6 |
|
Manufacture of Foods |
967 |
26.1 |
|
Processing of Petroleum, Coking, Processing Nuclear Fuel |
1412 |
50.3 |
|
Manufacture of Raw Chemical Materials and Chemical Products |
3507 |
38.1 |
|
Manufacture of Non-Metallic Mineral Products |
2799 |
50.8 |
|
Smelting and Pressing of Ferrous Metals |
2563 |
12.2 |
|
Smelting and Pressing of Non-Ferrous Metals |
1299 |
34.9 |
|
Manufacture of Metal Products |
1609 |
46.2 |
|
Manufacture of General Machinery |
2341 |
49.4 |
|
Manufacture of Special Purpose Machinery |
1696 |
55.7 |
|
Manufacture of Transport Equipment |
2724 |
38.5 |
|
Manufacture of Electric Machinery and Equipment |
1610 |
44.9 |
|
Manufacture of Communication Equipment, Computers and Other Electronic Equipment |
2096 |
24.3 |
|
Production and Supply of Electricity, Gas and Water |
9070 |
9.8 |
|
Of Which: Production of Electric Power and Heat Power |
7908 |
8.7 |
|
Construction |
1182 |
48.5 |
|
Transport, Storage and Post |
12844 |
14.4 |
|
Information Transmission, Computer Services and Software |
1796 |
1.3 |
|
Wholesale and Retail Trade |
2444 |
28.9 |
|
Lodging and Catering Services |
1326 |
41.2 |
|
Banking |
149 |
25.4 |
|
Real Estate |
28543 |
32.2 |
|
Leasing and Business Services |
865 |
30.5 |
|
Scientific Research, Technical Service and Geologic Prospecting |
543 |
16.7 |
|
Water Conservancy, Environment and Public Facilities Management |
9177 |
22.3 |
|
Services to Households and Other Services |
236 |
28.8 |
|
Education |
2212 |
3.9 |
|
Health, Social Security and Social Welfare |
803 |
13.4 |
|
Culture, Sports and Entertainment |
1124 |
31.0 |
|
Public Management and Social Organization |
2866 |
7.9 |
|
|
|
|
In 2007, the investment in real estate development was 2,528.0 billion yuan, up by 30.2 percent. Of this total, the investment in commercial residential buildings reached 1,801.0 billion yuan, an increase of 32.1 percent. The completed floor space of commercial buildings reached 582.36 million square meters, up by 4.3 percent. The total sales of commercial buildings reached 761.93million square meters, up by 23.2 percent, of which, that of the commercial residential building were 691.04 million square meters, up by 24.7 percent.
Table 5: Newly Increased Production Capacity through Fixed Assets Investment in 2007
Item Unit Volume Newly increased power generating capacity 10,000 kilowatts 10009 Power transformer equipment with a capacity of over 220 kilovolts 10,000 kilovolt-amperes 18848 New railways put into operation Kilometer 678 Double-track railways put into operation Kilometer 480 Electrified railways put into operation Kilometer 938 New highways Kilometer 143595 Of which: Expressways Kilometer 8059 New cargo-handling capacity of berths for over 10000-tonnage ships 10,000 tons 43916 New capacity of telephone switchboards 10,000 lines 836 New lines of optical-fiber cables 146 New capacity of digital cellular mobile phone switchboards 10,000 subscribers 24284
V. Domestic Trade
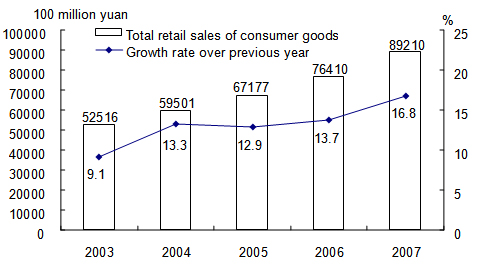
In 2007, the total retail sales of consumer goods reached 8,921.0 billion yuan, up by 16.8 percent over the previous year. An analysis on different areas showed that the retail sales of consumer goods in cities reached 6,041.1 billion yuan, up by 17.2 percent and the retail sales of consumer goods at and below county level was 2,879.9 billion yuan, up by 15.8 percent. Analyzed by different sectors, the sales of the wholesales and retail trade reached 7,504.0 billion yuan, up 16.7 percent; the sales of the lodging and catering industry was 1,235.2 billion yuan, up 19.4 percent, and the sales of the other industries was 181.8 billion yuan, up 4.5 percent.
Of the total retail sales by wholesale and retail enterprises above designated size, the sales of grain and oil was up by 38.3 percent, meat and eggs up by 40.9 percent, clothing up by 28.7 percent, motor vehicles up by 36.9 percent, petroleum and related products up by 20.5 percent, daily necessities up by 26.5 percent, cultural and office goods up by 22.6 percent, telecommunication equipment up by 8.8 percent, electric and electronic appliances for household use and audio-video equipment up by 23.4 percent, building and decoration materials up by 43.6 percent, furniture up 43.2 percent, cosmetics up by 26.3 percent, gold, silver and jewelry up by 41.7 percent and traditional Chinese drugs and western drugs up by 25.1 percent.
Figure 8: Total Retail Sales of Consumer Goods and its Growth, 2003-2007
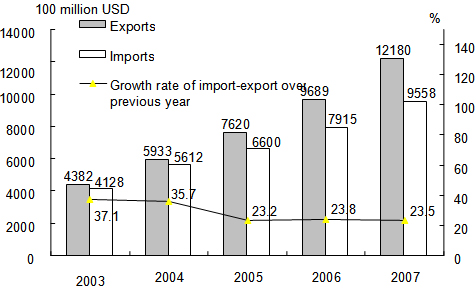
The total value of imports and exports in 2007 reached 2,173.8 billion US dollars, up 23.5 percent over the previous year. Of this total, the value of exports was 1,218.0 billion US dollars, up 25.7 percent, and the value of imports was 955.8 billion US dollars, up 20.8 percent.
Table 6: Total Value of Imports and Exports and the Growth Rates in 2007
Unit: 100 million USD
|
Item |
Value |
Increase over 2006 (%) |
|
|
|
|
|
Total imports and exports |
21738 |
23.5 |
|
Exports |
12180 |
25.7 |
|
Of which: General trade |
5386 |
29.4 |
|
Processing trade |
6177 |
21.0 |
|
Of which: Mechanical and electronic products |
7012 |
27.6 |
|
High & new-tech products |
3478 |
23.6 |
|
Of which: State-owned |
2248 |
17.5 |
|
Foreign-funded |
6955 |
23.4 |
|
Others |
2977 |
39.2 |
|
Imports |
9558 |
20.8 |
|
Of which: General trade |
4286 |
28.7 |
|
Processing trade |
3684 |
14.6 |
|
Of which: Mechanical and electronic products |
4990 |
16.7 |
|
High & new-tech products |
2870 |
16.0 |
|
Of which: State-owned |
2697 |
19.8 |
|
Foreign-funded |
5594 |
18.4 |
|
Others |
1267 |
35.1 |
|
Trade surplus |
2622 |
47.7 |
|
Of which: General trade |
1099 |
32.2 |
|
Processing trade |
2493 |
32.0 |
|
Other trade |
-970 |
2.6 |
|
|
|
|
Table 7: Imports and Exports by Major Countries and Regions and the Growth Rates in 2007
Unit: 100 million USD
|
Country or region |
Exports |
Increase over 2006 (%) |
Imports |
Increase over 2006 (%) |
|
|
|
|
|
|
|
European Union |
2452 |
29.2 |
1110 |
22.4 |
|
|
2327 |
14.4 |
694 |
17.2 |
|
|
1844 |
18.8 |
128 |
18.9 |
|
|
1021 |
11.4 |
1340 |
15.8 |
|
ASEAN |
942 |
32.1 |
1084 |
21.0 |
|
|
561 |
26.1 |
1038 |
15.6 |
|
|
285 |
79.9 |
197 |
12.1 |
|
|
240 |
64.7 |
146 |
42.4 |
|
|
235 |
13.1 |
1010 |
16.0 |
|
|
|
|
|
|
Figure 9: Imports and Exports and the Growth Rates, 2003-2007
The year 2007 witnessed the establishment of 37,871 enterprises with foreign direct investment in non-financial sectors, down by 8.7 percent; and the foreign capital actually utilized was 74.8 billion US dollars, up by 13.6 percent. Of the total foreign direct investment actually utilized, the share of investment in manufacturing was 54.7 percent over the pervious year, the real estate 22.9 percent, leasing and business service 5.4 percent, wholesales and retail trade 3.6 percent and transportation, storage and post service 2.7 percent.
Table 8: Total Value of Foreign Direct Investment and the Growth Rates by Sector in 2007
Sector Enterprises Increase over 2006 (%) Actually Utilized Value 100 million USD Increase over 2006 (%) Total 37871 -8.7 747.7 13.6 Farming, Forestry, Animal Husbandry and Fishery 1048 10.2 9.2 54.2 Mining and Quarrying 234 12.5 4.9 5.4 Manufacturing 19193 -22.6 408.6 -4.6 Production and Supply of Electricity, Gas and Water 352 -6.1 10.7 -16.6 Construction 308 -12.5 4.3 -36.9 Transport, Storage, Post and Telecommunication Services 658 -1.1 20.1 1.1 Information Transmission, Computer Services and Software 1392 1.0 14.9 38.7 Wholesales & Retail Trade 6338 35.9 26.8 49.6 Lodging & Catering Services 938 -11.5 10.4 25.8 Banking 51 -1.9 2.6 -12.4 Real Estate 1444 -39.8 170.9 107.3 Leasing and Business Services 3539 22.7 40.2 -5.2 Scientific Research, Technical Services and Geological Prospecting 1716 65.8 9.2 81.8 Water Conservancy, Environment Protection and Public Facilities Management 154 16.7 2.7 39.8 Services to Households and Other Services 270 14.4 7.2 43.0 Education 15 -44.4 0.3 10.4 Health, Social Security and Social Welfare 13 -35.0 0.1 -23.7 Culture, Sports and Entertainment 207 -14.1 4.5 86.9 Public Management and Social Organization 0 -- 0.0 --
In 2007, the overseas direct investment (non-financial sectors) by Chinese investors was 18.7 billion US dollars, up by 6.2 percent over the previous year.
In 2007, the accomplished business revenue through contracted overseas engineering projects was 40.6 billion US dollars, up by 35.3 percent, and the business revenue through overseas labor contracts was 6.8 billion US dollars, up by 26.0 percent over the previous year.
VII. Transportation, Post, Telecommunications and Tourism
The value added of the transportation, storage, post and telecommunication sectors reached 1,364.9 billion yuan in 2007, up 9.7 percent over the previous year.
Table 9: Freight Traffic by All Means of Transportation and the Growth Rates in 2007
Item Unit Increase over 2006 (%) Total freight traffic 100 million tons 225.3 10.7 Railways 100 million tons 31.4 9.0 Highways 100 million tons 162.8 11.0 Waterways 100 million tons 27.3 9.7 Civil aviation 10 000 tons 401.8 15.0 Pipelines 100 million tons 3.8 17.9 Freight flows 100 million ton-kilometers 99180.5 11.8 Railways 100 million ton-kilometers 23797.0 8.4 Highways 100 million ton-kilometers 11257.6 15.4 Waterways 100 million ton-kilometers 62182.2 12.1 Civil aviation 100 million ton-kilometers 116.4 23.5 Pipelines 100 million ton-kilometers 1827.3 27.4
Volume
Table 10: Passenger Traffic by All Means of Transportation and the Growth Rates in 2007
Item Unit Volume Increase over 2006 (%) Total passenger traffic 100 million persons 223.7 10.5 Railways 100 million persons 13.6 8.0 Highways 100 million persons 205.8 10.6 Waterways 100 million persons 2.4 9.6 Civil aviation 10 000 persons 18576.2 16.3 Passenger flows 100 million person-kilometers 21530.3 12.2 Railways 100 million person-kilometers 7216.3 9.0 Highways 100 million person-kilometers 11445.0 13.0 Waterways 100 million person-kilometers 77.3 5.0 Civil aviation 100 million person-kilometers 2791.7 17.8
The volume of freight handled by ports above the designated size throughout the year totaled 5.21 billion tons, up 13.4 percent over the previous year, of which freight for foreign trade was 1.78 billion tons, up 12.6 percent. Container shipping handled 111.79 million standard containers, up by 21.5 percent.
The total number of motor vehicles for civilian use reached 56.97 million (including 14.68 million tri-wheel motor vehicles and low-speed trucks) by the end of 2007, up 14.3 percent, of which private-owned vehicles numbered 35.34 million, up 20.8 percent. The total number of cars for civilian use stood at 19.58 million, up by 26.7 percent, of which private-owned cars numbered 15.22 million, up by 32.5 percent.
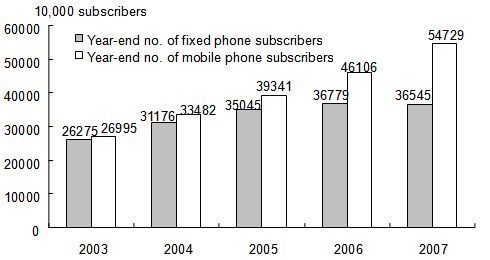
The turnover of post and telecommunication services totaled 1,936.1 billion yuan, up 26.4 percent over the previous year. Of this total, post services accounted for 81.5 billion yuan, up 11.8 percent, and telecommunication services 1,854.5 billion yuan, up 27.1 percent. By the end of 2007, with 8.36 million newly installed lines of office switchboards, the total capacity reached 510 million lines. The year also saw 365.45 million fixed telephone subscribers. This included 248.59 million urban subscribers and 116.86 million rural subscribers. Mobile phone users numbered 547.29 million by the end of 2007, with 86.23 million new subscribers in the year. In total, the number of fixed and mobile phone users reached 912.73 million, an increase of 83.89 million as compared with at the end of 2006. Phone coverage is 69 sets per 100 persons. The number of Internet users was 210 million and wide-band users reached 163 million.
Figure 10: Number of Phone Subscribers, 2003 - 2007
VIII. Banking, Securities and Insurance
By the end of 2007, money supply of broad sense (M2) was 40.3 trillion yuan, reflecting a year-on-year increase of 16.7 percent. Money supply of narrow sense (M1) was 15.3 trillion yuan, up 21.1 percent. Cash in circulation (M0) was 3.0 trillion yuan, up 12.2 percent. Savings deposit in Renminbi and foreign currencies in all items of financial institutions totaled 40.1 trillion yuan at the end of 2007, up 15.2 percent. Loans in Renminbi and foreign currencies in all items of financial institutions reached 27.8 trillion yuan, up 16.4 percent.
Table 11: Savings Deposit and Loans in RMB and Foreign Currencies in All Financial Institutions and the Growth Rates in 2007
Unit: 100 million yuan
|
Item |
Year-end figure |
Increase over 2006 (%) |
|
|
|
|
|
Savings deposit |
401051 |
15.2 |
|
Of which: By enterprises |
144814 |
21.8 |
|
By urban and rural households |
176213 |
5.8 |
|
Of which: Deposits in RMB |
172534 |
6.8 |
|
Loans |
277747 |
16.4 |
|
Of which: Short-term |
118900 |
16.8 |
|
Medium and long-term |
138579 |
22.4 |
|
|
|
|
Figure 11: Urban and Rural Households’ Savings Deposit in RMB and its Growth, 2003 - 2007

Funds raised in 2007 by enterprises through issuing stocks and share rights on stock market amounted to 843.2 billion yuan, an increase of 283.8 billion yuan over the previous year. Of this total, 283 companies issued A-shares (including newly issued and convertible loan stocks) with 7 companies issued A-share rights, receiving 772.8 billion yuan worth of capital altogether, an increase of 526.4 billion yuan over 2006. The issue of 14 H-shares raised another 70.4 billion yuan worth of capital, a decrease of 242.7 billion yuan. The number of listed companies (with A- or B-shares) on China’s stock market rose from 1,434 at the end of 2006 to 1,550 at the end of 2007, representing 32,714.1 billion yuan worth of market value, a growth of 265.9 percent over the previous year.
The total corporate bonds issued throughout the year reached 1,708.4 billion yuan, an increase of 352.0 billion yuan over 2006. Of this total, the financial bonds were 1,191.3 billion yuan, a growth of 230.8 billion yuan; the enterprise (corporate) bonds were 182.1 billion yuan, an increase of 80.6 billion yuan; and the short-term financing funds were 334.9 billion yuan, an increase of 40.6 billion yuan.
The premium received by the insurance companies totaled 703.6 billion yuan in 2007, up 25.0 percent over the previous year. Of this total, life insurance premium amounted to 446.4 billion yuan, health and casualty insurance premium 57.4 billion yuan, and property insurance premium 199.8 billion yuan. Insurance companies paid an indemnity worth of 226.5 billion yuan, of which, life insurance indemnity was 106.4 billion yuan, health and casualty insurance indemnity 18.0 billion yuan, and property insurance indemnity 102.1 billion yuan.
IX. Education, Science and Technology
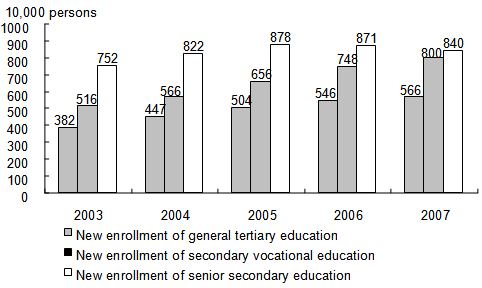
In 2007, the post-graduate education enrollment was 1.2 million students with 420 thousand new students and 310 thousand graduates. The general tertiary education enrollment was 18.85 million students with 5.66 million new students and 4.48 million graduates. Vocational secondary schools of various types had 20 million enrolled students, including 8 million new entrants, and 5.3 million graduates. Senior secondary schools had 25.22 million enrolled students, including 8.4 million new entrants, and 7.88 million graduates. Students enrolled in junior secondary schools totaled 57.36 million, including 18.69 million new entrants, and 19.64 million graduates. The country had a primary education enrollment of 105.64 million students, including 17.36 million new entrants, and 18.7 million graduates. There were 410 thousand students enrolled in special education schools, with 60 thousand new entrants. Kindergartens accommodated 23.49 million children.
Figure 12: New Entrants into Education, 2003 - 2007
The amount of expenditures on research and development activities (R&D) was worth 366.4 billion yuan in 2007, up 22.0 percent over 2006, accounting for 1.49 percent of GDP. Of this total, 18 billion yuan was appropriated for fundamental research programs. A total number of 1,540 projects under the National Key Technology Research and Development Program and 2,541 projects under the Hi-tech Research and Development Program (the 863 Program) were implemented. The year 2007 saw the establishment of 9 new national engineering research centers and 6 national engineering laboratories. the number of state validated enterprise technical centers reached 499 by the end of the year. The technical centers at the provincial level numbered 4,023. Some 694 thousand patent applications were accepted from home and abroad, of which 587 thousand were domestic applications, accounting for 84.5 percent of the total. A total number of 245 thousand patent applications for new inventions were accepted, of which 153 thousand were from domestic applicants or 62.4 percent of the total. A total of 352 thousand patents were authorized in 2007, of which 302 thousand were domestic patents, accounting for 85.7 percent of the total. A total of 68 thousand patents for new inventions were authorized, of which 32 thousand were domestic ones, accounting for 47.0 percent. A total of 210 thousand technology transfer contracts were signed, representing 220 billion yuan in value, up 21.0 percent over the previous year. The year 2007 saw 10 times of successful launch of satellites and Chang’e-1 circumlunar exploration satellite was launched successfully.
By the end of 2007, there were altogether 24,700 laboratories for product inspection, including 356 national inspection centers. There were 184 organizations for product certification and management system certification, which accumulatively certified products in 70 thousand enterprises. A total of 3,720 authorized measurement institutions enforced compulsory inspection on 42.18 million measurement instruments in the year. A total of 1,411 national standards were developed or revised in the year, including 747 new standards. Through out the year, a total of 3,350 weather forewarning signals were released and alarm signals were 690 times. There were 1,314 seismological monitor stations and 31 seismological remote monitor network stations. The numbers of oceanic observation stations were 66 and oceanic monitor spots reached 9,200. Mapping departments published 1,946 maps and 417 mapping books.
X. Culture, Public Health and Sports
At the end of 2007, there were 2,856 art-performing groups, 2,921 culture centers, 2,791 public libraries, 1,634 museums, 263 radio broadcasting stations, 287 television stations, 1,993 radio broadcasting and television stations and 44 educational television stations throughout
By the end of 2007, there were 315 thousand health institutions in
In 2007, Chinese athletes won 123 world championships on 22 sports events. Eight athletes and 2 teams broke 10 world records on 10 occasions. the amateur sports activities were carried out vigorously.
XI. Population, Living Conditions and Social Security
At the end of 2007, the total number of Chinese population reached 1,321.29 million, an increase of 6.81 million over that at the end of 2006. The year 2007 saw 15.94 million births, a crude birth rate of 12.10 per thousand, and 9.13 million deaths, or a crude death rate of 6.93 per thousand. The natural growth rate was 5.17 per thousand. the sex ratio at birth was 120.22.
Table 12: Composition of Population in 2007
Unit: 10,000 persons
|
Item |
Population |
Percentage (%) |
|
|
|
|
|
National Total |
132129 |
100.0 |
|
Of which: Urban |
59379 |
44.9 |
|
Rural |
72750 |
55.1 |
|
Of which: Male |
68048 |
51.5 |
|
Female |
64081 |
48.5 |
|
Of which: 0-14 years |
25660 |
19.4 |
|
15-59 years |
91129 |
69.0 |
|
60 years and over |
15340 |
11.6 |
|
Of which: 65 years and over |
10636 |
8.1 |
|
|
|
|
In 2007, the annual per capita net income of rural households was 4,140 yuan, or a real increase of 9.5 percent over the previous year when the factors of price increase were deducted. The annual per capita disposable income of urban households was 13,786 yuan, or a real increase of 12.2 percent. The Engel coefficient (which refers to the proportion of expenditure on food to the total expenditure of households) was 43.1 percent for rural households and 36.3 percent for urban households. The population in absolute poverty in rural areas with annual per capita net income below 785 yuan numbered 14.79 million at the end of 2007, a decline of 6.69 million over the previous year. The low-income population in rural areas with annual per capita net income between 786 - 1067 yuan numbered 28.41 million, a decline of 7.09 million.
Figure 13: Per Capita Net Income of Rural Households and its Growth, 2003-2007
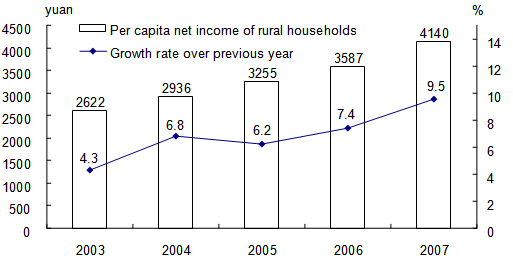
Figure 14: Per Capita Disposable Income of Urban Households and its Growth, 2003-2007

At the end of 2007, a total of 201.07 million people participated in basic pension program, a year-on-year increase of 13.41 million. Of this total, 151.56 million were staff and workers, and 49.51 million were retirees. A total of 220.51 million people participated in urban basic health insurance program, an increase of 63.19 million, of whom 179.83 million people participated in urban basic health insurance program for staff and workers, 40.68 million people participated in programs for residents. A total of 31.31 million people participated in urban health insurance programs were migrant workers coming from the rural areas, an increase of 7.64 million. Some 116.45 million people participated in unemployment insurance programs, an increase of 4.58 million. A total of 121.55 million people participated in work accident insurance, an increase of 18.87 million, of which 39.66 million were migrant workers coming from the rural areas, an increase of 14.29 million. A total of 77.55 million people participated in maternity insurance programs, an increase of 12.96 million. A total of 2,448 counties (cities, districts) conducted the new cooperative medical care system in rural areas, attracting 730 million farmers which represented a participation rate of 85.7 percent. The total expenditure of the new cooperative medical care system in rural areas reached 22 billion yuan, benefiting 260 million people. In 2007, the urban medical assistance helped 4.07 million people, up by 117.2 percent. The rural medical assistance helped 6.03 million people, up by 150.1 percent. A total of 23.06 million people were funded by the civil affairs department in the rural cooperative medical care system.
The number of people receiving unemployment insurance payment stood at 2.86 million. A total of 22.71 million urban residents received the government minimum living allowances, or 310 thousand more than the previous year. About 34.52 million rural residents received the government minimum living allowance, an increase of 18.59 million.
Social welfare institutions of various types provided 2.05 million beds by the end of 2007, accommodating 1.63 million inmates. There were 128 thousand community service facilities and 10,299 comprehensive community service centers were set up in urban areas. A total of 63.2 billion yuan worth of social welfare lottery tickets were sold, raising 21.7 billion yuan of social welfare funds. A total of 4.2 billion yuan were received from direct donations.
XII. Resources, Environment and Work Safety
A total of 188.3 thousand hectares of cultivated land was used for construction purpose in 2007. An area of 17.9 thousand hectares of cultivated land was destroyed by disasters, 25.4 thousand hectares of farmland was converted into land for ecological preservation. The structural adjustment to agriculture led to a reduction of 4.9 thousand hectares of cultivated land. Land reclamation and re-development programs added 195.8 thousand hectares of cultivated land. As a result, the year 2007 witnessed a net reduction of 40.7 thousand hectares of cultivated land.
The total stock of water resources in 2007 was 2,469.0 billion cubic meters, a year-on-year decline of 2.5 percent, or 1,873 cubic meters in per capita terms, down by 3.0 percent. The annual average precipitation was 608 millimeters, up by 1.9 percent. Large reservoirs in
National land surveys and geological explorations discovered a total of 208 new mineral deposits in large or medium size, including 50 energy mineral deposits, 73 metallic mineral deposits, 82 non-metallic mineral deposits and 3 aqueous and gaseous deposits. Increased reserves were found for 77 minerals, including 1.21 billion tons of crude oil, 697.4 billion cubic meters of natural gas and 40.62 billion tons of coal.
A total of 5.20 million hectares of forest were planted, 3.71million hectares of forest were survived, of which 2.56 million were afforested by manpower. Some 2.68 million hectares were afforested through key afforestation projects, accounting for 72.2 percent of the total planted area of the year. About 2.27 billion trees were planted in 2007 by volunteers. By the end of 2007, there were 2,531 natural reserves including 303 national ones and covering a total area of 151.88 million hectares, or 15.0 percent of the total land area of
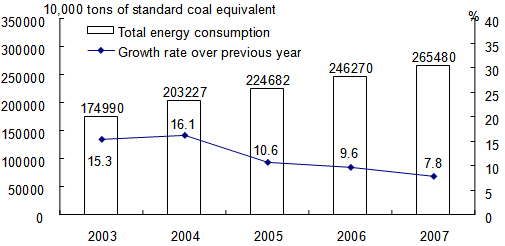
Preliminary estimation indicated that the total energy consumption in 2007 amounted to 2.65 billion tons of standard coal equivalent, up 7.8 percent over 2006. The consumption of coal was 2.58 billion tons, up 7.9 percent; crude oil 340 million tons, up 6.3 percent; natural gas 67.3 billion cubic meters, up 19.9 percent; and electric power 3,263.2 billion kilowatt hours, up 14.1 percent. The consumption of major kinds of raw materials included 520 million tons of rolled steel, up 17.4 percent; 3.99 million tons of copper, up by 13.0 percent; 11.12 million tons of electrolytic aluminum, up by 27.6 percent; 10.48 million tons of ethylene, up by 11.4 percent; and 1.33 billion tons of cement, up 10.5 percent.
Figure 15: Total Energy Consumption and its Growth, 2003-2007
Monitoring of water quality on 408 sections of the 7 major water systems in
Monitoring of oceanic water quality at 296 offshore monitoring stations indicated that oceanic water met the national quality standard Grade I and II in 62.8 percent of the stations, down by 4.9 percentage points from the previous year; water quality at 11.8 percent of the stations met Grade III standard, up by 3.8 percentage points; and water of Grade IV or inferior quality was found at 25.4 percent of the stations, up by 1.1 percentage points. A total of 145 thousand square kilometers of oceanic waters did not meet the quality standard for clean oceanic water, a decrease of 4 thousand square kilometers. of this total, seriously polluted oceanic area occupied 29 thousand square kilometers. Seriously polluted oceanic area in
In the 557 cities covered by air quality monitoring program, 389 cities reached or topped air quality standard Grade II, accounting for 69.8 percent of all cities under the program; 152 cities attained Grade III, accounting for 27.3 percent; and air quality in 16 cities was inferior to Grade III, accounting for 2.9 percent. of the 342 cities subject to noise monitoring program, 6.1 percent enjoyed fairly good environment, 64.6 percent had good environment, 28.1 percent had light noise pollution, and 1.2 percent experienced medium noise pollution in downtown areas.
The average temperature in 2007 was
At the end of 2007, the daily treatment capacity of city sewage reached 70.00 million cubic meters, up 10.0 percent over that in 2006. City sewage treatment rate was 59.0 percent, up 3.3 percentage points. The floor space with central heating systems amounted to 2.85 billion square meters, up 7.1 percent. Greenery coverage reached 36.0 percent of the urban area, up 1 percentage point.
In 2007, natural disasters caused 236.3 billion yuan worth of direct economic loss, down by 6.5 percent. Natural disasters hit 48.99 million hectares of crops, up 19.2 percent, of which 5.75 million hectares of crops was demolished, up 6.2 percent. 2007 witnessed 9,260 forest fires, up by 13.3 percent. There was no extra big forest fire. Floods and waterlog caused a direct economic loss of 82.6 billion yuan, up by 46.9 percent and left a death roll of 1,168, up by 54.9 percent. Drought caused a direct economic loss of 78.5 billion yuan, up by 10.9 percent. Oceanic disasters caused a direct economic loss of 8.84 billion yuan, down by 59.5 percent. The occurrence of red tides hit an accumulative area of 11,610 square kilometers, down by 41.5 percent.
The death toll due to work accidents amounted to 101,480 people, a year-on-year decrease of 10.1 percent. The death toll from work accidents every 100 million yuan worth of GDP was 0.413 people, a decline of 26.3 percent. Work accidents in industrial, mining and commercial enterprises caused 3.05 deaths out of every 100 thousand employees, down 8.4 percent. The death toll for producing one million tons of coal in coal mines was 1.485 persons, down 27.2 percent. The year 2007 witnessed 327 thousand traffic accidents, claiming 82 thousand lives, injuring 380 thousand people and causing a direct property loss of 1.2 billion yuan. The road traffic death toll per 10 thousand vehicles was 5.1 persons, a decrease of 1.1 persons.
Notes:
1. All figures in this Communiqué are preliminary statistics.
2. Statistics in this Communiqué do not include Hong Kong SAR, Macao SAR and
3. Due to the rounding-off reasons, the subentries may not add up to the aggregate totals.
4. Gross domestic product (GDP) and value added as quoted in this Communiqué are calculated at current prices, whereas their growth rates are at comparable prices.
5. The base figures for calculating the output growth rate of major farm products are adjusted correspondently according to the results of the second national agricultural census. The output of fruits and vegetables are under checking, and will be published separately.
6. Six highly energy-consuming industries are: manufacture of raw chemical materials and chemical products, manufacture of non-metallic mineral products, smelting and pressing of ferrous metals, smelting and pressing of non-ferrous metals, oil processing, coking and nuclear fuel processing, and production and supply of electricity and heat.
7. Output and consumption of rolled steel include duplicated counting of rolled steel as intermediate inputs used for producing other types of rolled steel.
8. The national total of fixed assets investment is larger than the aggregate sum by adding up the subtotals of fixed assets investment in the eastern areas, central areas, and western areas due to the fact that some of the trans-regional investments are not covered by regional figures.
9. The investment in real estate includes the investment made in real estate development, construction of buildings for own use, property management, intermediary services and other real estate development.
10. The original premium income received by the insurance companies refers to the premium income from original insurance contracts confirmed by the insurance companies, same as the “premium received by the insurance companies” in previous Communiqués.
11. The number of people covered in urban basic health insurance programs for urban staff and workers include staff and workers and retirees insured. the urban basic health insurance programs for urban residents refer to urban non-employed residents who are not covered by the urban basic health insurance programs for staff and workers.
12. The consumption of water for producing 10 thousand yuan worth of GDP is calculated at 2005 constant prices. The turnover of post and telecommunication services is calculated at constant prices of 2000.
13. The consumption of energy for producing 10 thousand yuan worth of GDP, the total emission of chemical oxygen demand (COD) and the sulfur dioxide (SO2) of the whole country will be further certified by relevant departments and be published in near future.