Communiqué on 2004 Rural Poverty Monitoring of China
In 2004, the Chinese government kept on giving key priorities to the issue of rural poverty. A series of preferential policies and measures have been laid out and put in practice by enlarging fiscal inputs to rural area, largely lightening tax burden of rural households especially those living in poor areas, fastening the construction of the rural social security system. Those lower-income rural households and other vulnerable groups who depended mainly on agriculture were widely benefited. Through corporate efforts of the whole society, new progress of poverty alleviation has been made in
1. General outlook of economic and social development of rural area
1.1 Agriculture
In 2004, the value-added of primary industry reached 2074.4 billion yuan, up by 6.3 percent over the previous year. The total output of grain was 469.47 million tons, up by 38.77 million tons or 9.0 percent. The output of cotton was 6.32 million tons, an increase of 30.1 percent; that of oil-bearing crops was 30.57 million tons, up by 8.8 percent. The output of sugar crops was 95.28 million tons, a decrease of 1.2 percent. Steady progress was seen in vegetable and fruits production due to expanded use of high quality varieties. The total output of meat for the year reached 72.60 million tons, up by 4.7 percent. The total output of aquatic products was 48.55 million tons, up by 3.2 percent.
1.2 Income of rural households
In 2004, the per capita annual net income of rural households was 2936 yuan, up by 314 yuan or 12 percent in nominal terms over the previous year. It registered the highest growth since 1997 with a real increase of 6.8 percent after price factors were deducted. As a result of a series of supportive and preferential agricultural policies, along with the pick-up of grain price in the market and favorable climate for agricultural production in 2004, rural households got much more income from agriculture, which was the record high since the reform and opening policy was adopted by reaching 176 yuan per capita, up by 20 percent. The income of the poor and low-income households depending mainly on agriculture increased markedly. By income quintile, the nominal income growth of the bottom 20% households was 16.3 percent, 4.3 percentages higher than the national average, 7.1 percentages higher than that of the top 20% households.
1.2 Life of rural households
In 2004, the per capita living expenditure of rural households was 2185 yuan, up by 241 yuan or 12.4 percent in nominal terms. After deducting price factors, the real increase was 7.3 percent which was the highest growth since 1997. The expenditure on food, clothes, housing, facilities, education, health, transportation and communications increased comprehensively. Both quantity and quality of assets and living facilities owned by rural households was improved significantly (table 1).
Table 1: Assets and living facilities of rural households in
Indicator 2004 2003 Per capita floor space of living houses (square meter) 27.9 27.2 Proportion of rural households living in houses of reinforced concrete structure or brick and wood structure (%) 26.6 25.2 Proportion of rural households whose houses were linked with hard surfacing road (%) 49.6 Proportion of rural households with toilet(%) 89.9 89.5 Proportion of rural households with heating system(%) 41.5 40.1 Proportion of rural households using liquefied petroleum gas or electricity fuel(%) 10.6 8.9 Proportion of rural households using tap water(%) 34.6 32.6 Number of color TV owned per 100 households 75.1 67.8 Number of telephone owned per 100 households 89.2 72.8 Number of washing machine owned per 100 households 37.3 34.3 Number of refrigerate owned per 100 households 17.8 15.9 Number of motor cycle owned per 100 households 36.2 31.8
1.4 Income distribution
In 2004, the Gini coefficient within rural households was 0.3692, up by 0.0012 over the previous year, which was lower than the increment of 0.0034 in 2003. The income ratio of urban to rural households basically maintained last year’s level of 3.2:1.
1.5 Social securities of rural area
In 2004, a total of 333 counties/cities conducted experiments on new medical care cooperation system in rural area, covering approximately 106.91 million of rural population and attracting 80.4 million farmers to the new system. Experiments of the rural minimum income security system (DiBao system) were also made in some areas.
2. National poverty status
2.1 Poverty line
According to rural CPI, the government poverty line was adjusted from 637 yuan in 2003 to 668 yuan in 2004, low-income line from 882 yuan to 924 yuan.
2.2 Poverty size
By the end of 2004, the rural population in absolute poverty was 26.1 million, a decline of 2.9 million from the previous year and took up 2.8 percent of the total rural population, down by 0.3 percentage points. The low-income population that the food and clothing problems were preliminarily solved in rural area was 49.77 million, a decline of 6.4 million. The proportion of the low-income population to the total rural population was 5.3 percent, down by 0.7 percentage.
Figure 1: Size and proportion of absolute poverty population in
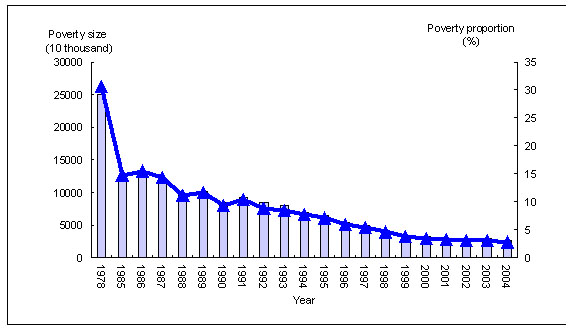
Table 2: Poverty line, size and proportion of
Year Absolute Poverty Low-income Poverty Line (yuan) Size (million) Proportion (%) Low-income line (yuan) Size (million) Proportion (%) 2000 625 32.09 3.5 865 62.13 6.7 2001 630 29.27 3.2 872 61.02 6.6 2002 627 28.20 3.0 869 58.25 6.2 2003 637 29.00 3.1 882 56.17 6.0 2004 668 26.10 2.8 924 4977 5.3
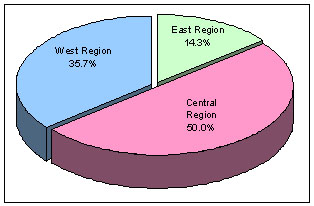
1.3 Poverty distribution
Of rural population in absolute poverty, 3.74 million lived in eastern region of
Figure 2: The poverty distribution of rural
3. The improvement of poverty alleviation in 592 key counties covered by national poverty reduction program.
In 2004, poverty level in 592 key counties was also reduced. The main features are as following.
3.1 Poverty population decreased
By the end of 2004, the rural population in poverty was 16.13 million in 592 key counties, a decline of 1.49 million over the previous year. The proportion of absolute poverty was 8.1%, 0.8 percentage points lower than that of the last year. The low-income population was 25.8 million, a decline of 3.66 million. The proportion of low-income population to the total population of 592 key counties was 12.9%, a decline of 1.9 percentage points. The absolute poverty population and the low-income population of 592 key counties took account of 61.8% and 51.8% of the national total respectively.
Table 3: Poverty size and propotion of 592 key counties, 2001-2004
|
Year |
Absolute Poverty |
Low-income | ||
|
Size (million) |
Proportion (%) |
Size (million) |
Proportion (%) | |
|
2001 |
18.12 |
9.1 |
38.65 |
19.5 |
|
2002 |
17.52 |
8.8 |
30.76 |
15.5 |
|
2003 |
17.63 |
8.9 |
29.46 |
14.8 |
|
2004 |
16.13 |
8.1 |
25.80 |
12.9 |
3.2 Living standard of rural households improved
In 2004, the per capita net income of rural households in 592 key counties was 1582 yuan, up by 176 yuan or 12.5 percent in nominal terms. After deducting price factors, the real increase was 7.3 percent, 0.5 percentage points higher than the national average. The per capita living expenditure was 1392 yuan, up by 172 yuan or 8.7 percent in real terms, 1.4 percentages higher than the national average. The Engel coefficient dropped by 0.5 percentage to 53.2 percent. Rural households owned more assets and living facilities compared with that of the last year (Table 4).
Table 4: Assets and living facilities of rural households in 592 key counties, 2004 and 2003
Indicator 2004 2003 Per capita floor space of living houses (square meter) 21.0 20.5 Proportion of rural households living in houses of reinforced concrete structure or brick and wood structure (%) 52.5 51.0 Number of color TV owned per 100 households 52.8 47.2 Number of telephone owned per 100 households 35.9 28.1 Number of refrigerate owned per 100 households 6.2 5.4 Proportion of rural households with toilet(%) 85.0 83.9 Proportion of rural households with heating system(%) 71.4 70.7 Proportion of rural households having difficulties to get fuel(%) 36.6 44.5 Proportion of rural households using tap water(%) 33.4 32.2 Proportion of rural households having difficulties to get water (%) 13.2 17.7 Proportion of rural households accessible to polluted drinking water(%) 11.1 14.1
3.3 New achievement was made constantly in infrastructure
In 2004, the proportion of villages accessible to road, electricity, telephone, TV program, clinic and kindergarten increased compared with that of the last year in 592 counties (Table 5).
Table 5: The access rate to rural infrastructure in 592 key counties (%), 2004 and 2003
Indicator 2004 2003 Proportion of natural villages accessible to highway 77.6 75.0 Proportion of natural villages accessible to electricity 95.1 93.9 Proportion of natural villages accessible to telephone 64.4 59.1 Proportion of natural villages accessible to TV program 87.8 86.5 Proportion of administrative villages with qualified clinics 72.5 70.2 Proportion of administrative villages with qualified health attendants 74.3 72.3 Proportion of administrative villages with qualified midwives 71.5 69.6 Proportion of administrative villages with qualified kindergartens 55.0 54.1
3.4 Tax burden was reduced greatly
In 2004, the per capita tax burden of rural households was 24.1 yuan in 592 key counties, a decline of 19.2 yuan or 44.4 percent. The proportion of taxes to per capita net income decreased from 3.1 percent in 2003 to 1.5 percent in 2004. Lower-income households benefited more from the reduction or elimination of taxes. By income quintile, the bottom 20% households expected the largest reduction of tax burden, with a decrease of 53.7 percent. The tax burden of the second 20% households decreased by 48.4 percent.
3.5 The cultural and educational attainments increased
In 2004, the labor illiteracy rate of 592 key counties was 14 percent, 1 percentage point lower than that of the previous year. The school enrollment rate (This rate is calculated by dividing the number of enrollments at a specified age range by the whole population in the same age range by the end of the year.) of children aged 7-15 was 93.5 percent, up by 1.3 percentage points over the previous year. Of which, the enrollment rate was 95.8 percent and up by 0.6 percentage for those aged 7-12, and 90.7 percent and up by 2.3 percentages for those aged 13-15.
3.6 Gender disparity reduced
In 2004, 48.2 percent of the absolute poverty population in 592 key counties were female. The poverty genetic rate was 8.3 percent for them, 0.4 percentage higher than that of the male. 48.5 percent of the low-income population was female, with the low-income genetic rate of 13.2 percent, 0.6 percentage higher than that of the male. Indicated by most of the indicators, the gender gap between women and men was narrowing in a variety of aspects such as education, employment and social engagement, etc (table 6).
Table 6: The gender gap index of main poverty indicators ( male=100) in 592 key counties, 2004 and 2003
Indicator 2004 2003 Illiteracy rate of labors 294.1 294.4 #Illiteracy rate of labors aged 16-25 162.8 174.5 Proportion of working time allocated in agricultural production 115.5 114.6 Proportion of migrant labors 47.8 45.3 Enrollment rate of children aged 7-15 98.6 97.5 Proportion of labors of social positions* 13.2 11.8
*It refers to village leaders, villager’s representatives, responsible persons of collective township-village enterprises, and responsible persons of various mass organizations.
However, rural households in 592 key counties were still vulnerable under various risks. There were two prominent evidences. The first one was that high percent of households dropped into poverty because of suffering from disasters or diseases. In 2004, 40 percent of administrative villages in 592 key counties experienced the serious reduction of output, compared with normal year because of natural disasters. Among those households who fell into poverty in 2004, 42.2 percent were stricken by serious natural disasters, 26 percent had disable or seriously ailing family members. The second one was that rural labors in 592 key counties had less employment choices. In 2004, 81.8 percent of labors worked in primary sector. 16.6 percent of labors left their hometown looking for a work. The number of migrant labors and their income kept slowing down for consecutive two years. Nearly 80 percent of labors had never left their hometown for looking for a work. Two third of migrant labors were found concentrated in industries such as construction, manufacturing, mining, and catering, etc..