Households' Income and Consumption Expenditure in the First Quarter of 2024
I. Households' Income
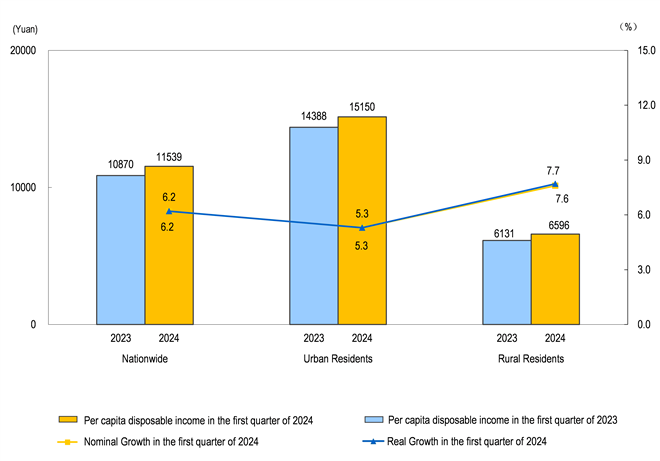
In the first quarter of 2024, the nationwide per capita disposable income was 11,539 yuan, a nominal increase of 6.2 percent over the previous year, and a real increase of 6.2 percent after deducting price factors. In terms of urban and rural areas, the per capita disposable income of urban residents was 15,150 yuan, an increase of 5.3 percent (unless otherwise specified below, it was a year-on-year nominal increase), and a real increase of 5.3 percent after deducting price factors; the per capita disposable income of rural residents was 6,596 yuan, an increase of 7.6 percent, and the real growth was 7.7 percent after deducting price factors.
According to the source of income, in the first quarter of 2024, the per capita income from wages and salaries of residents nationwide was 6,585 yuan, an increase of 6.8 percent, accounting for 57.1 percent of the per capita disposable income; the per capita net business income was 1,959 yuan, an increase of 6.8 percent, accounting for 17.0 percent of the per capita disposable income; the per capita net income from properties was 988 yuan, an increase of 3.2 percent, accounting for 8.6 percent of disposable income; the per capita net income from transfer was 2,007 yuan, an increase of 4.8 percent, accounting for 17.4 percent of the per capita disposable income.
In the first quarter of 2024, the median of the nationwide per capita disposable income was 9,462 yuan, an increase of 6.4 percent, and the median was 82.0 percent of the average. Among them, the median of the per capita disposable income of urban residents was 12,870 yuan, an increase of 5.7 percent, and the median was 84.9 percent of the average; the median of the per capita disposable income of rural residents was 5,243 yuan, an increase of 7.8 percent, and the median was 79.5 percent of the average.
Per Capita Disposable Income and Its Growth of Urban and Rural Residents in the First Quarter of 2024
II. Consumption Expenditure of Households
In the first quarter of 2024, the nationwide per capita consumption expenditure was 7,299 yuan, a nominal increase of 8.3 percent over the previous year, and a real increase of 8.3 percent after deducting price factors. In terms of urban and rural areas, the per capita consumption expenditure of urban residents was 8,943 yuan, an increase of 7.7 percent, and a real increase of 7.7 percent after deducting price factors; the per capita consumption expenditure of rural residents was 5,050 yuan, an increase of 9.1 percent, and a real increase of 9.2 percent after deducting price factors.
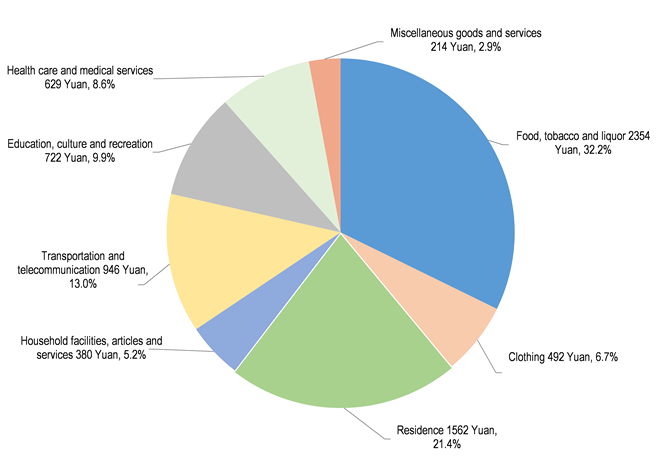
In the first quarter of 2024, the nationwide per capita consumption expenditure on food, tobacco and liquor was 2,354 yuan, an increase of 10.6 percent, accounting for 32.2 percent of the per capita consumption expenditure; the per capita consumption expenditure on clothing was 492 yuan, an increase of 12.4 percent, accounting for 6.7 percent of the per capita consumption expenditure; the per capita consumption expenditure on residence was 1,562 yuan, an increase of 0.1 percent, accounting for 21.4 percent of the per capita consumption expenditure; the per capita consumption expenditure on household facilities, articles and services was 380 yuan, an increase of 2.9 percent, accounting for 5.2 percent of the per capita consumption expenditure; the per capita consumption expenditure on transportation and telecommunication was 946 yuan, an increase of 14.8 percent, accounting for 13.0 percent of per capita consumption expenditure; the per capita consumption expenditure on education, culture and recreation was 722 yuan, an increase of 13.4 percent, accounting for 9.9 percent of the per capita consumption expenditure; the per capita consumption expenditure on health care and medical services was 629 yuan, an increase of 3.9 percent, accounting for 8.6 percent of the per capita consumption expenditure; the per capita consumption expenditure on miscellaneous goods and services was 214 yuan, an increase of 21.7 percent, accounting for 2.9 percent of the per capita consumption expenditure.
Per capita consumption expenditure and composition in the first quarter of 2024
Nationwide Income and Consumption Expenditure in the First Quarter of 2024
|
Item |
Absolute Value |
Growth Rate Y/Y (%) (Real Growth in Brackets) |
|
Nationwide per Capita Disposable Income |
11539 |
6.2(6.2) |
|
Grouped by Permanent Residence |
||
|
Urban residents |
15150 |
5.3(5.3) |
|
Rural residents |
6596 |
7.6(7.7) |
|
Grouped by Income Source |
||
|
Income from wages and salaries |
6585 |
6.8 |
|
Net business income |
1959 |
6.8 |
|
Net income from properties |
988 |
3.2 |
|
Net income from transfer |
2007 |
4.8 |
|
Median of Nationwide per Capita Disposable Income |
9462 |
6.4 |
|
Grouped by Permanent Residence |
||
|
Urban residents |
12870 |
5.7 |
|
Rural residents |
5243 |
7.8 |
|
Nationwide per Capita Consumption Expenditure |
7299 |
8.3(8.3) |
|
Grouped by Permanent Residence |
||
|
Urban residents |
8943 |
7.7(7.7) |
|
Rural residents |
5050 |
9.1(9.2) |
|
Grouped by Consumption Category |
||
|
Food, tobacco and liquor |
2354 |
10.6 |
|
Clothing |
492 |
12.4 |
|
Residence |
1562 |
0.1 |
|
Household facilities, articles and services |
380 |
2.9 |
|
Transportation and telecommunication |
946 |
14.8 |
|
Education, culture and recreation |
722 |
13.4 |
|
Health care and medical services |
629 |
3.9 |
|
Miscellaneous goods and services |
214 |
21.7 |
|
Notes: 1. Per capita disposable income nationwide = per capita disposable income of urban residents * proportion of urban population + per capita disposable income of rural residents * proportion of rural population. 2. Nominal growth rate of per capita disposable income of residents = (per capita disposable income of residents in the current year / per capita disposable income of residents in the previous year - 1) * 100%; actual growth rate of per capita disposable income of residents = (per capita disposable income of residents in the current year / per capita disposable income of residents in the previous year / per capita consumer price index of residents in the same period*100 - 1) * 100%. 3. The per capita income and consumption expenditure data of the whole country is based on the basic data of sampling survey of more than 160,000 households, and weighted and summarized according to the number of households represented by each sample household. Influenced by urbanization, population migration and other factors, the composition of population in different periods has changed, which sometimes leads to the phenomenon that the growth rate of some income and expenditure items of the whole country exceeds the growth range of corresponding income and expenditure items of urban and rural residents. It is mainly in the process of urbanization that some people with higher income in rural areas enter urban areas, but they belong to lower income groups in urban areas, and their migration has a pulldown effect on part of the income and expenditure of urban and rural residents; however, no matter in urban or rural areas, the growth effect will be reflected in the income and expenditure growth of all residents. 4. In the growth column compared with the previous year, the data in brackets is the actual growth rate, while others are the nominal growth rate. 5. The average and median income are statistics reflecting the trend of residents' income concentration. The average can not only directly reflect the overall situation, but also reflect the overall structure, which is convenient for the comparison of income levels of different groups, but also vulnerable to the influence of extreme data; the median reflects the situation of the object in the middle position, which is relatively stable and can avoid the influence of extreme data, but cannot reflect the structure. |
||
Income and Consumption Expenditure of Urban and Rural Residents in the First Quarter of 2024
|
Item |
Absolute Value (yuan) |
Nominal Growth Y/Y (%) |
|
Per Capita Disposable Income of Urban Residents |
15150 |
5.3 |
|
Grouped by Income Source |
||
|
Income from wages and salaries |
9230 |
5.9 |
|
Net business income |
1894 |
7.5 |
|
Net income from properties |
1571 |
2.2 |
|
Net income from transfer |
2455 |
3.4 |
|
Per Capita Consumption Expenditure of Urban Residents |
8943 |
7.7 |
|
Grouped by Consumption Category |
||
|
Food, tobacco and liquor |
2800 |
10.4 |
|
Clothing |
612 |
12.0 |
|
Residence |
2024 |
-0.7 |
|
Household facilities, articles and services |
450 |
1.2 |
|
Transportation and telecommunication |
1149 |
14.4 |
|
Education, culture and recreation |
886 |
13.7 |
|
Health care and medical services |
735 |
2.2 |
|
Miscellaneous goods and services |
287 |
21.6 |
|
Per Capita Disposable Income of Rural Residents |
6596 |
7.6 |
|
Grouped by Income Source |
||
|
Income from wages and salaries |
2965 |
8.7 |
|
Net business income |
2049 |
6.1 |
|
Net income from properties |
190 |
7.9 |
|
Net income from transfer |
1392 |
7.4 |
|
Per Capita Consumption Expenditure of Rural Residents |
5050 |
9.1 |
|
Grouped by Consumption Category |
||
|
Food, tobacco and liquor |
1741 |
10.3 |
|
Clothing |
328 |
12.5 |
|
Residence |
930 |
1.4 |
|
Household facilities, articles and services |
286 |
6.1 |
|
Transportation and telecommunication |
666 |
14.8 |
|
Education, culture and recreation |
499 |
12.1 |
|
Health care and medical services |
485 |
7.2 |
|
Miscellaneous goods and services |
115 |
20.4 |
Annotations:
1. Explanatory Notes
Disposable income of residents refers to the sum of final consumption expenditure and savings that residents can use, that is, the income that residents can use for free disposal, including both cash income and physical income. According to the source of income, disposable income includes income from wages and salaries, net business income, net income from properties and net income from transfer.
Consumption expenditure of residents refers to all the expenditures that residents use to meet their daily needs, including both cash and physical consumption. Consumption expenditure includes eight categories: food, tobacco and liquor, clothing, residence, household facilities, articles and services, transportation and telecommunication, education, culture and recreation, health care and medical services, and miscellaneous goods and services.
The median of the nationwide per capita disposable income refers to the per capita disposable income of residents which lies in the middle of all surveyed households ranked from low to high on the basis of per capita disposable income level.
The quarterly income and consumption expenditure data do not cover the income and consumption of the self-produced and self-used parts of residents, which are included in the annual income and consumption expenditure data.
2. Survey Methods
The national and sub urban and rural residents' income and consumption expenditure data comes from the household income and consumption expenditure and living conditions surveys organized and implemented by the National Bureau of Statistics of China, which is released quarterly.
Using a stratified, multi-stage, probability sampling method proportional to the size of population, the National Bureau of Statistics of China randomly selected 160,000 households in 2,000 counties (cities, administrative regions) of 31 provinces (autonomous regions, municipalities) as surveyed households.
According to the unified system and method, the survey organizations directly under the National Bureau of statistics of China will organize the surveyed households to record and collect the data of residents' income, expenditure, family operation, production and investment; meanwhile, according to the unified questionnaire, collect other information such as the employment of household members and labor force, the ownership of housing and durable consumer goods, and the coverage of residents' basic social and public services. After the completion of data collection, the municipal and county survey organizations use unified methods and data processing procedures to code, review and input the original investigation data, and then directly transmit the basic household data to the National Bureau of Statistics of China for unified summary and calculation.
3. Additional Description
Due to rounding-off, there may be differences between the total and the sum of subtotals.