Investment in Real Estate Development for Jan-Sep
1. The Completion of Investment in Real Estate Development
From January to September, the investment in real estate development was 8,726.9 billion yuan, a year-on-year decrease of 9.1 percent (calculated on a comparable basis, see Annotation 6 for details); among them, the investment in residential buildings was 6,627.9 billion yuan, down by 8.4 percent.
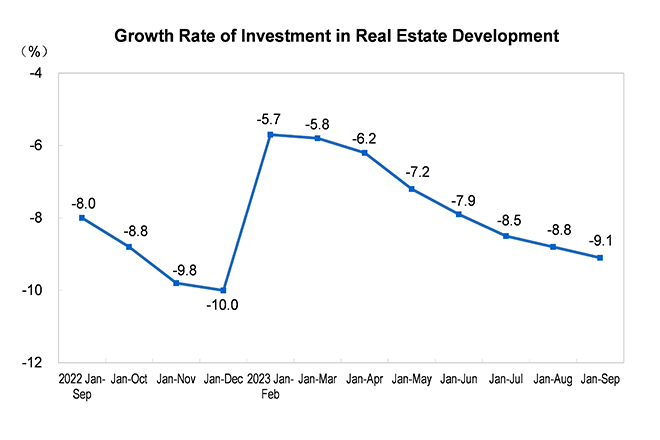
From January to September, the floor space of the real estate development enterprises under construction was 8,156.88 million square meters, a year-on-year decrease of 7.1 percent. Among them, the floor space of residential buildings under construction was 5,742.50 million square meters, down by 7.4 percent. The floor space of buildings newly started was 721.23 million square meters, down by 23.4 percent. Among them, the floor space of residential buildings newly started was 525.12 million square meters, down by 23.9 percent. The floor space of buildings completed was 487.05 million square meters, up by 19.8 percent. Among them, the floor space of residential buildings completed was 353.19 million square meters, up by 20.1 percent.
2. Sales of Commercial Buildings
From January to September, the floor space of commercial buildings sold was 848.06 million square meters, a year-on-year decrease of 7.5 percent, of which the floor space of residential buildings sold decreased by 6.3 percent. The sales of commercial buildings was 8,907.0 billion yuan, down by 4.6 percent, of which the sales of residential buildings decreased by 3.2 percent.
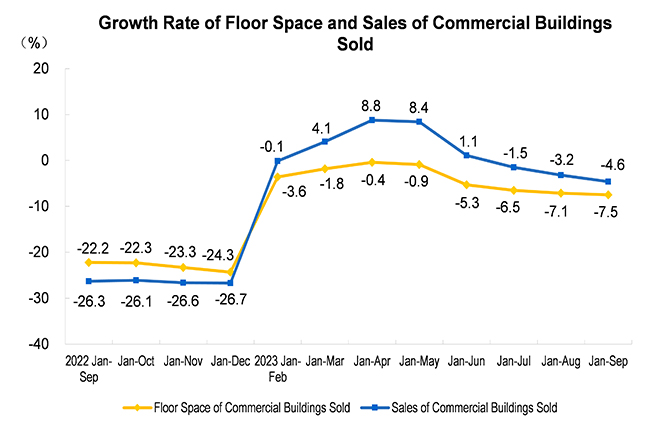
At the end of September, the floor space of the commercial buildings for sale was 645.37 million square meters, a year-on-year increase of 18.3 percent. Among them, the floor space of the residential buildings for sale increased by 19.7 percent.
3. Funds for Investment This Year for Real Estate Development Enterprises
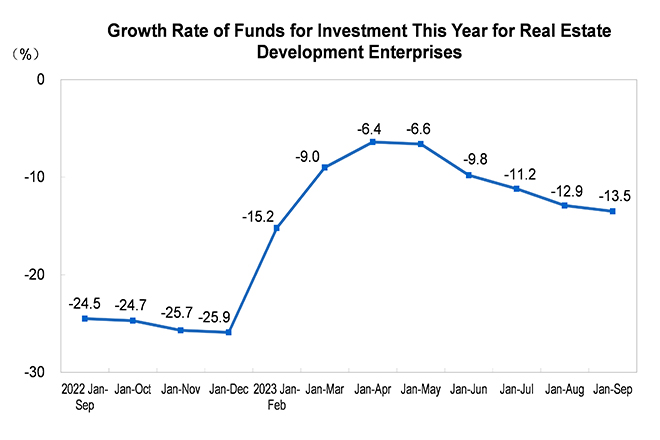
From January to September, the funds for investment for real estate development enterprises were 9,806.7 billion yuan, a year-on-year decrease of 13.5 percent. Among them, the domestic loans were 1,210.0 billion yuan, down by 11.1 percent; the utilized foreign investment was 3.6 billion yuan, down by 40.0 percent; the self-raised funds reached 3,125.2 billion yuan, down by 21.8 percent; deposits and advance receipts were 3,363.1 billion yuan, down by 9.6 percent; the individual mortgage reached 1,702.8 billion yuan, down by 6.9 percent.
4. National Real Estate Climate Index
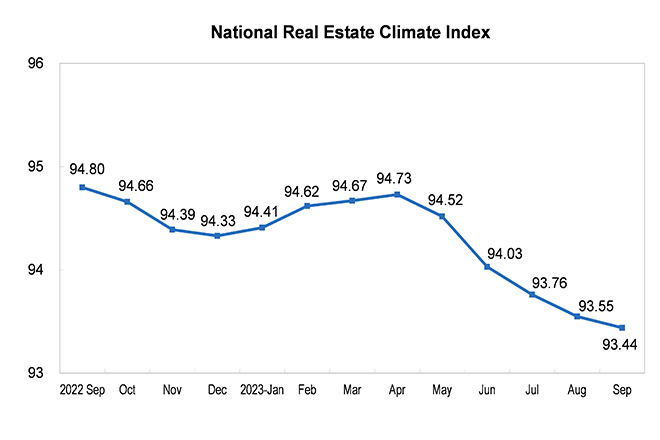
In September, the national real estate climate index was 93.44.
Real Estate Development and Sales for Jan-Sep
|
Indicators |
Absolute Value |
Growth Rate Y/Y (%) |
|
Investment in real estate development (100 million yuan) |
87269 |
-9.1 |
|
Of which: Residential buildings |
66279 |
-8.4 |
|
Office buildings |
3437 |
-11.0 |
|
Buildings for commercial business |
6269 |
-17.6 |
|
Floor space of buildings under construction (10,000 sq.m) |
815688 |
-7.1 |
|
Of which: Residential buildings |
574250 |
-7.4 |
|
Office buildings |
32260 |
-5.5 |
|
Buildings for commercial business |
70825 |
-9.5 |
|
Floor space of buildings newly started (10,000 sq.m) |
72123 |
-23.4 |
|
Of which: Residential buildings |
52512 |
-23.9 |
|
Office buildings |
1938 |
-20.2 |
|
Buildings for commercial business |
4910 |
-23.6 |
|
Floor space of buildings completed (10,000 sq.m) |
48705 |
19.8 |
|
Of which: Residential buildings |
35319 |
20.1 |
|
Office buildings |
1461 |
15.0 |
|
Buildings for commercial business |
3469 |
3.6 |
|
Floor space of commercial buildings sold (10,000 sq.m) |
84806 |
-7.5 |
|
Of which: Residential buildings |
72770 |
-6.3 |
|
Office buildings |
1948 |
-11.8 |
|
Buildings for commercial business |
4501 |
-17.0 |
|
Sales of commercial buildings (100 million yuan) |
89070 |
-4.6 |
|
Of which: Residential buildings |
79311 |
-3.2 |
|
Office buildings |
2640 |
-16.1 |
|
Buildings for commercial business |
4786 |
-14.6 |
|
Floor space of commercial buildings for sale (10,000 sq.m) |
64537 |
18.3 |
|
Of which: Residential buildings |
31186 |
19.7 |
|
Office buildings |
4730 |
21.4 |
|
Buildings for commercial business |
14027 |
14.1 |
|
Funds for investment this year for real estate development enterprises (100 million yuan) |
98067 |
-13.5 |
|
Of which: Domestic loans |
12100 |
-11.1 |
|
Foreign investment |
36 |
-40.0 |
|
Self-raised funds |
31252 |
-21.8 |
|
Deposits and advance receipts |
33631 |
-9.6 |
|
Individual mortgage |
17028 |
-6.9 |
Real Estate Investment in Eastern, Central, Western and Northeastern Regions for Jan-Sep
|
Regions |
Investment (100 million yuan) |
Growth Rate Y/Y (%) |
||
|
Residential Buildings |
Residential Buildings |
|||
|
National Total |
87269 |
66279 |
-9.1 |
-8.4 |
|
Eastern |
51652 |
38056 |
-4.4 |
-4.0 |
|
Central |
17072 |
13953 |
-8.4 |
-6.9 |
|
Western |
16107 |
12379 |
-19.4 |
-18.0 |
|
Northeastern |
2438 |
1891 |
-27.2 |
-29.5 |
Sales of Commercial Buildings in Eastern, Central, Western and Northeastern Regions for Jan-Sep
|
Regions |
Floor Space of Commercial Buildings Sold |
Sales of Commercial Buildings |
||
|
Absolute Value (10,000 sq.m) |
Growth Rate Y/Y (%) |
Absolute Value (100 million yuan) |
Growth Rate Y/Y (%) |
|
|
National Total |
84806 |
-7.5 |
89070 |
-4.6 |
|
Eastern |
38822 |
-5.2 |
54953 |
-3.0 |
|
Central |
21850 |
-11.0 |
16106 |
-9.2 |
|
Western |
21107 |
-8.7 |
15858 |
-4.4 |
|
Northeastern |
3027 |
-2.4 |
2154 |
-8.5 |
Annotations:
1. Explanation of Indicator
The total investment in real estate development this year: refers to the investment of all construction projects for housing, land development projects, public welfare construction and land acquisition costs in the reporting period. The index is cumulatively statistical data based on the principle of image progress.
Floor space of commercial buildings sold: refer total areas sold of new commercial buildings in the contract during the reporting period (i.e. area of floor space designated in the formal contract signed by both sides). The index is cumulatively statistical data based on the principle of image progress.
Sales of commercial buildings: refers to the total contracted vale of new commercial buildings for sale during the reporting period (i.e. the total value of sales for selling of commercial building as designated in the formal contract signed by both sides). This indicator is cumulative data, on the same comparable basis with the floor space of commercial buildings sold.
Floor space of commercial buildings for sale: refers to the area of commercial housing that has not been sold or leased among the completed construction areas of commercial housing available for sale or lease at the end of the reporting period, including the area of housing completed in the previous year and the current period, but excluding the floor area of buildings that cannot be sold or leased, such as those are demolished to rebuilt, unified and agent-construction, public supporting buildings, self-used by real estate enterprises and relocation houses that have been completed in the reporting period.
Funds for investment this year for real estate development enterprises: refers to various currencies and sources of real estate development funds actually available by the real estate development enterprises in the reporting period. Specifically, it includes domestic loans, foreign investment, self-raised funds, deposits and advance receipts, individual mortgage and other funds. The index is cumulatively statistical data based on the principle of image progress.
Floor space of buildings under construction: refers to the total floor space of all buildings by the real estate development enterprises during the reporting period. Including floor space newly started in current year, floor space of continued construction of the building from the former period, floor space of stopped or postponed in the previous period but recovered in current year, floor space completed during current year, and newly started floor space in current year but postponed. Floor space under construction of multi-storey buildings refers to the total floor space of all storeys.
Floor space of buildings newly started: refers to floor space of buildings newly started by the real estate development enterprises during the reporting period, the unit project as the accounting object. Not including continued construction area of buildings which started in the previous period and entered the reporting period, and restarted construction area in the current year but stopped or postponed in the previous period. Specific due date is subject to starts to housing officially began ground-breaking gouge (ground treatment or permanent piles). Floor space of buildings newly started refers to the entire floor spaces of whole building; the calculation cannot be separated.
Floor space of buildings completed: refers to housing construction during the reporting period have been completed in accordance with design requirements, achieved to living and conditions of use, acceptance of accreditation standards or to the final acceptance, total building areas could formally hand over to be used.
2. Statistics Coverage
All real estate development and corporate business units.
3. Survey Methods
Collected monthly with complete enumeration (no report in January).
4. Brief Description on National Real Estate Climate Index
The national real estate climate index follows the theory of economic cycle fluctuation, based on the business cycle theory and business cycle analysis, using time series, multivariate statistics, econometric analysis, taking investment in real estate development as the benchmarks, selecting related indicators such as real estate investment, capital, area, sales, excluding the impact of seasonal factors, including random factors, compiled by adopting the growth rate cycles method. The historical data will be revised monthly according to the newly added data. National real estate index selected year 2012 as the base year, and its growth rate was set at 100. Typically, the most appropriate level of national real estate climate index is 100, the moderate level is between 95 and 105, the lower level is below 95, and the higher level is above 105.
5. Division on Eastern, Central, Western and Northeastern Regions
The eastern region includes Beijing, Tianjin, Hebei, Shanghai, Jiangsu, Zhejiang, Fujian, Shandong, Guangdong, and Hainan. The central region includes Shanxi, Anhui, Jiangxi, Henan, Hubei, and Hunan. The western region includes Inner Mongolia, Guangxi, Chongqing, Sichuan, Guizhou, Yunnan, Xizang, Shaanxi, Gansu, Qinghai, Ningxia, and Xinjiang. Northeastern region includes Liaoning, Jilin, and Heilongjiang.
6. Explanation of Year-on-Year Growth Rate
The growth rate of indicators, including investment in real estate development and floor space of commercial building sold, are calculated on a comparable basis. There are non-comparable factors between data during the reporting period and data of the same period of the previous year that have announced, so it is incorrect to directly calculate the growth rate by dividing the data of two different years. The main reasons are: (1) in order to strengthen management for the projects in the inventory, the sales data of commercial building that broke the contract have been revised. (2) In order to strengthen statistical law enforcement, the error data found in inspections have been revised in accordance with the relevant provisions. (3) In order to strengthen the data quality management, the investment in non-real estate development projects and sales data of mortgaged buildings have been eliminated.