Purchasing Managers Index for February 2018
Department of Service Statistics of NBS
China Federation of Logistics and Purchases (CFLP)
1. Manufacturing purchasing managers index
In February 2018, China's manufacturing purchasing managers index (PMI) was 50.3 percent, a decrease of 1.0 percentage point from last month. The manufacturing industry generally continued its steady expansion, and the growth rate has slowed down.
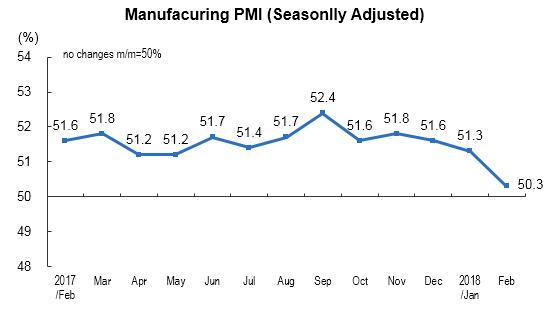
In view of the sizes of enterprises, the PMI of large-sized enterprises was 52.2 percent, decreased 0.4 percentage points from last month, and continue stay in the expansion range; that of medium-sized and small-sized enterprises were 49.0 and 44.8 percent, decreased 1.1 and 3.7 percentage points from last month respectively.
Among the five sub-indices composing PMI, the production index and new orders index were higher than the threshold. The main raw materials inventory index, employed person index and supplier delivery time index were lower than the threshold.
Production index was 50.7 percent, a decrease of 2.8 percentage points month-on-month, but still in the expansion range, indicating that the growth rate of manufacturing production has slowed down, affected by the Spring Festival holiday.
New orders index was 51.0 percent, a decrease of 1.6 percentage points month-on-month, higher than the threshold, showing that the the expansion of manufacturing market demand has slowed down.
Main raw materials inventory index was 49.3 percent, increased 0.5 percentage points from last month, lower than the threshold, indicating that pace of declined of the main raw material inventory of manufacturing industry continued to be narrowed.
Employed person index was 48.1 percent, decreased 0.2 percentage points from last month, lower than the threshold, indicating that the labor employment of manufacturing enterprises declined.
Supplier delivery time index was 48.4 percent, decreased 0.8 percentage points from last month, and was below the threshold, indicating that the delivery time of manufacturing raw material suppliers slowed down.
| China's Manufacturing PMI (Seasonally Adjusted) | ||||||
| Unit: % | ||||||
|
| PMI |
| ||||
| Production Index | New Orders Index | Main Raw Materials Inventory Index | Employed Person Index | Supplier Delivery Time Index | ||
|
|
|
|
|
|
|
|
| 2017-February | 51.6 | 53.7 | 53.0 | 48.6 | 49.7 | 50.5 |
| March | 51.8 | 54.2 | 53.3 | 48.3 | 50.0 | 50.3 |
| April | 51.2 | 53.8 | 52.3 | 48.3 | 49.2 | 50.5 |
| May | 51.2 | 53.4 | 52.3 | 48.5 | 49.4 | 50.2 |
| June | 51.7 | 54.4 | 53.1 | 48.6 | 49.0 | 49.9 |
| July | 51.4 | 53.5 | 52.8 | 48.5 | 49.2 | 50.1 |
| August | 51.7 | 54.1 | 53.1 | 48.3 | 49.1 | 49.3 |
| September | 52.4 | 54.7 | 54.8 | 48.9 | 49.0 | 49.3 |
| October | 51.6 | 53.4 | 52.9 | 48.6 | 49.0 | 48.7 |
| November | 51.8 | 54.3 | 53.6 | 48.4 | 48.8 | 49.5 |
| December | 51.6 | 54.0 | 53.4 | 48.0 | 48.5 | 49.3 |
| 2018-January | 51.3 | 53.5 | 52.6 | 48.8 | 48.3 | 49.2 |
| February | 50.3 | 50.7 | 51.0 | 49.3 | 48.1 | 48.4 |
|
|
|
|
|
|
|
|
| Related Indicators of China's Manufacturing PMI (Seasonally Adjusted) | ||||||||
| Unit: % | ||||||||
|
| New Export Orders Index | Import Index | Purchase Quantity Index | Main Raw Material Purchase Price Index | Producer Price Index | Finished Goods Inventory Index | Open Orders Index | Production And Business Activities Expectation Index |
|
|
|
|
|
|
|
|
|
|
| 2017-February | 50.8 | 51.2 | 51.4 | 64.2 | 56.3 | 47.6 | 46.0 | 60.0 |
| March | 51.0 | 50.5 | 53.4 | 59.3 | 53.2 | 47.3 | 46.1 | 58.3 |
| April | 50.6 | 50.2 | 51.9 | 51.8 | 48.7 | 48.2 | 45.0 | 56.6 |
| May | 50.7 | 50.0 | 51.5 | 49.5 | 47.6 | 46.6 | 45.4 | 56.8 |
| June | 52.0 | 51.2 | 52.5 | 50.4 | 49.1 | 46.3 | 47.2 | 58.7 |
| July | 50.9 | 51.1 | 52.7 | 57.9 | 52.7 | 46.1 | 46.3 | 59.1 |
| August | 50.4 | 51.4 | 52.9 | 65.3 | 57.4 | 45.5 | 46.1 | 59.5 |
| September | 51.3 | 51.1 | 53.8 | 68.4 | 59.4 | 44.2 | 47.4 | 59.4 |
| October | 50.1 | 50.3 | 53.2 | 63.4 | 55.2 | 46.1 | 45.6 | 57.0 |
| November | 50.8 | 51.0 | 53.5 | 59.8 | 53.8 | 46.1 | 46.6 | 57.9 |
| December | 51.9 | 51.2 | 53.6 | 62.2 | 54.4 | 45.8 | 46.3 | 58.7 |
| 2018-January | 49.5 | 50.4 | 52.9 | 59.7 | 51.8 | 47.0 | 45.3 | 56.8 |
| February | 49.0 | 49.8 | 50.8 | 53.4 | 49.2 | 46.7 | 44.9 | 58.2 |
|
|
|
|
|
|
|
|
|
|
2. Non-manufacturing purchasing managers index
In February 2018, China's non-manufacturing purchasing managers index was 54.4 percent, a decrease of 0.9 percentage points from the previous month, and 0.2 percentage points higher than the same period of last year. The non-manufacturing industry still maintained a high level of prosperity as a whole.
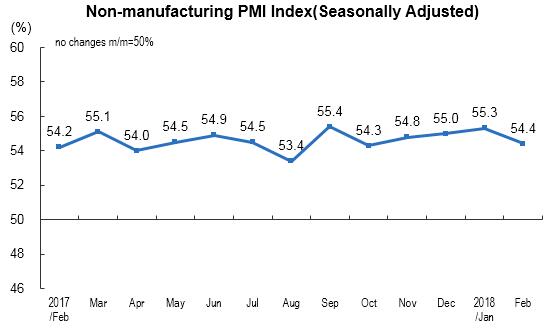
In view of different industries, non-manufacturing purchasing managers index of service industry was 53.8 percent, a decrease of 0.6 percentage points from the previous month, but higher than that of the same period of last year, and the service industry maintained its rapid growth. Of which, the indices of industries related to Spring Festival holiday consumption such as retail trade, restaurants, transport via railway, air transport, telecommunications, broadcasting, television and satellite transmission services, Internet, software and information technology services, ecological protection and environmental control, were positioned in the high level of the range which above 56.0 percent, and the total business grew significantly. The indices of capital market services, insurance, real estate, resident services and repair, were lower than the threshold, and the total business decreased. Non-manufacturing purchasing manager index of construction industry achieved 57.5 percent, a decrease of 3.0 percentage points from the previous month. The growth of construction industry has slowed down.
New orders index was 50.5 percent, down by 1.4 percentage point from the previous month, and continued to stay above the threshold, indicating that the market demand of non-manufacturing industry still kept increasing, while the amount of increase has narrowed. In view of different industries, the new orders index of service industry was 50.7 percent, decreased 1.1 percentage points from the previous month, still higher than the threshold. The new orders index of construction industry was 49.5 percent, decreased 3.3 percentage points from the previous month, and dropped below the threshold.
Input price index was 53.2 percent, down by 0.7 percentage points from the previous month, and continued to stay above the threshold, indicating that the amount of increase of the input price during the process of non-manufacturing enterprises’ operating activities continued to decline. In view of different industries, the intermediate input price indices of service industry was 52.4 percent, decreased 1.1 percentage points from the previous month. The input price index of construction industry was 57.9 percent, an increase of 1.7 percentage points from the previous month.
The sales price index was 49.9 percent, down by 2.7 percentage points from the previous month, lower than the threshold, indicating that the overall level of non-manufacturing sales prices decreased slightly. In view of different industries, the sales price index of service industry was 49.6 percent, a decrease of 2.9 percentage points from the previous month, and lower than the threshold.The sales price index of construction industry was 51.7 percent, a decrease of 1.6 percentage points from the previous month.
Employment index was 49.6 percent, an increase of 0.2 percentage points from the previous month, and continued to be lower than the threshold, indicating that the pace of decline of non-manufacturing labor employment has narrowed slightly. In view of different industries, the employment index of service industry was 48.9 percent, an increase of 0.5 percentage points from the previous month. The employment index of construction industry was 53.5 percent, a decrease of 1.9 percentage points from the previous month.
Business activities expectation index was 61.2 percent, a decrease of 0.5 percentage points from last month, and kept staying in the high level of the range which above 60.0 percent for ten consecutive months. In view of different industries, the business activities expectation index of service industry was 60.4 percent, a decrease of 0.8 percentage points from the previous month. That of construction industry was 65.7 percent, an increase of 1.0 percentage point from the previous month.
| Main Indices of China's Non-manufacturing PMI (Seasonally Adjusted) | ||||||
| Unit: % | ||||||
|
| Non-manufacturing PMI | New Orders Index | Input Price Index | Sales Price Index | Employment Index | Business Activities Expectation Index |
|
|
|
|
|
|
|
|
| 2017-February | 54.2 | 51.2 | 53.7 | 51.4 | 49.7 | 62.4 |
| March | 55.1 | 51.9 | 52.3 | 49.7 | 49.1 | 61.3 |
| April | 54.0 | 50.5 | 51.7 | 50.2 | 49.5 | 59.7 |
| May | 54.5 | 50.9 | 51.1 | 48.8 | 49.0 | 60.2 |
| June | 54.9 | 51.4 | 51.2 | 49.3 | 49.6 | 61.1 |
| July | 54.5 | 51.1 | 53.1 | 50.9 | 49.5 | 61.1 |
| August | 53.4 | 50.9 | 54.4 | 51.5 | 49.5 | 61.0 |
| September | 55.4 | 52.3 | 56.1 | 51.7 | 49.7 | 61.7 |
| October | 54.3 | 51.1 | 54.3 | 51.6 | 49.4 | 60.6 |
| November | 54.8 | 51.8 | 56.2 | 52.8 | 49.2 | 61.6 |
| December | 55.0 | 52.0 | 54.8 | 52.6 | 49.3 | 60.9 |
| 2018-January | 55.3 | 51.9 | 53.9 | 52.6 | 49.4 | 61.7 |
| February | 54.4 | 50.5 | 53.2 | 49.9 | 49.6 | 61.2 |
|
|
|
|
|
|
|
|
| Other Indices of China's Non-manufacturing PMI (Seasonally Adjusted) | ||||
| Unit: % | ||||
|
| Foreign New Orders Index | Unfilled Orders Index | Stock Index | Supplier Delivery Time Index |
|
|
|
|
|
|
| 2017-February | 50.1 | 43.5 | 45.8 | 52.1 |
| March | 48.8 | 44.7 | 45.8 | 51.4 |
| April | 47.1 | 44.0 | 46.2 | 52.0 |
| May | 48.5 | 43.7 | 46.1 | 51.8 |
| June | 49.8 | 44.6 | 45.9 | 51.8 |
| July | 52.1 | 43.9 | 45.9 | 51.7 |
| August | 49.0 | 44.0 | 45.5 | 51.1 |
| September | 49.7 | 44.2 | 47.0 | 51.6 |
| October | 50.7 | 43.9 | 46.4 | 51.1 |
| November | 50.9 | 44.1 | 46.5 | 51.6 |
| December | 51.5 | 43.8 | 46.3 | 51.3 |
| 2018-January | 50.1 | 44.4 | 46.5 | 51.3 |
| February | 45.9 | 43.8 | 47.6 | 50.7 |
|
|
|
|
|
|
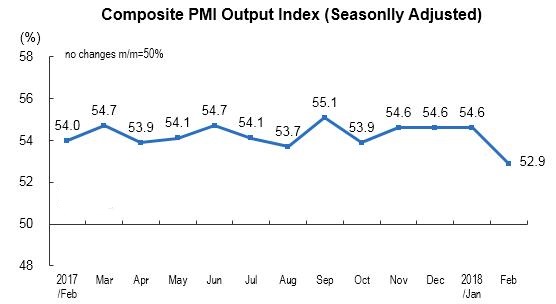
3. Composite PMI Output Index
In February 2018, China's Composite PMI Output Index was 52.9 percent, a decrease of 1.7 percentage points from last month, but still higher than the threshold, indicating that the overall production and operation activities of Chinese enterprises continued to maintain their expansion.
Annotations:
1. Explanatory Notes
Purchasing Managers Index (PMI) is an index summarized and compiled through the results of the monthly survey of enterprises purchasing managers. It covers every links of the enterprises, including purchasing, production, logistics, and so on. It is one of the leading indices which was commonly adopted by international society to monitor the macroeconomic trends, and played an important role in forecasting and monitoring. The Composite PMI Output Index, belonging to the PMI indicator system, is a composite index reflecting the changes in the output in current period of the entire industry (manufacturing and non-manufacturing industries). The threshold of PMI is usually using 50 percent as the cut-off point for economic performance. If PMI above 50 percent, it reflects the overall economy is expanding; if less than 50 percent, it reflects the overall economy is in recession.
2.Statistical Coverage
The survey involves 31 divisions of manufacturing industry in the “Industrial Classification for National Economic Activities” (GB/T4754-2011), and 3000 samples, as well as 31 divisions of non-manufacturing industry, and 4000 samples.
3. Survey Methods
PPS (Probability Proportional to Size) sampling method was adopted in purchasing managers’ survey. Using the divisions of the manufacturing or non-manufacturing industry as the selecting strata, the sample size of each division is proportional to its proportion of the value-added of the division to the total value-added of the manufacturing or non-manufacturing industry. Within the stratum, the samples are selected according to the probabilities proportional to their principal business revenues of the enterprises.
The survey was organized and conducted by staff members of survey offices, monthly through Online Reporting System of NBS by sending survey questionnaires to the purchasing managers of the selected enterprises.
4. Calculation Methods
(1) Calculation Methods of Sub-indices.
The indicator system of manufacturing purchasing managers’ survey covers 13 sub-indices such as production, new orders, export orders, existing orders, finished goods inventory, purchase, import, purchase price, producer price, raw materials inventory, employees, suppliers, delivery time, production and business activities expectation. Non-manufacturing purchasing managers survey involves 10 questions on production, new orders (business required), export, existing orders, finished goods inventory, intermediate input price, subscription price, employees, suppliers delivery time, and business activities expectation. The indicator system of non-manufacturing purchasing managers’ survey covers 10 sub-indices such as business activities, new orders, new export orders, existing orders, finished goods inventory, intermediate input price, subscription price, employees, suppliers delivery time, and business activities expectation. Sub-indices adopt diffusion index calculation method, i.e. percentage of positive answers in number of enterprises plus half of the percentage in the same answers. Due to the lack of synthesis of non-manufacturing integrated PMI index, the international society often used business activity index to reflect the overall changes in non-manufacturing economic development.
(2) Calculation Methods of Manufacturing PMI.
Manufacturing PMI was calculated according to five diffusion indices (group indices) and their weights. 5 group indices and their weights are determined in accordance with their leading impact on the economy. Specifically, new orders index weighted 30 percent; production index weighted 25 percent; employees index weighted 20 percent; supplier delivery time index weighted 15 percent; raw materials inventory index weighted 10 percent. Of which, the supplier delivery time index is a converse index, and contrary calculation is needed when combines it into PMI.
(3) Calculation Methods of Composite PMI Output Index.
Composite PMI Output Index was calculated by weighted summation of the manufacturing output index and non-manufacturing business activity index. Their weights are determined by the proportion manufacturing and non-manufacturing industries in GDP. This index will be released since January 2018.
5. Seasonal adjustment
The purchasing managers’ survey is a monthly survey, the data of the survey fluctuates very much for the influences of seasonal factors. The released PMI composite index and sub-indices are seasonally adjusted data.