Income of Urban and Rural Residents in 2011
According to the result of nationwide sampling survey on 74 thousand rural residents and 66 thousand urban residents in 31 provinces (autonomous regions, municipalities) of China, the growth rate of urban and rural residents’ income in 2011 is as follows:
I. Income of rural residents
1. Per capita net income of rural residents
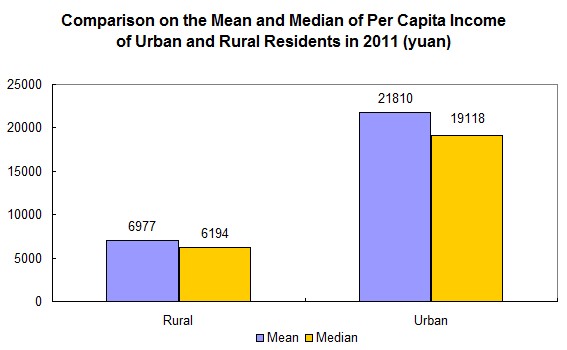
In 2011, the per capita net income of rural residents was 6,977 yuan, increased 1,058 yuan over the previous year, up by 17.9 percent. After deducting price factors, the real growth rate was 11.4 percent, the year-on-year growth rate went up by 0.5 percentage point. Of which:
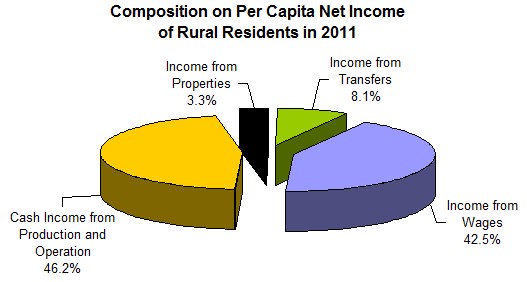
Per capita income from wages of rural residents was 2,963 yuan, climbed 532 yuan, a year-on-year increase of 21.9 percent. Annual wage income contribution rate occupied 50.3 percent to the growth of rural residents' income, the proportion of income from wages of rural residents was 42.5 percent, promoted 1.4 percentage points year-on-year. The fast growth of wage income was mainly due to the accelerated growth of wages of migrant workers.
Cash income from primary industry by production and operation of rural residents achieved 2,520 yuan, increased 289 yuan, a rise of 12.9 percent. Of which, per capita net income from agriculture was 1,897 yuan, increased 173 yuan, an increase of 10.0 percent. The good harvest and high prices were the main reasons to maintain a rapid growth of agricultural income. In 2011, increase in income from selling agricultural products by rural residents, 60 percent came from the price increasing, 40 percent came from increasing number of sold. Per capita net income of animal husbandry stood at 463 yuan, an increase of 107 yuan, the growth rate rose significantly to 30.1 percent after consecutive declined in 2009 and 2010. The main reason was the increased price of livestock products, especially due to rising prices of live pigs.
Cash income from secondary and tertiary industries by production and operation of rural residents achieved 702 yuan, increased 101 yuan, and rose by 16.7 percent. Of which, cash income from secondary industry stood at 193 yuan, increased 11 yuan, rose by 5.8 percent. Cash income from tertiary industry stood at 509 yuan, increased 90 yuan, and rose by 21.4 percent.
Per capita cash income from properties was 229 yuan, increased 26 yuan, and went up by 13.0 percent.
Per capita cash income from transfers was 563 yuan, increased 110 yuan, went up by 24.4 percent. By the impacts of comprehensively promote the rural old-age insurance policies, rapid income growth in per capita cash income from transfers, promoted 10.6 percentage points over the previous year. Of which, per capita income of pensions for retirees was 190 yuan, increased 77 yuan, up by 68.6 percent.
2. The median per capita net income
In 2011, the median per capital net income of rural residents was 6,194 yuan, increased 995 yuan over the previous year, rose by 19.1 percent. The median per capital net income of rural residents was 783 yuan lower than the per capita net income, while that of an increase of 1.2 percentage points of the growth rate.
In 2011, the income of most rural residents gained a rapid growth, but cotton, potatoes and some other agricultural prices caused some farmers sharply reduce, or even a loss, pulled down the growth rate of per capita net income of rural residents.
II. Income of urban residents
1. Per capita income and per capita disposable income
In 2011, per capita income of urban residents stood at 23,979 yuan, of which, per capita disposable income stood at 21,810 yuan, increased 2,701 yuan over the previous year, rose by 14.1 percent. The per capita disposable income of urban residents grew by 8.4 percent, and 0.6 percentage points year-on-year after deducting the price factors. The growth of per capita income by items is as follows:
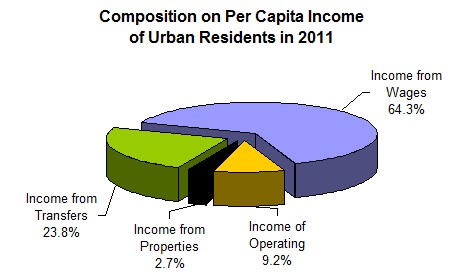
Per capita wage income stood at 15,412 yuan, rose by 12.4 percent. Main reason was the most areas raised the standards of the minimum wages, some areas continued to regulate the implementation of allowances and subsidies system, some enterprises improved the wages and bonuses.
Per capita net income of operating accounted for 2,210 yuan, increased 29.0 percent. Firstly, the economy was generally good throughout the year, gained increase in the number of individual operators; secondly, value-added tax and business tax threshold of the self-employees increased, and tax reduced.
Per capita income from properties stood at 649 yuan, increased 24.7 percent. The main reason was due to the impacts on the large increases in housing rent, and per capita income growth of housing rent of urban residents.
Per capita transfer income amounted to 5,709 yuan, increased 12.1 percent. The main reason was due to the level of basic pension for enterprise retirees and the minimum living standard gained improvement.
2. Median of per capita disposable income
In 2011, the median of per capita disposable income of urban residents stood at 19,118 yuan, increased 2,279 yuan over the previous year, rose by 13.5 percent. The median of disposable income of urban residents was 2,692 yuan lower than the per capita disposable income, and 0.6 percentage points lower of the growth rate. The main reason was due to the impacts of minimum wage, urban residents' basic pension, retirement payments, and minimum living standards, the income of urban low-income residents maintained fast growth, and high-income residents also maintained a rapid growth rate simultaneously, hence, the middle-income residents growth was relatively slow.
III. The income gap between urban and rural residents
In 2011, the ratio of per capita disposable income of urban residents and per capita net income of rural residents was 3.13:1, the ratio in 2010 was 3.23:1.

Note: The urban residents used per capita disposable income, while that of rural residents used per capita net income. Per capita net income of rural residents stood for 1 with comparison.
Annotations:
1. Explanatory Notes
Permanent rural population: refers to persons staying at home regularly or for over 6 months during a year and integrated with a household economically and in terms of living. Members of a household staying away from the residence for over 6 months but keeping a close economic relation with the household by sending the majority of income to the household are also regarded as permanent residents of a household.
Net income of rural residents: refers to the total income of rural residents from all sources minus all corresponding expenses. It was classified as the sum of income from wages and salaries, income from household operations, income from properties and income from transfers, minus household operation expenses, depreciation of fixed assets for production, taxes and fees paid, and gifts to non-rural relatives. In the actual course of the survey, wage income was mailed and returned income by the long-term migrant workers. Per Capita Net Income of Rural Residents=Total Net Income of Selected Households/ Total Number of Permanent Residents of Selected Households
Permanent urban population: refers the population living in urban areas more than half years. In the actual course of the survey, the cooperative degree of the selected immigrating population and high-income residents was relatively low, because of high floating, strong consciousness of privacy protection, or busy working. Therefore, the proportion of immigrating population and high-income residents in the sample of survey was under-estimated in a certain degree.
Disposable income of urban residents: refers to the actual income at the disposal of members of the residents which can be used for final consumption, other non-compulsory expenditure and savings. This equals to the sum of income from wages and salaries, cash income from household operations, income from properties and income from transfers, minus income tax, personal contribution to social security and subsidy for keeping diaries in being a sample household. Currently, disposable income of urban residents included cash income received only. Per Capita Disposable Income of Urban Residents= Total Disposable Income of Selected Households/ Total Number of Permanent Residents of Selected Households
The median of per capita income: refers to all the households in survey sorting by per capita income levels from low to high order, per capita income of the household in the most middle of queue.
2.Data Sources
The data of net income of rural residents and per capita disposable income of urban residents came from the Rural Residents Income and Expenditure Survey and Urban Residents Income and Expenditure Survey implemented by Survey Offices of the National Bureau of Statistics at all levels. Rural Residents Income and Expenditure Survey was conducted in 896 counties and 74 thousand rural residents in the county in 31 provinces (autonomous regions and municipalities) selected by multi-stage, stratified, and random sampling method, through household accounting, collecting resident cash income and expenditure, balance of payments in kind and resident operation and other information. Urban Residents Income and Expenditure Survey was conducted in 476 cities and counties and 66 thousand urban residents in 31 provinces (autonomous regions and municipalities),selected by stratified, two-phase random sampling method, through household accounting, collecting basic information on resident income, expenditure, employment and housing. The primary data of survey was directly reported by the Survey Offices at county and municipal levels after coding, data entry and auditing, the national and provincial income and expenditure data were directly summarized by the NBS.