 Chinese(GB)
 China Statistical Database
 E-Mail
NATIONAL BUREAU OF STATISTICS
PEOPLE’S REPUBLIC OF
In 2002, under the correct leadership of the Central Party Committee and the State Council, people of all nationalities of
I. General Outlook
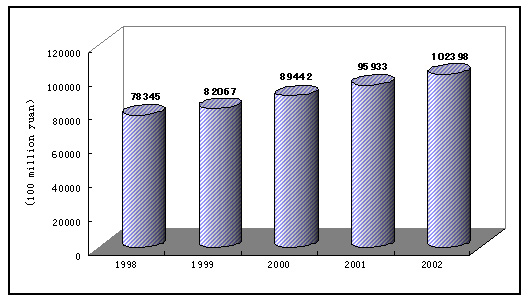
The national economy maintained relatively fast growth. The gross domestic product (GDP) of the year topped the 10 trillion yuan level to reach 10,239.8 billion yuan, up by 8 percent over the previous year at comparable prices. The value-added of the primary industry was 1,488.3 billion yuan, up by 2.9 percent. The value-added of the secondary industry was 5,298.2 billion yuan, up by 9.9 percent. The value-added of the tertiary industry was 3,453.3 billion yuan, up by 7.3 percent.
Figure 1: Gross Domestic Product Topped 10,000 Billion
The general price level declined by small margin. The general level of consumer prices in
Table 1: Change in Consumer Prices over 2001 (%)
|
Item |
National average |
| |
|
Urban |
Rural | ||
|
General level of consumer prices |
-0.8 |
-1.0 |
-0.4 |
|
Food |
-0.6 |
-0.5 |
-0.7 |
|
of which: grain |
-1.7 |
-1,7 |
-1.6 |
|
Tobaccos and alcohols |
-0.1 |
-0.1 |
0 |
|
Clothing |
-2.4 |
-2.7 |
-1.6 |
|
Household appliances and services |
-2.5 |
-2.7 |
-2.2 |
|
Medical, health and personal articles |
-1.2 |
-2.0 |
0.1 |
|
Transportation and telecommunications |
-1.9 |
-2.0 |
-1.8 |
|
Recreational, educational, cultural articles and services |
0.6 |
0.2 |
1.2 |
|
Housing |
-0.1 |
-0.2 |
0.1 |
The size of employment continued to expand. By the end of 2002, the total of employed people in
Steady progress was made in the reform of economic system and in the structural adjustment. Competition through the market has taken initial shape in the once monopoles sectors by deepened reform of such sectors as telecommunications, civil aviation, power generation and supply. The reform and loss-reducing of enterprises in defense industry progressed smoothly. Reforms continued in the fields of government finance and taxation, banking, social security, and circulation systems for grain and cotton. Reform of the administrative procedures for examination and approval was pushed forward. Experiments in the reform of the tax and fee collection system in rural areas were gradually expanded and notable progress was made. Positive advancement was scored in the development of the western region, with accelerated progress in the construction of infrastructure and ecological environment. Agriculture production was reoriented towards regional concentration, quality improvement and industrialization. Adjustment of industrial structure was accelerated by expanding the share of industries with high or new technologies characterized by information technology. Innovation took place in domestic trade as is reflected by the rapid development of modern circulation and distribution systems.
Main problems that remained in economic performance included: the restraints on economic growth by insufficient effective demand and irrational supply structure, still high pressure for employment, problems in increasing farmers' income, the difficulties in the life of some urban and rural households, persistent market disorder, and occasional occurrence of serious accidents in production.
II. Agriculture
Structural adjustment for crop production was continued. To meet t changing market, the sown areas of grain was 103.99 million hectares, a decrease of 2.09 million hectares as compared with that in the previous year, and the sown areas of cotton was 4.18 million hectares, a decrease of 630,000 hectares. The sown areas of oil-bearing crops rose by 240,000 hectares to reach 14.87 million hectares, that of sugar crops increased by 150,000 hectares to reach 1.80 million hectares, and that for vegetables rose by 880,000 hectares to reach 17.28 million hectares.
The production of major farm crops increased, including grain, oil-bearing crops and sugar crops, the output of vegetables continued to grow with better variety and quality, while the production of cotton decreased due to significant reduction in the sowing acreage. The total output of grain in 2002 was 457.11 million tons, up by 1 percent over the previous year.
Steady progress was seen in animal husbandry and fishery. The total output of meat for the year reached 65.90 million tons, up by 4 percent. The total output of aquatic products was 45.13 million tons, up by 3 percent.
Table 2: Output of Major Farm Products
Item Output (10,000 tons) Increase over 2001 (%) Grain 45711 1.0 Summer crops 9877 -2.9 Early rice 3025 -11.0 Autumn crops 32809 3.5 Oil-bearing crops 2900 1.2 Peanuts 1495 3.7 Rapeseed 1053 -7.1 Cotton 492 -7.5 Sugar crops 10151 17.3 Sugarcane 8883 17.4 Beetroot 1268 16.4 Cured tobacco 213 3.9 Tea 74 5.7 Fruits 6809 2.3
Forestry and water conservancy made new progress. The total afforested area in 2002 was 7.47 million hectares, up by 51 percent. Of this total, the afforested area through “grain for green” projects was 5.4 million hectares. A total 3,576 kilometers of main embankment along the middle and lower reaches of Yangtze River and 982 kilometers of embankment along the lower reaches of the Yellow River were reinforced and came up to anti-flood standards. Over 900,000 hectares of land were converted into farmland with effective irrigation system, another 1.40 million hectares of land were guaranteed by water-saving irrigation system. Comprehensive land recovery program was applied to over 4 million hectares of once eroded areas.
III. Industry and Construction
Fast growth was registered in industrial production with improved linkage between production and sales. In 2002, the total value-added of the industrial sector was 4,593.5 billion yuan, up by 10.2 percent over the previous year. The value-added of industrial enterprises above designated size (i.e. all state-owned enterprises and those non-state-owned enterprises with an annual sales income over 5 million yuan) was 3,148.2 billion yuan, up by 12.6 percent. The sales ratio of industrial enterprises was 98 percent, or 0.3 percentage points higher than that in the previous year.
Table 3: Value-added of Industrial Sector
|
Item |
Value-added (100 million yuan) |
Increase over 2001 (%) |
|
Industrial enterprises above designated size |
31482 |
12.6 |
|
Of which: State-owned and state-controlled enterprises |
16638 |
11.7 |
|
Of which: Collective enterprises |
2769 |
8.6 |
|
Share-holding enterprises |
11570 |
14.4 |
|
Enterprises invested by foreigners or investors from |
8091 |
13.3 |
|
Of which: Light industry |
12294 |
12.1 |
|
Heavy industry |
19188 |
13.1 |
Adjustment of the structure of manufactured products made new progress. Fast growth was registered in the production of export-oriented products, high-tech products, and consumer products that suit the upgrading of consumption structure. The output value of new manufactured products increased by 24 percent over 2001, and the value of manufactured products shipped for export rose by 23.4 percent. The output of electronic and telecommunications products rose by over 25.9 percent, including PCs, mobile telephones, semi-conductor integrated circuits, color TV sets. The growth in the output of yarn, cloth, silk textiles and clothing ranged from 8.5 percent to 19.9 percent. The production of motor vehicles was up by 38.8 percent, with the production of cars rising by 55.2 percent. The output of steel and rolled steel went up by 19.7 percent and 19.6 percent respectively. Energy production in 2002 was encouraging, with 1,654 billion kilowatt-hours of electricity, up by 11.7 percent, 1.38 billion tons of coal, up by 18.9 percent, and 167 million tons of crude oil, up by 1.8 percent.
Table 4: Output of Major Industrial Products
Product Unit Output Increase over 2001 (%) Yarn 10000 tons 850 11.7 Cloth 100 million meters 322 11.2 Chemical fibers 10000 tons 991 17.8 Sugar 10000 tons 926 41.8 Cigarettes 10000 cases 3467 1.9 Color TV sets 10000 5155 25.9 Household refrigerators 10000 1599 18.3 Room air conditioners 10000 3135 34.3 Total energy production 100 million tons of standard coal equivalent 13.87 18.5 Coal 100 million tons 13.8 18.9 Crude oil 100 million tons 1.67 1.8 Electricity 100 million kilowatt-hours 16540 11.7 Steel 10000 tons 18155 19.7 Rolled steel 10000 tons 19218 19.6 Ten kinds of nonferrous metals 10000 tons 1012 14.5 Cement 100 million tons 7.25 9.7 Timber 10000 cubic meters 5035 10.6 Sulfuric acid 10000 tons 3050 13.3 Soda ash 10000 tons 1033 13.0 Ethylene 10000 tons 543 13.0 Chemical fertilizers (100 percent equivalent) 10000 tons 3791 12.1 Power-generating equipment 10000 kilowatts 2121 58.3 Motor vehicles 10000 325.1 38.8 Cars 10000 109.2 55.2 Large & median tractors 10000 4.5 18.9 Integrated circuits 100 million pieces 96.3 51.4 Program-controlled switchboards 10000 lines 5861 -38.5 Mobile telephones 10000 11960 48.9 Fax machines 10000 297 -6.6 Micro-computers 10000 1464 50.1 Optical telecommunications facilities 10000 sets 6.5 -16.6
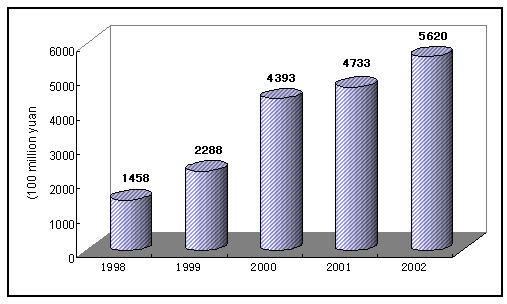
The profits of industrial enterprises maintained fast growth following the high increase over the past consecutive years. The total volume of profits reached 562 billion yuan during the year, up by 20.6 percent over 2001 on comparable basis. Of the total, the profits of state-owned and state-controlled enterprises stood at 263.6 billion, up by 15.3 percent.
Figure 2. Historical High of Profits by Industrial Enterprises Above Designated Size
Production and profits of construction enterprises continued to grow. In 2002, the value-added of construction enterprises in
IV. Investment in Fixed Assets
Investment in fixed assets kept fast growth. The completed investment in fixed assets of the country in 2002 was 4,320.2 billion yuan, exceeding 4 trillion yuan for the first time, up 16.1 percent over the previous year, representing the highest growth rate since 1996.
Figure 3: Continued Expansion of Investment in Fixed Assets
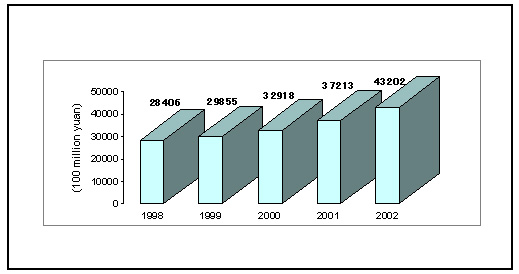
Table 5: Investment in Fixed Assets
|
Item |
Volume(100 million yuan) |
Increase over 2001(%) | ||
|
Investment in fixed assets |
43202 |
|
16.1 |
|
|
Of which:State-owned units and others |
31020 |
|
17.0 |
|
|
Collective units |
5901 |
|
11.8 |
|
|
Urban and rural individuals |
6280 |
|
15.7 |
|
|
Of which:Capital construction |
17251 |
|
16.4 |
|
|
Technical updating and transformation |
6584 |
|
11.1 |
|
|
Real estate development |
7736 |
|
21.9 |
|
Overall growth was seen in investment in eastern, central and western areas in
Investment structure was further improved. In 2002, the investment in the primary industry was 110.6 billion yuan, up by 23.5 percent over the previous year, representing the feature of recovery. Investment in the secondary industry was 1,070.3 billion yuan, up by 22.9 percent, showing the trend of accelerated growth. Investment in the tertiary industry kept fast growth, with a total completed investment of 2,113.2 billion yuan for the whole year, up by 14.4 percent.
Table 6: Newly Increased Production Capacity Through Investment in Capital Construction in the Past 5 Years
|
Item |
Unit |
1998 |
1999 |
2000 |
2001 |
2002 |
Total of 1998-2002 |
|
Power generating capacity of large and medium-sized generators |
10,000kw |
1839 |
1891 |
1934 |
1516 |
1165 |
8345 |
|
Power transformer equipment with a capacity of over 110,000 kilovolts |
10,000 kilovolt-amperes |
3836 |
3935 |
4285 |
5319 |
4722 |
22097 |
|
New trunk railways put into operation |
Kilometer |
1105 |
1242 |
655 |
1246 |
1696 |
5944 |
|
Double-track railways put into operation |
Kilometer |
590 |
1311 |
698 |
1504 |
500 |
4603 |
|
Electrified railways put into operation |
Kilometer |
988 |
616 |
554 |
2680 |
866 |
5704 |
|
Newly constructed highways |
Kilometer |
45677 |
41978 |
48069 |
35855 |
30796 |
202375 |
|
Of which: Express highways |
Kilometer |
1663 |
2639 |
4467 |
3149 |
5545 |
17463 |
|
Newly increased cargo-handling capacity of 10000-ton berths at harbors |
10,000 tons |
1277 |
2160 |
3633 |
5813 |
1547 |
14430 |
|
Newly installed capacity of telephone switchboards |
10,000 gates |
2554 |
1523 |
2480 |
4997 |
2792 |
14346 |
|
Newly increased length of optical-fiber cables |
10,000 km |
16 |
11 |
43 |
61 |
63 |
194 |
|
Newly increased capacity of digital cellular mobile phone switchboards |
10,000 |
1969 |
3426 |
6033 |
9097 |
5205 |
25730 |
The construction of key projects progressed smoothly, including the successful damming of the headrace and the completion of the principal part of the main dam on the left side of the Three Gorges Project;; the smooth progress of the construction of Qinghai-Tibet railway; the outspread of the southern channel of the West-East electricity transmission project with advancing in the central channel and speeding up of construction in the northern channel; and the start of the West-to-East natural gas transmission project and the South-to-North water diversion project. New headway was made in technical updating and transformation of enterprises, which played an important role in structural adjustment.
V. Domestic Trade
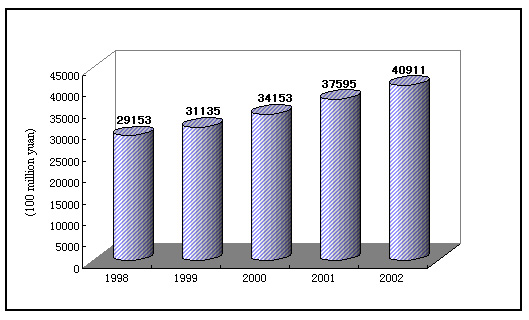
Sales of consumer goods at domestic market increased steadily. In 2002, the total retail sales of consumer goods topped 4 trillion yuan to reach 4,091.1 billion yuan, up 8.8 percent over the previous year. Of this total, the retail sales of consumer goods in urban areas reached 2,589.8 billion yuan, up 10 percent, and the retail sales of consumer goods at and below county level was 1,501.3 billion yuan, up 6.8 percent. In terms of different sectors, the sales of the wholesale and retail industry reached 2,786.0 billion yuan, up 9.2 percent, the sales of the catering industry was 509.2 billion yuan, up 16.6 percent, and the sales of other industries was 795.9 billion yuan, up 3.2 percent. The real growth of total retail sales of consumer goods was 10.2 percent if price factor was taken into consideration.
Telecommunications, motor vehicles and related products had shaped new hotspots in consumption, and the sales of household electric and electronic appliances were brisk. The total retail sales of telecommunication equipment by wholesale and retail enterprises above designated size was up by 69.2 percent over the previous year; that of motor vehicles was up by 73 percent; electric and electronic appliances for household use was up by 14.6 percent.
Figure 4: Steady Growth of Total Retail Sales of Consumer Goods
VI. Foreign Economic Relations
Rapid growth was registered in foreign trade. Total value of import and export in 2002 reached 620.8 billion US dollars, up 21.8 percent over the previous year. The value of export was 325.6 billion US dollars, up 22.3 percent, and the value of import was 295.2 billion US dollars, up 21.2 percent.
Table 7: Import and Export by Major Categories
Item Volume (100 million USD) Increase over 2001 (%) Total export 3256 22.3 Of which: General trade 1362 21.7 Processing trade 1799 22.0 Of which: Mechanical and electrical products 1571 32.3 High and new-tech products 679 46.1 Total import 2952 21.2 Of which: General trade 1291 13.8 Processing trade 1222 30.1 Of which: Mechanical and electrical products 1556 29.1 High and new-tech products 828 29.2
Growth of different degrees was seen in exports to major trade partners. In 2002, China’s export to the United States was 70.0 billion US dollars, up 28.9 percent over the previous year; to Hong Kong SAR, 58.5 billion US dollars, up 25.6 percent; to Japan 48.4 billion US dollars, up 7.8 percent; to European Union countries 48.2 billion US dollars, up 17.9 percent; to ASEAN countries 23.6 billion US dollars, up 28.3 percent; to the Republic of Korea 15.5 billion US dollars, up 23.8 percent; to Taiwan Province 6.6 billion US dollars, up 31.7 percent; and to Russian 3.5 billion US dollars, up 29.9 percent.
Figure 5: Notable Increase in Imports and Exports

Foreign direct investment increased steadily. In 2002, the contracted foreign capitals through foreign direct investment stood at 82.8 billion US dollars, up 19.6 percent, and the foreign capitals actually utilized were 52.7 billion US dollars, up 12.5 percent.
Foreign economic and technical cooperation maintained good momentum. In 2002, the accomplished business revenue through contracted projects and labor contracts was 14.4 billion US dollars, up 18.2 percent. The value involved in the new contracts signed was 17.9 billion US dollars, up 8.7 percent.
VII. Transportation, Post, Telecommunications and Tourism
Continued steady growth was scored in transportation, posts and telecommunications. In 2002, the value-added of the sector reached 551.8 billion yuan, up 7.7 percent over the previous year.
Table 8: Traffic Volume Completed by Various Transportation Means
|
Item |
Unit |
Volume |
Increase over 2001 (%) |
|
Freight traffic |
100 million ton-km |
49387 |
3.8 |
|
Of which: Railways |
100 million ton-km |
15477 |
6.2 |
|
Highways |
100 million ton-km |
6704 |
5.9 |
|
Waterways |
100 million ton-km |
26481 |
1.9 |
|
Civil aviation |
100 million ton-km |
51.5 |
17.9 |
|
Passenger traffic |
100 million person-km |
13966 |
6.2 |
|
Of Which: Railways |
100 million person-km |
4969 |
4.2 |
|
Highways |
100 million person-km |
7643 |
6.0 |
|
Waterways |
100 million person-km |
85 |
-5.6 |
|
Civil aviation |
100 million person-km |
1269 |
16.2 |
|
Volume of cargo handled at coastal ports |
100 million tons |
26.8 |
11.6 |
|
Of which: Cargo for foreign trade |
100 million tons |
7.6 |
17.0 |
The business transactions of postal and telecommunication services in 2002 totaled 554.7 billion yuan, up 21.7 percent over the previous year. Of this total, that of postal services stood at 49.5 billion yuan, up 8.2 percent; that of telecommunication services was 505.2 billion yuan, up 23.2 percent. By the end of 2002, the total capacity of office exchanges reached 283.58 million gates, including 27.92 million gates of newly increased capacity during the year. Fixed telephone subscribers reached 214.42 million with 34.05 million new subscribers. Of this total, 135.95 million were urban subscribers and 78.47 million were rural subscribers. By the end of 2002, the total telephone subscribers and mobile telephone users numbered 421.04 million in
Figure 6: Rapid Growth of Telephone Subscribers (Year-end Figures)

Tourism developed continuously. The year 2002 saw 877.82 million domestic tourists, up 12 percent over the previous year. Income from domestic tourism stood at 387.8 billion yuan, up 10.1 percent. In 2002,
VIII. Banking, Security and Insurance
Money supply registered rapid increase. By the end of 2002, the money supply of broad sense (M2) was 18,500.7 billion yuan, up 16.8 percent over the previous year, and that of narrow sense (M1) was 7,088.2 billion yuan, up 16.8 percent. The cash in circulation (M0) amounted to 1,727.8 billion yuan, up 10.1 percent.
Savings deposits and loans of financial institutions increased by a large margin. The savings deposit in Renminbi and foreign exchange in all financial institutions at the end of 2002 totaled 18,338.8 billion yuan, up 18.1 percent. The loans in Renminbi and foreign exchanges in various forms in all financial institutions reached 13,980.3 billion yuan, up 15.4 percent on comparable basis. The structure of loans continued to improve. The loans by rural credit cooperatives stood at 1,394.0 billion yuan, an increase of 195.3 billion yuan. The consumption loans totalled 1,066.9 billion yuan, an increase of 369.4 billion yuan, of which, the loans for individual housing were 825.8 billion yuan, an increase of 267.1 billion yuan.
Table 9: Savings Deposits and Loans in Renminbi and Foreign Currencies of All Financial Institutions
|
Item |
Year-end figure (100 million yuan) |
Increase over 2001 (%) | ||
|
Savings deposits |
183388 |
|
18.1 |
|
|
Of which: By enterprises |
64299 |
|
15.3 |
|
|
By urban and rural residents |
94307 |
|
17.1 |
|
|
Of which: Deposits in Renminbi |
86911 |
|
17.8 |
|
|
Loans |
139803 |
|
15.4 |
|
|
Of which: Short-term |
76822 |
|
9.9 |
|
|
Medium and long-term |
51732 |
|
23.2 |
|
Figure 7: Significant Increase of Savings Deposits in RMB by Urban and Rural Residents

In 2002, funds raised through issuing stocks and share rights at
In 2002, the insurance premium of domestic and foreign insurance companies totaled 305.3 billion yuan, up 44.3 percent over the previous year. Of this total, the premium of life insurance was 195.7 billion yuan, that of health and unforeseen accident insurance was 31.8 billion yuan, and that of property insurance was 77.8 billion yuan. The insurance companies paid an indemnity of 70.7 billion yuan as reparations in insurance programs, of which the indemnity of life insurance was 22.5 billion yuan, and that of health insurance was 5.0 billion yuan. Another 43.2 billion yuan was paid as reparations in property and unforeseen accident insurance programs.
IX. Education, Science and Technology
Education of all levels and forms made further development. There were 9.03 million enrolled undergraduates in general universities, including 3.21 million new entrants. Institutions of adult higher education had 5.59 million enrolled students, including 2.22 million new entrants. There were 500,000 enrolled postgraduates in universities or research institutes, including 200,000 new entrants. There were 16.84 million students in general senior secondary schools including 6.67 million new entrants, and 11.97 million students in secondary vocational or technical schools of various types, including 4.70 million new entrants. Students enrolled in junior secondary schools totaled 66.87 million, including 22.81 million new entrants, and 19.04 million were graduated. Pupils enrolled in primary schools numbered 121.57 million, including 19.53 new entrants, and 23.52 were graduated. There were 371,000 students in special education schools, with 53,000 new entrants. Kindergartens accommodated 20.36 million kids.
Table 10: New Entrants and Graduates in Five Years
Unit: 10,000 persons Item 1998 1999 2000 2001 2002 Total of 1998-2002 Entrants Postgraduates 7.3 9.2 12.8 16.5 20.3 66.1 General Universities 108 160 221 268 321 1078 Adult Education 100 116 156 196 222 790 Secondary Vocational Schools 520 473 411 400 470 2274 General Senior Secondary Schools 360 396 473 558 677 2464 Graduates Postgraduates 4.7 5.5 5.9 6.8 8.1 31.0 General Universities 83 85 95 104 134 501 Adult Education 83 89 88 93 118 471 General Senior Secondary Schools 252 263 302 341 384 1542
Significant progress was made in R&D activities and in their industrialization. In 2002, the expenditure on R&D for the whole country was 116.1 billion yuan, up 11.3 percent over 2001, accounting for 1.1% of the GDP. Of this total, 7.4 billion yuan was used for basic researches.
Comprehensive technical services further improved. There were altogether 5,500 institutions in
Some 156 new mineral deposits of large or medium scale were discovered through national land resources surveys and geological surveys. Increased reserves were found for 43 minerals, including 1,050 million tons of crude oil, 441.1 billion cubic meters of natural gas and 760 million tons of coal. There were 31 provincial geological environmental monitoring stations, which made successful forecasts on 703 geological disasters.
X. Culture, Public Health and Sports
Fairly fast development continued in cultural and art undertakings, in broadcasting, movie and television programs and in news and publishing undertakings. At the end of year, there were 2,592 art-performing groups, 2,847 culture centers, 2,689 public libraries and 1,451 museums in
Table 11: Radio Broadcasting, Television and Publications in Five Years
|
|
Unit |
1998 |
1999 |
2000 |
2001 |
2002 |
|
Radio coverage |
% |
88.3 |
90.5 |
92.5 |
92.9 |
93.2 |
|
TV coverage |
% |
89.0 |
92.0 |
93.7 |
94.2 |
94.5 |
|
Magazines |
100 million |
25.4 |
28.5 |
29.4 |
28.9 |
29.6 |
|
Books |
100 million |
72.4 |
73.2 |
62.7 |
63.1 |
67.5 |
Stable progress was made in public health undertakings. At the end of the year, there were 290,000 health care institutions in China, including 65,000 hospitals and health care stations, with a total of 3.21 million beds, 2.20 million of which in hospitals and health care stations; and 4.44 million health workers, including 2.11 million doctors and 1.30 million senior and junior nurses.
Vigorous development was scored in sports. In 2002, Chinese athletes won 110 world championships at domestic and international sports games. Seventeen athletes and 5 teams broke 29 world records on 33 occasions, 14 athletes and 11 teams broke 24 Asian records on 25 occasions. At the 14th Asian Games,
XI. Environment Protection
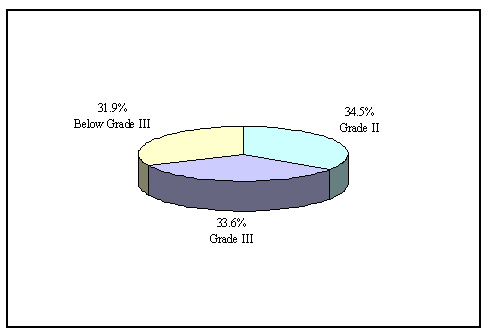
The air quality in the urban areas picked up gradually. Among the 339 cities under the environment monitoring program, the air quality of 117 cities met Grade II, accounting for 34.5 percent of all, up by 1.1 percentage points over the pervious year; 114 cities met Grade III, accounting for 33.6 percent, equal to the previous year; and the rest 108 cities failed to meet Grade III, accounting for 31.9 percent, or down by 1.3 percentage points. Among 322 cities that were under road noise monitoring program, 5 percent had serious noise pollution; as for the 315 cities that were under area noise monitoring program, 52.1 percent of the cities had less noise pollution than the set standard for urban living areas. There were 3,369 smoke/dust control zones established, covering an area of 23,000 square kilometers; and there were another 3,128 zones covering 15,000 square kilometers, where the noise pollution was controlled within the standard.
Figure 8: Air Quality in Monitored Cities
The quality of the ground water made some improvement. In the mainstreams of the seven main river systems, 52.9 percent of the measured sections met National Grade III, up by 1.2 percentage points over the previous year; 19.0 percent met Grade IV, down by 7.1 percentage points; 7.8 percent met Grade V, down by 5 percentage points; and 20.3 percent failed to meet Grade V, up by 10.9 percentage points. The water quality of the offshore marine areas tended to improve. Out of the 381 offshore monitoring points, 21.3 percent of the points reported that the marine water quality reached National Grade I, up by 7.9 percentage points, 28.3 percent reached Grade II; 14.4 percent reached Grade III; 8.9 reached Grade IV, and the remaining 27.1 percent exceeded Grade IV.
The protection of the ecological system was further enhanced. There were 82 national ecological demonstration zones involving 314 pilot areas or units.
XII. Population, People’s Life and Social Securities
The natural growth rate of population continued to decline. At the end of 2002, the total population of
Table 12: Composition of Population
|
|
Population at end of year (10,000) |
Percentage | |||
|
National Total |
12,845.3 |
|
100.0 |
| |
|
Of which: |
Urban |
5,021.2 |
|
39.1 |
|
|
|
Rural |
7,824.1 |
|
60.9 |
|
|
Of which: |
Male |
6,611.5 |
|
51.5 |
|
|
|
Female |
6,233.8 |
|
48.5 |
|
|
Of which: |
0-14 years |
2,877.4 |
|
22.4 |
|
|
|
15-64 years |
9,030.2 |
|
70.3 |
|
|
|
65 years and over |
937.7 |
|
7.3 |
|
The living standard of urban and rural population continued to improve. The annual per capita disposable income of urban households was 7,703 yuan in 2002, a real increase of 13.4 percent with decline in prices taken into consideration. The per capita net income of rural households was 2,476 yuan, a real increase of 4.8 percent. The Engel coefficients (referring to the proportion of expenditures on food to the total consumption expenditures of households) were 37.7 percent for the urban households and 46.2 percent for the rural households, down by 0.2 percentage points and 1.5 percentage points respectively over the previous year. The population in poverty in the rural areas was 28.20 million at the end of 2002, 1.07 million less than 2001.
Table 13: Improvement in People’s Life in Five Years
|
|
Unit |
1998 |
1999 |
2000 |
2001 |
2002 |
|
Per capita disposable income of urban population |
Yuan |
5425 |
5854 |
6280 |
6860 |
7703 |
|
Per capita net income of rural population |
Yuan |
2162 |
2210 |
2253 |
2366 |
2476 |
|
Engel coefficient of urban households |
% |
44.5 |
41.9 |
39.2 |
37.9 |
37.7 |
|
Engel coefficient of rural households |
% |
53.4 |
52.6 |
49.1 |
47.7 |
46.2 |
The social security system was further consolidated. By the end of 2002, 147.31 million people participated in basic pension programs, including 111.28 million staff and workers and 36.03 million retirees. Some 14.34 million retirees received their pension through socialized network. A total of 101.82 million people participated in unemployment insurance programs while 4.4 million received payment from the programs, 1.27 million more than the previous year. The basic health insurance programs involved 94 million people, 17.7 million more than 2001. A national total of 20.54 million urban residents received the minimum income relief from the government.
The social welfare work continued to develop. There were 1.19 million beds in social welfare institutions of various types, accommodating for 890,000 inmates. Some 190,000 service facilities in the communities were established in urban areas, including 8,820 community service centers. In 2002,
Notes:
1) All figures in the Communiqué are preliminary statistics.
2) Statistics in the Communiqué do not include figures for Hong Kong SAR, Macao SAR and
3) Figures in value terms on gross domestic product and value-added quoted in the Communiqué are at current prices, whereas growth rates are calculated at comparable prices.
4) Newly increased production capacity figures with regard to the telephone switchboards, length of optical-fiber cables and digital cellular mobile phone switchboards include the capacity built through technical updating and transformation projects.
5) The value of business transactions of postal and telecommunication services was calculated at the constant prices of 2000.