Consumer Price Index for December 2023
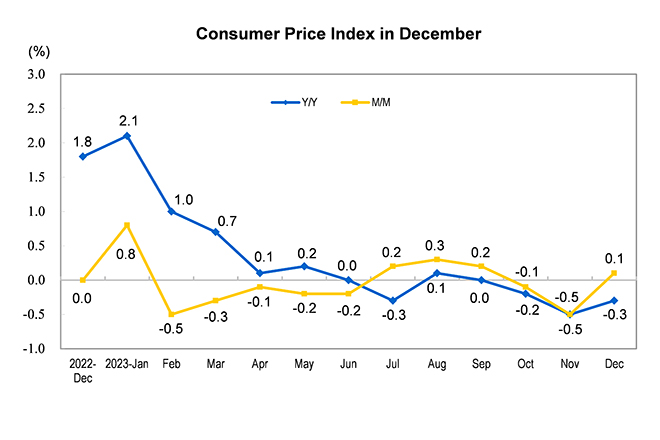
In December 2023, the national consumer price index (CPI) decreased by 0.3 percent year on year. Among them, the price in urban areas decreased by 0.3 percent and the price in rural areas decreased by 0.5 percent; the price for food decreased by 3.7 percent, while for nonfood increased by 0.5 percent; prices for consumer goods decreased by 1.1 percent and for services increased by 1.0 percent.
In December, the national consumer price index increased by 0.1 percent month on month. Among them, the price in urban areas increased by 0.1 percent and the price in rural areas increased by 0.1 percent; the price for food increased by 0.9 percent, while for nonfood decreased by 0.1 percent; prices for consumer goods increased by 0.1 percent and for services increased by 0.1 percent.
The national consumer price Index (CPI) of 2023 increased by 0.2 percent from the previous year.
I. Year-on-Year Changes of Prices for Different Categories
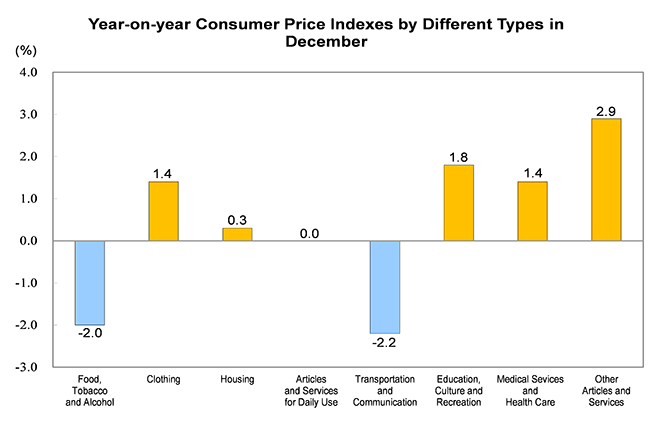
In December, prices for food, tobacco and alcohol decreased by 2.0 percent year on year, affecting the CPI decreased by about 0.57 percentage point. Among food categories, the price for livestock meat decreased by 15.9 percent, affecting the CPI decreased by about 0.56 percentage point, of which the price for pork decreased by 26.1 percent, affecting the CPI decreased by about 0.43 percentage point; the price for egg decreased by 7.0 percent, affecting the CPI decreased by about 0.05 percentage point; prices for aquatic products decreased by 0.6 percent, affecting the CPI decreased by about 0.01 percentage point; the price for fresh fruit decreased by 0.3 percent, affecting the CPI decreased by about 0.01 percentage point; the price for fresh vegetable increased by 0.5 percent, affecting the CPI increased by about 0.01 percentage point; the price for grain increased by 0.4 percent, affecting the CPI increased by about 0.01 percentage point.
Prices for other seven major categories increased five, leveled one and decreased one year on year. Among them, prices for other articles and services, education, culture and recreation, and clothing increased by 2.9, 1.8 and 1.4 percent respectively; prices for medical services and health care and housing increased by 1.4 and 0.3 percent respectively; prices for articles and services for daily use maintained the same; the price for transportation and communication decreased by 2.2 percent.
II. Month-on-Month Changes of Prices for Different Categories
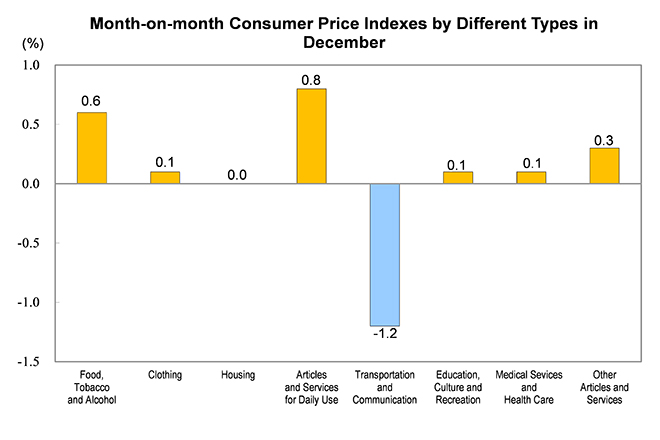
In December, prices for food, tobacco and alcohol increased by 0.6 percent month on month, affecting the CPI increased by about 0.18 percentage point. Among food categories, the price for fresh vegetable increased by 6.9 percent, affecting the CPI increased by about 0.14 percentage point; the price for fresh fruit increased by 1.7 percent, affecting the CPI increased by about 0.03 percentage point; prices for aquatic products increased by 0.9 percent, affecting the CPI increased by about 0.02 percentage point; the price for livestock meat decreased by 0.6 percent, affecting the CPI decreased by about 0.02 percentage point, of which the price for pork decreased by 1.0 percent, affecting the CPI decreased by about 0.01 percentage point;
Prices for other seven major categories increased five, leveled one and decreased one month on month. Among them, prices for articles and services for daily use and other articles and services increased by 0.8 and 0.3 percent respectively; prices for clothing, education, culture and recreation, and medical services and health care all increased by 0.1 percent; the price for housing maintained the same; the price for transportation and communication decreased by 1.2 percent.
Consumer Price Index in December 2023
Annotations:
1. Explanatory Notes
Consumer Price Index (CPI) is an index measuring changes over time in the price level of consumer goods and services purchased by residents, which comprehensively reflects the changes of price level.
2. Statistical Coverage
Consumer Price Index (CPI) covers the prices of goods and services of 8 categories and 268 basic divisions which cover the living consumption of urban and rural residents, including food, tobacco and alcohol; clothing; housing; articles and services for daily use; transportation and communication; education, culture and recreation; medical services and health care; other articles and services.
3. Survey Methods
Sampling survey methodology is adopted to select and determine survey sites, and according to the principle of "fixed person, fixed point and fixed time", people are directly sent to the survey sites or collect the original price from the Internet. The data comes from about 500 cities and counties in 31 provinces (autonomous regions and municipalities) and nearly 100,000 price survey points, including shopping malls (stores), supermarkets, farmers' markets, service outlets and internet e-commerce.
4. Data Description
Due to "rounding-off", the aggregate data may be equal to the high or low value of the classified data.