Producer Price Index in the Industrial Sector for October 2023
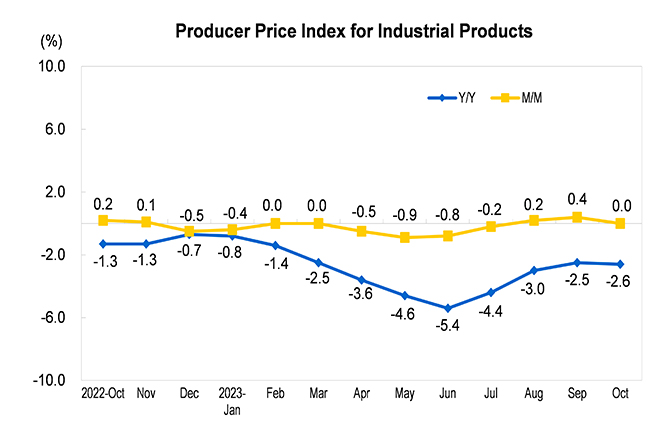
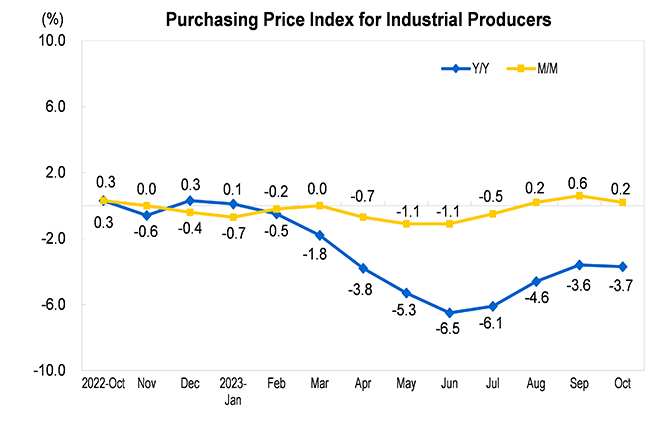
In October 2023, the producer prices for industrial products decreased by 2.6 percent year on year and were flat month on month; the purchasing prices for industrial producers decreased by 3.7 percent year on year and rose by 0.2 percent month on month. From January to October, on average, the producer prices for industrial products decreased by 3.1 percent over the same period last year, and the purchasing prices for industrial producers decreased by 3.6 percent.
1. Year-on-Year Changes of Prices for Different Categories in October
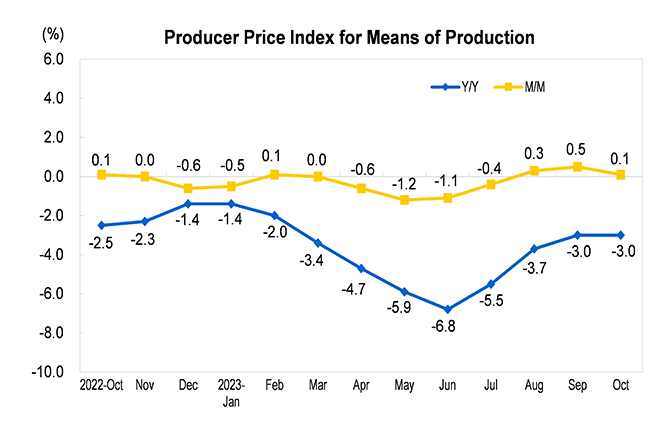
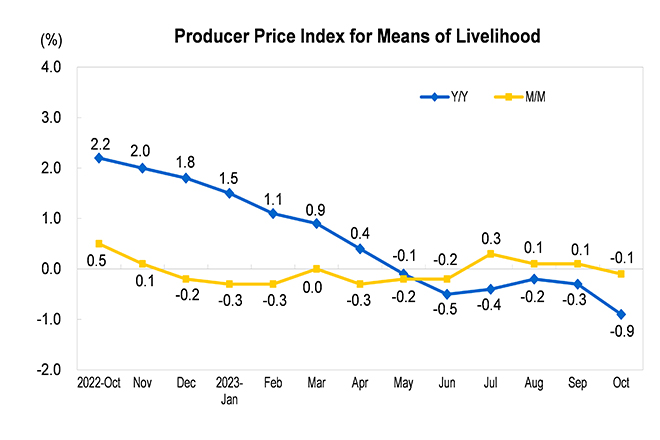
Among the producer prices for industrial products, the price for means of production decreased by 3.0 percent, affecting the overall level of the producer prices for industrial products decreased by about 2.35 percentage points. Among them, the price for the mining industry went down by 6.2 percent, that for the raw material industry down by 2.3 percent, and that for the processing industry down by 3.0 percent. The price for means of livelihood decreased by 0.9 percent, affecting the overall level of the producer prices for industrial products decreased by about 0.24 percentage point. Among them, the price for food went down by 1.2 percent, prices for both clothing and general commodities went up by 0.4 percent and the price for durable consumer goods went down by 2.0 percent.
Among the purchasing prices for industrial producers, prices for building materials and non-metallic went down by 7.3 percent, that for fuel and power down by 6.7 percent, that for raw chemical materials down by 6.3 percent, that for agricultural and sideline products down by 6.2 percent and that for ferrous metal materials down by 2.1 percent; prices for non-ferrous metal materials and wires went up by 3.7 percent.
2. Month-on-Month Changes of Prices for Different Categories in October
Among the producer prices for industrial products, the price for means of production increased by 0.1 percent, affecting the overall level of the producer prices for industrial products increased by about 0.08 percentage point. Among them, the price for the mining industry went up by 2.4 percent, that for the raw material industry up by 0.4 percent, and that for the processing industry down by 0.2 percent. The price for means of livelihood decreased by 0.1 percent, affecting the overall level of the producer prices for industrial products decreased by about 0.04 percentage point. Among them, the price for food went down by 0.3 percent, that for clothing up by 0.1 percent; prices for general commodities were flat, and that for durable consumer goods down by 0.1 percent.
Among the purchasing prices for industrial producers, prices for fuel and power went up by 1.4 percent, that for raw chemical materials up by 1.0 percent, that for ferrous metal materials up by 0.2 percent; prices for agricultural and sideline products went down by 0.7 percent, that for non-ferrous metal materials and wires and building materials and non-metallic both down by 0.3 percent.
Producer Prices for Industrial Products in October 2023
|
M/M (%) |
Y/Y (%) |
Jan-Oct Y/Y (%) |
|
|
I. Producer Prices for Industrial Products |
0.0 |
-2.6 |
-3.1 |
|
Means of production |
0.1 |
-3.0 |
-4.0 |
|
Mining |
2.4 |
-6.2 |
-7.8 |
|
Raw materials |
0.4 |
-2.3 |
-4.7 |
|
Processing |
-0.2 |
-3.0 |
-3.3 |
|
Means of livelihood |
-0.1 |
-0.9 |
0.1 |
|
Food |
-0.3 |
-1.2 |
0.5 |
|
Clothing |
0.1 |
0.4 |
1.3 |
|
General commodity |
0.0 |
0.4 |
0.6 |
|
Durable consumer goods |
-0.1 |
-2.0 |
-0.9 |
|
II. Purchasing Prices for Industrial Producers |
0.2 |
-3.7 |
-3.6 |
|
Fuel and power |
1.4 |
-6.7 |
-4.9 |
|
Ferrous metal materials |
0.2 |
-2.1 |
-7.3 |
|
Non-ferrous metal materials and wires |
-0.3 |
3.7 |
-1.3 |
|
Raw chemical materials |
1.0 |
-6.3 |
-8.8 |
|
Wood and pulp |
0.4 |
-7.1 |
-2.4 |
|
Building materials and non-metallic |
-0.3 |
-7.3 |
-5.5 |
|
Other industrial raw materials and semi-products |
-0.1 |
-2.0 |
-1.3 |
|
Agricultural and sideline products |
-0.7 |
-6.2 |
-1.1 |
|
Raw textile materials |
0.1 |
-0.7 |
-3.5 |
|
III. Producer Prices for Major Industries |
|||
|
Mining and washing of coal |
3.4 |
-15.4 |
-11.0 |
|
Extraction of petroleum and natural gas |
2.8 |
1.7 |
-11.6 |
|
Mining of ferrous metal ores |
1.6 |
10.1 |
-5.1 |
|
Mining of non-ferrous metal ores |
0.6 |
9.1 |
5.7 |
|
Mining and processing of nonmetal ores |
0.7 |
-1.9 |
0.7 |
|
Processing of food from agricultural and sideline products |
-0.4 |
-3.5 |
0.2 |
|
Manufacture of foods |
0.0 |
-1.1 |
-0.5 |
|
Manufacture of wines, beverages and refined tea |
-0.3 |
0.9 |
1.2 |
|
Manufacture of cigarettes and tobacco |
0.0 |
1.3 |
0.8 |
|
Textile industry |
0.0 |
-1.9 |
-3.6 |
|
Manufacture of textile wearing apparel and ornament |
0.0 |
0.4 |
0.9 |
|
Processing of timbers, manufacture of wood, bamboo, rattan, palm, and straw products |
0.0 |
-1.8 |
-1.3 |
|
Manufacture of paper and paper products |
1.1 |
-6.2 |
-5.2 |
|
Printing, reproduction of recording media |
-0.2 |
-0.7 |
-0.5 |
|
Processing of petroleum, coal and other fuels |
2.5 |
-3.8 |
-8.8 |
|
Manufacture of raw chemical materials and chemical products |
0.7 |
-6.9 |
-9.5 |
|
Manufacture of medicine |
0.1 |
0.8 |
0.3 |
|
Manufacture of chemical fibers |
0.1 |
-1.0 |
-3.4 |
|
Manufacture of rubber and plastics articles |
0.1 |
-3.4 |
-3.5 |
|
Manufacture of non-metallic mineral products |
-0.1 |
-7.6 |
-6.4 |
|
Smelting and pressing of ferrous metals |
-0.6 |
-5.2 |
-10.9 |
|
Smelting and pressing of non-ferrous metals |
-0.2 |
2.6 |
-3.8 |
|
Manufacture of metal products |
-0.1 |
-2.4 |
-3.3 |
|
Manufacture of general-purpose machinery |
-0.1 |
-0.5 |
-0.3 |
|
Manufacture of automobiles |
-0.1 |
-1.4 |
-1.1 |
|
Manufacture of railway, ship, aerospace and other transport equipment |
0.1 |
0.0 |
0.4 |
|
Manufacture of computers, communication equipment and other electronic equipment |
-0.3 |
-2.9 |
-1.3 |
|
Production and supply of electricity and thermal power |
-0.7 |
0.2 |
1.7 |
|
Production and supply of gas |
0.3 |
-1.3 |
1.6 |
|
Production and supply of water |
0.3 |
0.8 |
0.4 |
Annotations:
1. Explanatory Notes
Producer price index for industrial products consists of the producer prices for industrial products and the purchasing prices for industrial producers.
The producer prices for industrial products reflects the trend and range of price changes when the products are sold for the first time.
The purchasing prices for industrial producers reflects the trend and range of price changes for the products purchased by the industrial enterprises as intermediate inputs.
2. Statistical Coverage
The survey of producer prices for industrial products covers the prices of industrial products in 40 major industrial categories and more than 1300 basic categories; the survey of purchasing prices for industrial producers covers the prices of industrial products in 9 major categories and more than 800 basic categories.
3. Survey Methods
The survey of producer prices for industrial products adopts the method that combines key-point survey with typical survey, involving more than 40,000 industrial enterprises in China.
4. Statistical Standard
Industrial Classification is based on the “Industrial Classification for National Economic Activities” (GB/T4754-2017).
5. Data Description
Due to "rounding-off", the aggregate data may be equal to the high or low value of the classified data. The price changes of some categories or industries are little and are considered to maintain the same in the presentation of price changes, as their growth rate is zero after retaining one decimal place according to the "rounding-off" principle.