Investment in Fixed Assets from January to December 2019
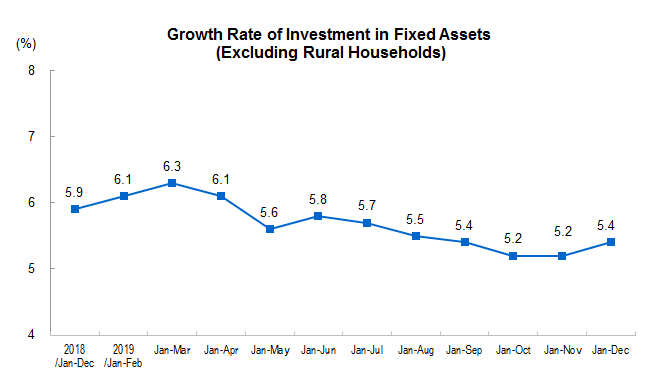
From January to December 2019, the national fixed asset investment (excluding rural households) was 55,147.8 billion yuan, an increase of 5.4 percent over the previous year, and the growth rate was 0.2 percentage point faster than that from January to November. In terms of month on month, fixed asset investment (excluding rural households) increased by 0.44 percent in December. Among them, the private fixed asset investment was 31,115.9 billion yuan, an increase of 4.7 percent over the previous year, and the growth rate was 0.2 percentage point higher than that from January to November.
In term of different industries, the investment in the primary industry was 1,263.3 billion yuan, up 0.6 percent over the previous year, and down 0.1 percent from January to November; the investment in the secondary industry was 16,307 billion yuan, up 3.2 percent, and 0.8 percentage point faster; the investment in the tertiary industry was 37,577.5 billion yuan, up 6.5 percent, and 0.2 percentage point lower.
In the secondary industry, industrial investment increased by 4.3 percent over the previous year, and the growth rate was 0.6 percentage point higher than that from January to November. Among them, the investment in mining industry increased by 24.1 percent, with the growth rate falling by 1.2 percentage points; the investment in manufacturing industry increased by 3.1 percent, with the growth rate accelerating by 0.6 percentage point; the investment in production and supply of power, heat, gas and water industry increased by 4.5 percent, with the growth rate accelerating by 0.9 percentage point.
In the tertiary industry, infrastructure investment (excluding power, heat, gas and water production and supply industries) increased by 3.8 percent over the previous year, and the growth rate fell by 0.2 percentage point from January to November. Among them, the investment in railway transportation industry decreased by 0.1 percent, with an increase of 1.6 percent from January to November; the investment in road transportation industry increased by 9.0 percent, with an increase of 0.2 percentage points; the investment in water conservancy management industry increased by 1.4 percent, with a decrease of 0.3 percentage point; the investment in public facilities management industry increased by 0.3 percent, with an increase of 0.1 percentage point.
In term of different areas, the investment in the eastern region increased by 4.1 percent compared with the previous year, the growth rate was the same as that from January to November; investment in the central region increased by 9.5 percent, the growth rate accelerated by 0.2 percentage point; investment in the western region increased by 5.6 percent, the growth rate accelerated by 0.7 percentage point; investment in the northeast region decreased by 3.0 percent, the decline narrowed by 0.7 percentage point.
In term of types of registration, the investment in fixed assets of domestic funded enterprises increased by 5.5 percent over the previous year, 0.1 percentage point faster than that from January to November; the investment in fixed assets of Hong Kong, Macao and Taiwan funded enterprises increased by 7.5 percent, 5 percentage points faster; the investment in fixed assets of foreign-funded enterprises decreased by 0.7 percent, and 0.1 percentage point larger.
| Investment in Fixed Assets from January to December 2019
|
| |
| Indicators | Jan-Dec |
|
| Increase rate Y/Y (%) |
| |
|
| ||
| Investment in Fixed Assets (Exclude Rural Households) (100 million yuan) | 5.4 |
|
| Of which: State-owned and State Holding | 6.8 |
|
| Of which: Private Investment | 4.7 |
|
| Grouped by Constitution |
|
|
| Construction and Installation | 5.4 |
|
| Purchase of Equipment and Instruments | -0.9 |
|
| Other Expenses | 10.6 |
|
| Grouped by Types of Industry |
|
|
| Primary Industry | 0.6 |
|
| Secondary Industry | 3.2 |
|
| Tertiary Industry | 6.5 |
|
| Grouped by Industrial Sectors |
|
|
| Agriculture, Forestry, Animal Husbandry and Fishery | 0.7 |
|
| Mining | 24.1 |
|
| Manufacturing | 3.1 |
|
| Of which: Processing of Food from Agricultural Products | -8.7 |
|
| Manufacture of Foods | -3.7 |
|
| Manufacture of Textile | -8.9 |
|
| Manufacture of Chemical Raw Material and Chemical Products | 4.2 |
|
| Manufacture of Medicines | 8.4 |
|
| Smelting and Pressing of Non-Ferrous Metal | 1.2 |
|
| Manufacture of Fabricated Metal Products | -3.9 |
|
| Manufacture of General Purpose Machinery | 2.2 |
|
| Manufacture of Special Purpose Machinery | 9.7 |
|
| Manufacture of Automobile | -1.5 |
|
| Manufacture of Railways, Shipbuilding, Aerospace and Other Transportation Equipment | -2.5 |
|
| Manufacture of Electrical Machinery & Equipment | -7.5 |
|
| Manufacture of Telecommunications Equipment, Computers and Other Electronic Equipment | 16.8 |
|
| Production and Supply of Electricity ,Gas and Water | 4.5 |
|
| Transport, Storage and Post | 3.4 |
|
| Of which: Railway Transportation | -0.1 |
|
| Road Transportation | 9.0 |
|
| Management of Water Conservancy, Environment and Public Facilities | 2.9 |
|
| Of which: Management on Water Resource | 1.4 |
|
| Management on Public Facilities | 0.3 |
|
| Education | 17.7 |
|
| Health, Social Works | 5.3 |
|
| Culture, Sports and Entertainment | 13.9 |
|
| Grouped by Registration Type |
|
|
| Domestic Funded | 5.5 |
|
| Funds from Hong Kong, Macao and Taiwan | 7.5 |
|
| Foreign Investment | -0.7 |
|
|
| ||
| Note: The growth rate in this table are all nominal growth rate without deducting the price factor. |
|
|
Annotations:
1. Explanatory Notes on Indicators
Investment in fixed assets (excluding rural households): refers to the total workload on construction and purchase for fixed assets during a certain period in the form of currency, as well as the concerning expenses.
Stat-holding Enterprises: including absolutely state-holding enterprises, relatively state-holding enterprises and consultatively state-holding enterprises. Absolutely state-holding enterprises refer to those enterprises that the proportion of state investment capital to the total actual capital (or capital stock) is larger than 50 percent.
Relatively state-holding enterprises refer to those enterprises that the proportion of state investment capital to the total actual capital (or capital stock) is less than 50 percent, but larger than any other single share holders. Consultatively state-holding enterprises refer to those enterprises that the proportion of state investment capital to the total actual capital (or capital stock) is less than other share holders, but owning the real control power regulated by agreement.
The enterprises which the proportion of investment capital of the two investors is 50 percent, and the share holding control power is not clearly stated by either side, if one of them is state-owned, are all classified as the state-holding enterprises without exception.
The investment projects invested by the administrative and institutional units are all classified as state-holding.
Types of Registration: the types of registration on the enterprises are based on the Provisions for the Classification of Types of Enterprise Registration jointly issued by NBS and State Administration of Industry and Commerce. And that on the individual operation is based on Note on the Code & Classification of Types of Individual Operation Registration.
According to the provision of statistical reporting system, all grassroots units shall fill in registration types. The registration types shall be filled in by the enterprises or individual operation units engaged in investment in fixed assets. Those who have already registered in the industrial and commercial administrative units, shall fill in based on the registration types, if unregistered, shall be filled in based on the registration types of investors or that on the provisions of related papers.
Domestic enterprise includes state-owned enterprise, collective enterprise, joint enterprise, limited liability enterprise, share-holding enterprise, private enterprise and others.
Enterprises with funds from Hong Kong, Macao and Taiwan includes joint-venture and cooperation by Hong Kong, Macao and Taiwan, Hong Kong, Macao and Taiwan Sole Investment, Hong Kong, Macao and Taiwan Funded Share-holding Corporations Ltd., and other investment enterprises by Hong Kong, Macao and Taiwan.
Foreign investment enterprise includes joint-venture and cooperation enterprises, foreign funded enterprise, foreign funded share-holding corporations Ltd., and other foreign investment enterprises.
2. Statistical Coverage
Refers to construction projects on fixed assets and real estates involving a total planned investment of 5 million yuan and over.
3. Data Collection
The report of investment on fixed assets is collected monthly with complete enumeration (no report in January).
4. Classification on East, Central and West Region
Eastern region: including Beijing, Tianjin, Hebei, Shanghai, Jiangsu, Zhejiang, Fujian, Shandong, Guangdong and Hainan. Central region: including Shanxi, Anhui, Jiangxi, Henan, Hubei and Hunan. Western region: including Inner Mongolia, Guangxi, Chongqing, Sichuan, Guizhou, Yunnan, Tibet, Shaanxi, Gansu, Qinghai, Ningxia and Xinjiang. Northeastern region: including Liaoning, Jilin and Heilongjiang.
5. Standard Industrial Classification
NBS performed the industrial classification for national economic activities (GB/T 4754-2017).
6. Revision on Month-on-Month Data
According to the auto-revision function of the seasonal adjustment model, the month-on-month growth rate of investment on fixed assets from November 2018 to November 2019 has been revised as follows:
| The Month-on-Month Growth Rate of Investment on Fixed Assets (Excluding Rural Households) | |
| Growth Rate (%) | |
| 2018- December | 0.43 |
| 2019-January | 0.46 |
| February | 0.45 |
| March | 0.44 |
| April | 0.43 |
| May | 0.42 |
| June | 0.45 |
| July | 0.43 |
| August | 0.41 |
| September | 0.44 |
| October | 0.41 |
| November | 0.42 |
| December | 0.44 |
7. Explanation of Year-on-Year Growth
According to the results of statistical law enforcement inspection and the fourth national economic census unit inventory, the fixed assets investment base in the previous year was revised, and the growth rate was calculated on comparable basis.