Energy production in September 2019
In September, the production of industrial raw coal slowed down, while the production of crude oil natural gas and electricity increased.
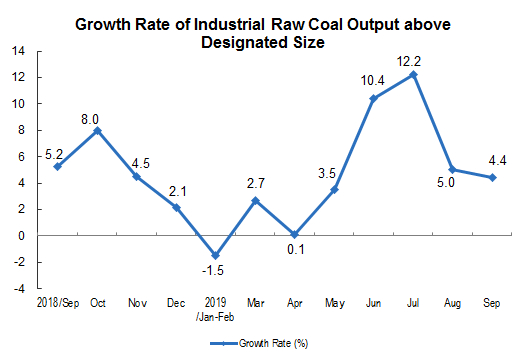
1. Raw coal production slowed down
In September, the output of raw coal was 320 million tons, up by 4.4 percent year-on-year, and the growth rate fell 0.6 percentage point than that of last month. The average daily output was 10.8 million tons, 610 thousand tons more than last month. In the first three quarters, the output of raw coal was 2.74 billion tons, an increase of 4.5 percent year-on-year, and 1.9 percent points faster than that in the first half year.
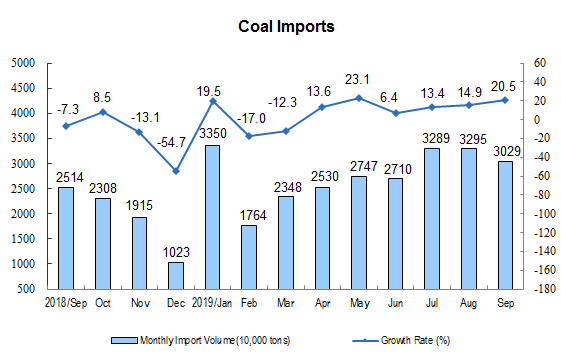
In September, 30.29 million tons of coal were imported, an increase of 20.5 percent year on year, 2.66 million tons less than last month. In the first three quarters, 250.57 million tons of coal were imported, an increase of 9.5 percent year-on-year, and 3.7 percent points of faster than that in the first half year.
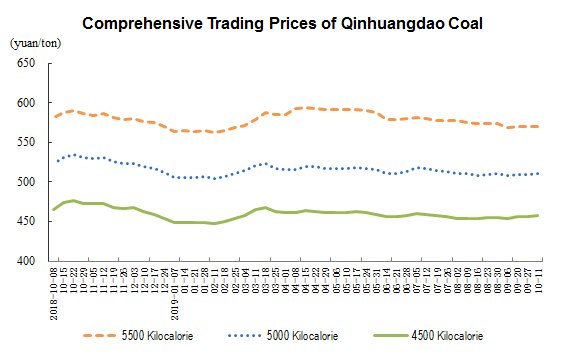
Coal prices were stable. On September 27, the comprehensive trading price of Qinhuangdao 5500 kilocalorie coal was 570 yuan per ton, and 509 yuan per ton for 5000 kilocalories, respectively fell 4 and 1 yuan than that in late August. That of 4500 kilocalories coal was 456 yuan per ton, 1 yuan higher than that in late August.
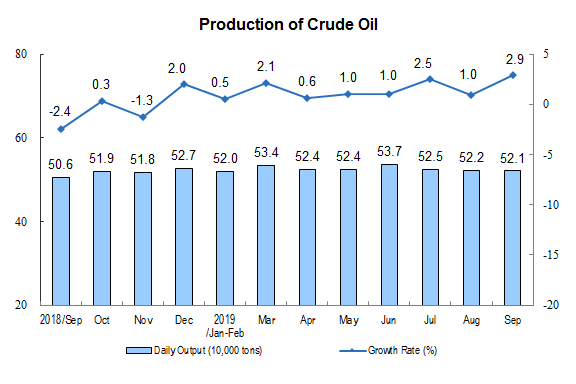
2. Crude oil production increased
In September, 15.64 million tons of crude oil were produced, an increase of 2.9 percent year on year, and the growth rate up by 1.9 percentage points compared with last month. The average daily output was 521 thousand tons, 1 thousand tons less than last month. In the first three quarters, 143.13 million tons of crude oil were produced, an increase of 1.2 percent year-on-year, and 0.4 percent point of faster than that in the first half year.
In September, 41.24 million tons of crude oil were imported, up by 10.8 percent year-on-year, 930 thousand tons less than last month. In the first three quarters, imported crude oil was 369.04 million tons, an increase of 9.7 percent year-on-year, and 0.9 percent point of faster than that in the first half year.
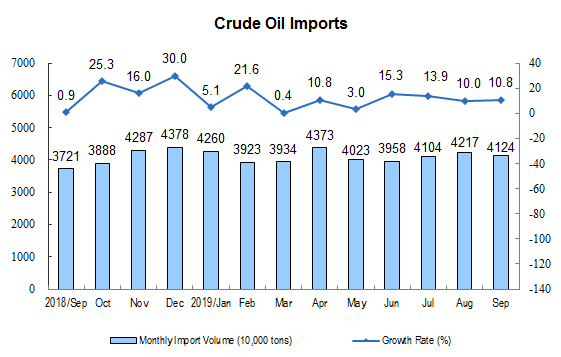
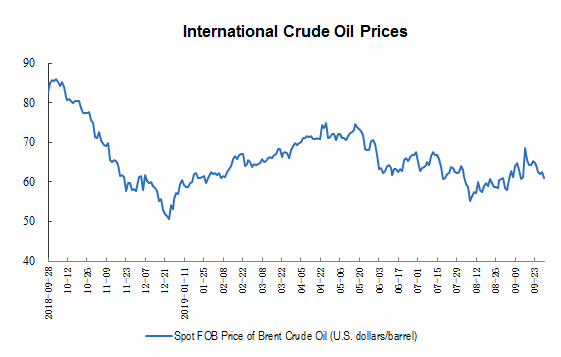
International crude oil prices rose first and then fell in September. The spot FOB price of Brent crude oil on September 30 was 60.99 U.S. dollar per barrel, kept the same level with that on August 30.
3. The speed of crude oil processing accelerated
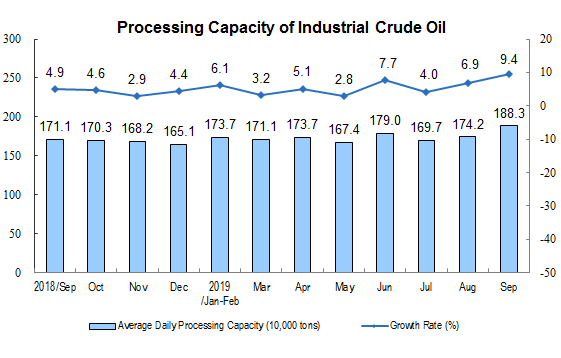
In September, 56.49 million tons of crude oil were processed, an increase of 9.4 percent year-on-year, and the growth rate increase of 2.5 percentage points over the previous month. The average daily processing capacity was 1,883 thousand tons, an increase of 141 thousand tons over the previous month. In the first three quarters, 480.38 million tons of crude oil were processed, an increase of 6.2 percent year-on-year, and 0.4 percent point of faster than that in the first half year.
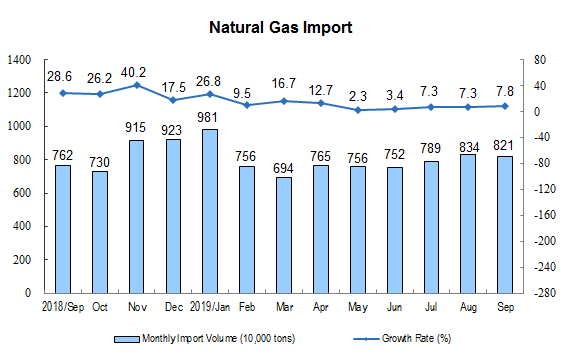
4. Natural gas production kept growing rapidly
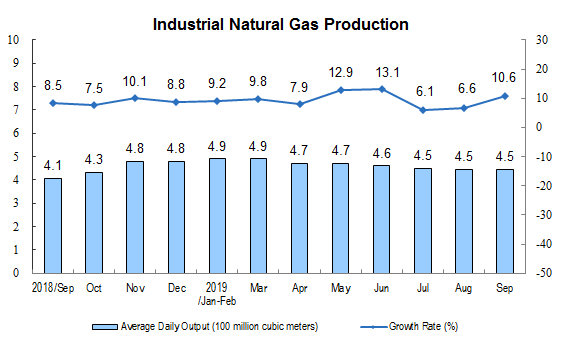
In September, the production of natural gas was 13.5 billion cubic meters, up 10.6 percent year-on-year, 0.4 percentage point faster than last month, and the average daily output was 450 million cubic meters, the same as last month. In the first three quarters, 127.7 billion cubic meters of natural gas were produced, an increase of 9.5 percent year-on-year, and 0.8 percent point of slower than that in the first half year.
In September, 8.21 million tons of natural gas were imported, an increase of 7.8 percent over the same period last month, 130 thousand tons less than last month. In the first three quarters, 71.22 million tons of natural gas were imported, an increase of 10.0 percent year-on-year, and 1.6 percent points of slower than that in the first half year.
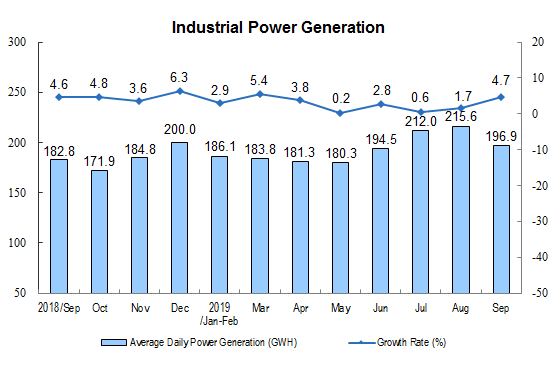
5. Electric power production has accelerated
In September, 590.8 billion kilowatt-hours of power were generated, increased by 4.7 percent year-on-year, 3.0 percentage points faster than last month, and the average daily power generation was 19.69 billion kilowatt-hours, a decrease of 1.87 billion kilowatt-hours over last month. In the first three quarters, 5.3 trillion kWh of electricity was generated, an increase of 3.0 percent year-on-year, and 0.3 percent point of decrease than that in the first half year.
In terms of different varieties, in September, the growth rate of thermal power production changed from negative to positive, while hydropower and wind power changed from positive to negative, nuclear power slowed down slightly, and solar power generation accelerated. Among them, thermal power increased by 6.0 percent year-on-year and dropped by 0.1 percent last month. Hydropower and wind power decreased by 1.1 and 7.9 percent respectively, and increased by 1.6 and 13.7 percent last month. Nuclear power increased by 17.9 percent, and the growth rate slowed down by 3.3 percentage points compared with last month. Solar power increased by 19.4 percent, and accelerated by 5.5 percentage points.
Annotations:
1. Explanatory Notes
Raw coal: refers to the raw coal produced by a coal mine that has been checked and accepted and meets the quality standards. That is to say, gangue with specified size (including pyrite and other impurities) is selected from coal and the absolute dry ash content of raw coal is less than 40 percent. Although the absolute dry ash content is over 40 percent, the inferior coal which has been mined with the approval of the relevant departments and has consumption demand should also be included in the output of raw coal. Raw coal is divided into anthracite, bituminous coal and lignite. In bituminous coal, it is divided into coking bituminous coal and general bituminous coal. Raw coal does not include stone coal, peat (peat) and gangue mined with the production process of raw coal.
Average daily product output: It is calculated by dividing the total output of Industrial Enterprises above the designated size announced in that month by the calendar days of that month.
2. Statistical Coverage
The statistical caliber of the output data in the report is above the designated size of industry, and the statistical scope is industrial enterprises with annual main business income of more than 20 million yuan.
Because the scope of Industrial Enterprises above the designated size changes every year, in order to ensure that this year's data is comparable with the previous year's, the same period used to calculate the growth rate of various indicators such as product output is consistent with the statistical scope of enterprises in this period, and there is a caliber difference between the data released last year.
3. Survey Methods
Import data comes from the General Administration of Customs, of which August data is express data; coal price data comes from China Coal Market Network; crude oil price data comes from the United States Energy Information Agency (EIA).
4. Conversion relationship of natural gas units: 1 ton is equal to 1380 cubic meters.