Industrial Profits Increased in the First Four Months of 2018
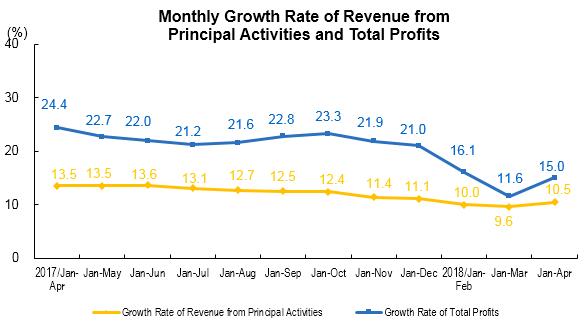
In the first four months of 2018, the profits made by industrial enterprises above the designated size achieved 2,127.17 billion yuan, a year-on-year increase of 15.0 percent, and the growth rate increased by 3.4 percentage points from the first three months.
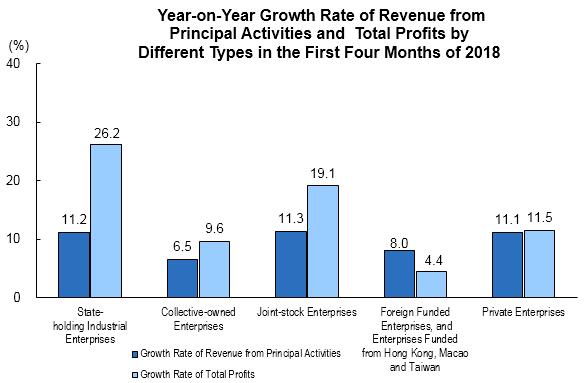
In the first four months, the profits of state-holding industrial enterprises above the designated size gained 627.03 billion yuan, an increase of 26.2 percent year-on-year; that of collective-owned enterprises reached 7.53 billion yuan, an increase of 9.6 percent; that of joint-stock enterprises stood at 1,491.9 billion yuan, up by 19.1 percent; that of foreign funded enterprises, and enterprises funded from Hong Kong, Macao and Taiwan achieved 520.57 billion yuan, increased by 4.4 percent; and that of private enterprises gained 590.29 billion yuan, an increase of 11.5 percent.
In the first four months, the profits of mining and quarrying reached 184.84 billion yuan, an increase of 39.0 percent year-on-year; that of manufacturing was 1,796.37 billion yuan, an increase of 12.0 percent; that of production and distribution of electricity, heat, gas and water reached 145.96 billion yuan, up by 28.7 percent.
In the first four months, within 41 branches of industrial divisions, the industrial profits of 29 industrial divisions increased year-on-year, that of 1 remained at the same level, and that of 11 decreased. In view of the profit growth of major industries, the profits of mining and washing of coal increased by 15.5 percent year-on-year, that of extraction of petroleum and natural gas increased by 2.1 times, that of processing of food from agricultural products increased by 2.1 percent year-on-year, that of manufacture of textile up by 1.0 percent, that of processing of petroleum, coal and other fuels increased by 19.6 percent, that of manufacture of chemical raw material and chemical products increased by 23.0 percent, that of manufacture of non-metallic mineral products increased by 45.2 percent, that of manufacture and processing of ferrous metals increased by 95.4 percent, that of manufacture of general-purpose machinery up by 9.8 percent, that of manufacture of special-purpose machinery up by 23.9 percent, that of manufacture of electrical machinery and equipment increased by 2.7 percent, that of production and supply of electric power and heat power up by 30.3 percent, that of manufacture and processing of non-ferrous metals decreased by 15.8 percent, that of manufacture of motor vehicles decreased by 0.6 percent, that of manufacture of computer, communication equipment and other electronic equipment decreased by 5.3 percent.
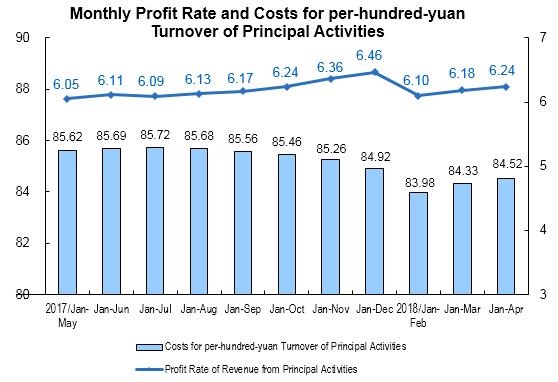
In the first four months, the revenue from principal activities of industrial enterprises above the designated size reached 34.1 trillion yuan, increased by 10.5 percent year-on-year. The costs of principal activities were 28.8 trillion yuan, up by 10.2 percent. The profit rate of revenue from principal activities was 6.24 percent, an increase of 0.24 percentage points year-on-year.
By the end of April, the total assets of industrial enterprises above the designated size was 107.9 trillion yuan, increased by 7.3 percent year-on-year; the total liabilities reached 61.0 trillion yuan, increased by 6.1 percent; the total owners' equity was 46.9 trillion yuan, increased by 8.8 percent. The asset-liability ratio was 56.5 percent, a decrease of 0.7 percentage points year-on-year.
By the end of April, the total volume of receivable accounts for industrial enterprises above designated hit 13.3 trillion yuan, went up by 10.8 percent year-on-year. The total value of finished products for industrial enterprises accounted for 4,018.89 billion yuan, increased by 5.5 percent.
In the first four months, the costs for per-hundred-yuan turnover of principal activities stood at 84.52 yuan, a decrease of 0.21 yuan year-on-year; the expenses for per-hundred-yuan turnover of principal activities stood at 8.13 yuan, a decrease of 0.04 yuan; the revenue from principal activities brought by per hundred yuan assets was 95.7 yuan, an increase of 2.7 yuan; the revenue from principal activities per capita was 1251 thousand yuan, an increase of 140 thousand yuan; the turnover days of finished goods were 16.4 days, a decrease of 0.5 days; the days sales outstanding hit an average of 45.5 days, a decrease of 0.1 day.
In April, the profits made by industrial enterprises above the designated size achieved 576.03 billion yuan, a year-on-year increase of 21.9 percent, and the growth rate increased by 18.8 percentage points from March.
| Key Financial Indicators of Industrial Enterprises above the Designated Size in the First Four Months of 2018
| ||||||
| Table I | ||||||
| Indicators |
|
| Total Profits | |||
| Operating Income | Of which: Revenue from Principal Activities | |||||
| Jan-Apr (100 million yuan) | Increase rate Y/Y (%) | Jan-Apr (100 million yuan) | Increase rate Y/Y (%) | Jan-Apr (100 million yuan) | Increase rate Y/Y (%) | |
|
|
|
|
|
|
|
|
| Total | 348659.9 | 10.6 | 340888.9 | 10.5 | 21271.7 | 15.0 |
| Of which: Mining and Quarrying | 14969.7 | 4.8 | 14331.9 | 5.4 | 1848.4 | 39.0 |
| Manufacturing | 310562.6 | 10.7 | 303727.5 | 10.5 | 17963.7 | 12.0 |
| Production and Distribution of Electricity, Heat, Gas and Water | 23127.6 | 13.1 | 22829.5 | 13.3 | 1459.6 | 28.7 |
| Of which: State-holding Enterprises | 88303.0 | 10.9 | 85128.2 | 11.2 | 6270.3 | 26.2 |
| Of which: Collective-owned Enterprises | 1297.6 | 6.2 | 1270.0 | 6.5 | 75.3 | 9.6 |
| Joint-Stock Enterprises | 247255.3 | 11.3 | 241599.2 | 11.3 | 14919.0 | 19.1 |
| Enterprises with Funds From Hong Kong, Macao and Taiwan, and Foreign Funded Enterprises | 80222.0 | 8.3 | 78455.8 | 8.0 | 5205.7 | 4.4 |
| Of which: Private Enterprises | 111766.3 | 11.4 | 110208.0 | 11.1 | 5902.9 | 11.5 |
|
|
|
|
|
|
|
|
Note : Due to the overlap of economic type grouping, the total is not equal to the total of sub-items.
| Key Financial Indicators of Industrial Enterprises above the Designated Size in the First Four Months of 2018
| |||||
| Continued from Table I |
| ||||
| Indicators |
|
|
| ||
| Operating Costs | Of which: Costs of Principal Activities |
| |||
| Jan- Apr (100 million yuan) | Increase rate Y/Y (%) | Jan- Apr (100 million yuan) | Increase rate Y/Y (%) |
| |
|
|
|
|
|
|
|
| Total | 295030.1 | 10.3 | 288117.1 | 10.2 |
|
| Of which: Mining and Quarrying | 10862.6 | -0.1 | 10230.7 | 0.1 |
|
| Manufacturing | 263556.2 | 10.6 | 257476.6 | 10.4 |
|
| Production and Distribution of Electricity, Heat, Gas and Water | 20611.3 | 12.9 | 20409.8 | 13.1 |
|
| Of which: State-holding Enterprises | 71344.0 | 9.9 | 68460.4 | 10.2 |
|
| Of which: Collective-owned Enterprises | 1060.4 | 8.8 | 1036.2 | 9.0 |
|
| Joint-Stock Enterprises | 208712.4 | 10.8 | 203586.2 | 10.7 |
|
| Enterprises with Funds From Hong Kong, Macao and Taiwan, and Foreign Funded Enterprises | 67900.0 | 8.7 | 66428.4 | 8.5 |
|
| Of which: Private Enterprises | 97560.6 | 11.4 | 96126.2 | 11.1 |
|
|
|
|
|
|
|
|
Note : Due to the overlap of economic type grouping, the total is not equal to the total of sub-items.
| Quality Performance Indicators of Industrial Enterprises above the Designated Size in the First Four Months of 2018
|
| ||||||||
| Table II | |||||||||
| Indicators | Profit Rate of Revenue from Principal Activities | Costs for per-hundred-yuan Turnover of Principal Activities | Expenses for per-hundred-yuan Turnover of Principal Activities | Revenue from Principal Activities Brought by per Hundred yuan Assets | Revenue from Principal Activities per Capita | Asset-Liability Ratio | Turnover Days of Finished Goods | Days Sales Outstanding | |
| (%) | (yuan) | (yuan) | (yuan) | 10 thousand yuan/ person | (%) | (days) | (days) | ||
|
|
|
|
|
|
|
|
|
| |
| Total | 6.24 | 84.52 | 8.13 | 95.7 | 125.1 | 56.5 | 16.4 | 45.5 | |
| Of which: Mining and Quarrying | 12.90 | 71.38 | 11.58 | 46.4 | 82.6 | 59.5 | 14.7 | 36.0 | |
| Manufacturing | 5.91 | 84.77 | 8.15 | 112.2 | 124.4 | 55.4 | 17.8 | 47.1 | |
| Production and Distribution of Electricity, Heat, Gas and Water | 6.39 | 89.40 | 5.61 | 41.9 | 206.5 | 60.6 | 0.6 | 30.1 | |
| Of which: State-holding Enterprises | 7.37 | 80.42 | 8.06 | 60.6 | 178.5 | 59.5 | 16.1 | 41.3 | |
| Of which: Collective-owned Enterprises | 5.93 | 81.59 | 12.26 | 85.9 | 102.7 | 65.5 | 37.2 | 38.1 | |
| Joint-Stock Enterprises | 6.18 | 84.27 | 8.21 | 93.7 | 124.3 | 57.7 | 16.9 | 42.7 | |
| Enterprises with Funds From Hong Kong, Macao and Taiwan, and Foreign Funded Enterprises | 6.64 | 84.67 | 8.53 | 109.5 | 121.2 | 53.7 | 17.0 | 60.7 | |
| Of which: Private Enterprises | 5.36 | 87.22 | 7.10 | 147.3 | 111.1 | 55.7 | 14.6 | 36.2 | |
|
|
|
|
|
|
|
|
|
| |
| Key Financial Indicators of Industrial Enterprises above the Designated Size in the First Four Months of 2018 (Group by Industries)
| ||||||
| Table III | ||||||
| Indicators |
|
| Total Profits | |||
| Operating Income | Of which: Revenue from Principal Activities | |||||
| Jan- Apr (100 million yuan) | Increase rate Y/Y (%) | Jan- Apr (100 million yuan) | Increase rate Y/Y (%) | Jan- Apr (100 million yuan) | Increase rate Y/Y (%) | |
|
|
|
|
|
|
|
|
| Total | 348659.9 | 10.6 | 340888.9 | 10.5 | 21271.7 | 15.0 |
| Mining and Washing of Coal | 8241.6 | 4.6 | 7702.0 | 5.6 | 1019.0 | 15.5 |
| Extraction of Petroleum and Natural Gas | 2590.3 | 6.7 | 2546.2 | 6.6 | 545.3 | 207.7 |
| Mining of Ferrous Metal Ores | 1110.3 | -2.0 | 1087.7 | -2.4 | 31.7 | -46.1 |
| Mining of Non-Ferrous Metal Ores | 1392.3 | 5.5 | 1376.6 | 5.9 | 171.7 | 22.6 |
| Mining And Processing of Nonmetal Ores | 1170.4 | 8.0 | 1162.8 | 8.7 | 73.0 | -3.1 |
| Mining Support Service Activities | 452.8 | 5.1 | 444.6 | 4.5 | 6.9 | (Note) |
| Mining of Other Ores N.E.C | 12.0 | 22.4 | 12.0 | 22.4 | 0.7 | 0.0 |
| Processing of Food From Agricultural Products | 16893.8 | 6.2 | 16763.1 | 6.0 | 711.0 | 2.1 |
| Manufacture of Foods | 6536.3 | 8.7 | 6447.8 | 8.8 | 510.9 | 5.4 |
| Manufacture of Wines, Beverage and Refined Tea | 5523.0 | 12.0 | 5450.9 | 11.9 | 709.7 | 24.8 |
| Manufacture of Cigarettes And Tobacco | 3943.0 | 17.5 | 3529.7 | 13.6 | 422.3 | 8.8 |
| Manufacture of Textile | 10271.1 | 2.5 | 10050.1 | 1.9 | 420.5 | 1.0 |
| Manufacture of Textile Wearing Apparel And Ornament | 6012.6 | 4.9 | 5919.0 | 4.7 | 314.2 | 0.9 |
| Manufacture of Leather, Fur, Feather Aad Its Products | 4022.0 | 5.7 | 4011.9 | 5.7 | 221.6 | 2.0 |
| Processing of Timbers, Manufacture of Wood, Bamboo, Rattan, Palm, and Straw Products | 3346.7 | 4.2 | 3335.0 | 4.1 | 177.0 | 0.9 |
| Manufacture of Furniture | 2562.3 | 7.6 | 2542.4 | 7.6 | 136.2 | -0.5 |
| Manufacture of Paper and Paper Products | 4830.0 | 13.2 | 4754.0 | 13.2 | 295.5 | 14.8 |
| Printing, Reproduction of Recording Media | 2275.1 | 9.4 | 2252.0 | 9.3 | 136.8 | 10.1 |
| Manufacture of Articles for Culture, Education, Artwork, Sport and Entertainment Activity | 4603.8 | 8.3 | 4576.8 | 8.4 | 202.4 | -3.9 |
| Petroleum,Coal and Other Fuel Manufacturing | 15358.7 | 17.1 | 14856.2 | 16.2 | 874.0 | 19.6 |
| Manufacture of Chemical Raw Material and Chemical Products | 25336.2 | 11.7 | 24797.3 | 11.8 | 1837.8 | 23.0 |
| Manufacture of Medicines | 8351.9 | 14.8 | 8267.5 | 14.9 | 987.9 | 16.4 |
| Manufacture of Chemical Fibres | 2548.3 | 15.1 | 2452.5 | 14.3 | 97.8 | -8.3 |
| Manufacture of Rubber and Plastics Products | 8849.4 | 6.4 | 8739.7 | 6.4 | 442.2 | -1.1 |
| Manufacture of Non-Metallic Mineral Products | 16854.4 | 15.0 | 16747.3 | 14.9 | 1329.4 | 45.2 |
| Manufacture and Processing of Ferrous Metals | 20560.6 | 15.1 | 19610.9 | 15.6 | 1110.9 | 95.4 |
| Manufacture and Processing of Non-Ferrous Metals | 16845.0 | 11.9 | 16108.1 | 11.6 | 376.6 | -15.8 |
| Manufacture of Fabricated Metal Products | 12116.4 | 8.0 | 11928.5 | 8.3 | 522.1 | -2.4 |
| Manufacture of General-Purpose Machinery | 13631.1 | 11.2 | 13459.0 | 11.2 | 824.9 | 9.8 |
| Manufacture of Special-Purpose Machinery | 10642.9 | 15.2 | 10385.5 | 15.6 | 665.8 | 23.9 |
| Manufacture of Motor Vehicles | 28036.8 | 10.5 | 27216.4 | 10.3 | 2048.2 | -0.6 |
| Manufacture of Railway Locomotives, Building of Ships and Boats, Manufacture of Air and Spacecrafts and Other Transportation Equipments | 3727.8 | 5.7 | 3668.5 | 6.1 | 152.1 | -12.2 |
| Manufacture of Electrical Machinery and Equipment | 21017.4 | 12.1 | 20487.3 | 12.1 | 1005.3 | 2.7 |
| Manufacture of Computer, Communication Equipment and Other Electronic Equipment | 31251.9 | 8.2 | 30802.9 | 7.9 | 1125.1 | -5.3 |
| Manufacture of Measuring Instrument and Meter | 2550.9 | 11.1 | 2517.4 | 10.8 | 198.1 | 21.2 |
| Other Manufacturing | 633.7 | 5.5 | 629.6 | 5.4 | 37.0 | 0.3 |
| Waste Recycling and Recovery | 1114.5 | 7.6 | 1108.6 | 8.0 | 56.1 | 10.4 |
| Repair of Fabricated Metal Products, Machinery and Equipment | 314.8 | 6.8 | 311.7 | 6.8 | 14.2 | 12.7 |
| Production and Supply of Electric Power and Heat Power | 19844.3 | 12.3 | 19639.1 | 12.4 | 1184.3 | 30.3 |
| Production and Distribution of Gas | 2497.9 | 21.8 | 2449.7 | 22.0 | 217.8 | 26.1 |
| Production and Distribution of Water | 785.4 | 10.3 | 740.7 | 10.4 | 57.5 | 9.3 |
|
|
|
|
|
|
|
|
Note : Mining and Support Service Activities had a loss of 1.36 billion yuan in the same period of last year.
| Key Financial Indicators of Industrial Enterprises above the Designated Size in the First Four Months of 2018 (Group by Industries) |
| ||||
|
|
| ||||
| Continued from Table III |
| ||||
| Indicators |
|
| |||
| Operating Costs | Of which: Costs of Principal Activities | ||||
| Jan-Apr (100 million yuan) | Increase rate Y/Y (%) | Jan-Apr (100 million yuan) | Increase rate Y/Y (%) | ||
|
|
|
|
|
| |
| Total | 295030.1 | 10.3 | 288117.1 | 10.2 | |
| Mining and Washing of Coal | 5863.9 | 2.4 | 5364.0 | 3.5 | |
| Extraction of Petroleum and Natural Gas | 1608.2 | -12.1 | 1527.1 | -13.8 | |
| Mining of Ferrous Metal Ores | 938.2 | -2.0 | 918.2 | -2.3 | |
| Mining of Non-Ferrous Metal Ores | 1090.8 | 3.5 | 1075.4 | 3.5 | |
| Mining And Processing of Nonmetal Ores | 937.9 | 7.3 | 932.1 | 8.3 | |
| Mining Support Service Activities | 414.2 | -2.2 | 404.5 | -3.7 | |
| Mining of Other Ores N.E.C | 9.4 | 25.3 | 9.4 | 25.3 | |
| Processing of Food From Agricultural Products | 15209.7 | 6.6 | 15096.1 | 6.3 | |
| Manufacture of Foods | 5221.6 | 8.4 | 5139.3 | 8.5 | |
| Manufacture of Wines, Beverage and Refined Tea | 3885.6 | 9.1 | 3829.1 | 9.0 | |
| Manufacture of Cigarettes And Tobacco | 1351.0 | 23.3 | 953.0 | 12.1 | |
| Manufacture of Textile | 9249.5 | 2.5 | 9057.2 | 1.7 | |
| Manufacture of Textile Wearing Apparel And Ornament | 5123.8 | 5.0 | 5045.1 | 4.8 | |
| Manufacture of Leather, Fur, Feather Aad Its Products | 3507.9 | 6.0 | 3499.7 | 6.0 | |
| Processing of Timbers, Manufacture of Wood, Bamboo, Rattan, Palm, and Straw Products | 2946.8 | 4.5 | 2937.5 | 4.4 | |
| Manufacture of Furniture | 2163.5 | 7.6 | 2150.7 | 7.6 | |
| Manufacture of Paper and Paper Products | 4163.3 | 14.0 | 4097.3 | 14.0 | |
| Printing, Reproduction of Recording Media | 1927.1 | 9.3 | 1911.0 | 9.1 | |
| Manufacture of Articles for Culture, Education, Artwork, Sport and Entertainment Activity | 4052.5 | 8.9 | 4032.4 | 9.0 | |
| Petroleum,Coal and Other Fuel Manufacturing | 12447.3 | 19.4 | 11967.2 | 18.4 | |
| Manufacture of Chemical Raw Material and Chemical Products | 21295.1 | 11.2 | 20815.9 | 11.1 | |
| Manufacture of Medicines | 5193.2 | 8.6 | 5141.8 | 8.9 | |
| Manufacture of Chemical Fibres | 2314.5 | 16.8 | 2226.1 | 15.7 | |
| Manufacture of Rubber and Plastics Products | 7655.4 | 6.6 | 7558.8 | 6.5 | |
| Manufacture of Non-Metallic Mineral Products | 14098.8 | 13.2 | 14011.7 | 13.2 | |
| Manufacture and Processing of Ferrous Metals | 18460.3 | 12.5 | 17589.9 | 12.9 | |
| Manufacture and Processing of Non-Ferrous Metals | 15821.7 | 12.5 | 15125.4 | 12.4 | |
| Manufacture of Fabricated Metal Products | 10696.3 | 8.5 | 10536.6 | 8.8 | |
| Manufacture of General-Purpose Machinery | 11478.1 | 11.3 | 11337.9 | 11.4 | |
| Manufacture of Special-Purpose Machinery | 8817.5 | 14.7 | 8576.9 | 15.1 | |
| Manufacture of Motor Vehicles | 23573.7 | 11.6 | 22886.5 | 11.4 | |
| Manufacture of Railway Locomotives, Building of Ships and Boats, Manufacture of Air and Spacecrafts and Other Transportation Equipments | 3214.1 | 7.2 | 3178.4 | 7.6 | |
| Manufacture of Electrical Machinery and Equipment | 17971.5 | 12.8 | 17495.9 | 12.8 | |
| Manufacture of Computer, Communication Equipment and Other Electronic Equipment | 27859.3 | 9.1 | 27460.0 | 9.0 | |
| Manufacture of Measuring Instrument and Meter | 2030.8 | 10.2 | 2005.5 | 9.8 | |
| Other Manufacturing | 541.8 | 5.8 | 538.5 | 5.8 | |
| Waste Recycling and Recovery | 1013.8 | 7.8 | 1007.8 | 8.2 | |
| Repair of Fabricated Metal Products, Machinery and Equipment | 270.8 | 7.5 | 267.7 | 7.7 | |
| Production and Supply of Electric Power and Heat Power | 17872.4 | 11.9 | 17725.5 | 12.1 | |
| Production and Distribution of Gas | 2153.4 | 22.5 | 2123.6 | 22.5 | |
| Production and Distribution of Water | 585.5 | 10.8 | 560.7 | 10.6 | |
|
|
|
|
|
| |
Annotations:
1. Explanatory Notes:
Total Profits: refer to the surplus of various revenue deducting various costs in the production process of enterprises, reflecting the total profit and loss in the report period.
Operating income: refers to the total amount of revenue of enterprises recognized by the principal business and other business operations.
Revenue from Principal Activities: refers to the total amount of revenue of enterprises gained from the principal business operation.
Operating costs: refers to the total costs of enterprises incurred by the principal business and other business operations.
Costs of Principal Activities: refers to the total costs of enterprises incurred by the principal business operation.
Total Assets: refers to the resources which are gotten from past transactions or events, owned or controlled by enterprises, and expected to bring economic benefits to the enterprises.
Total Liabilities: refers to the current obligation generated from past transactions or events, and expected an outflow of economic benefits from the enterprises.
Total Owners' Equity: refers to the residual interests after deducting liabilities, which belongs to the enterprises owners.
Accounts Receivable: refers to the creditor's rights due to the sale of goods, services, and other business activities, including the payment for goods, value-added tax, prepay freight and miscellaneous charges, to be collected from the customers.
Finished Goods: refers to manufactured products which are ready for sale by the end of report period.
Profit Rate of Revenue from Principal Activities = total profits / revenue from principal activities × 100%, unit: %.
Costs for per-hundred-yuan Turnover of Principal Activities = the costs of revenue from principal activities / the revenue from principal activities ×100, unit: yuan.
Expenses for per-hundred-yuan Turnover of Principal Activities = (selling expenses + administrative expenses + financial expenses) / the revenue from principal activities ×100, unit: yuan.
Revenue from Principal Activities Brought by per Hundred yuan Assets = the revenue from principal activities / average assets / the cumulative number of months × 12 × 100, unit: yuan.
Revenue from Principal Activities per Capita = revenue from principal activities / average number of employment / the cumulative number of months × 12, unit: 10 thousand yuan/ person.
Asset-Liability Ratio = total liabilities / total assets × 100%, unit: %.
Turnover Days of Finished Goods = 360 × average finished goods / costs of principal activities × the cumulative number of months / 12, unit: days.
Days Sales Outstanding (the number of days on average a company takes to collect its accounts receivable) = 360 ×average accounts receivable / revenue from principal activities ×the cumulative number of months / 12, unit: days.
In the columns of increase rate year-on-year of the three tables above, the “note” refers to negative total profits in the same period last year, which means loss; the positive value refers to a year-on-year increase of profits; the negative value which is greater than or equal to -100% refers to a year-on-year decrease of profits; the value less than -100% indicates turning gain in the same period last year into loss in current period; and the value of 0 indicates that the profits remain at the same level year-on-year.
As the range of industrial enterprises above the designated size changes every year, in order to ensure that the data of this year is comparable with that of last year, when calculating the year-on-year growth rate and growth amount of indicators, the statistical coverage of data in the same period is consistent with that of the current period, while is different with the data released last year.
2. Statistical Coverage
Industrial enterprises above the designated size, which refer to industrial enterprises with revenue from principal activities over 20 million yuan
3. Data Collection
The Financial Report of Enterprises Above the Designated Size conducts complete survey by month (the data on January are not required to report).
4. Industrial Classification Standard
The Industrial Classification for National Economic Activities (GB/T4754-2017) was implemented, please refer to http://www.stats.gov.cn/tjsj/tjbz/hyflbz.