Statistical Communiqué of the People's Republic of China on the 2014 National Economic and Social Development
STATISTICAL COMMUNIQUÉ OF THE PEOPLE'S REPUBLIC OF CHINA
ON THE 2014 NATIONAL ECONOMIC AND SOCIAL DEVELOPMENT[1]
National Bureau of Statistics of China
February 26, 2015
In 2014, faced with the complicated and volatile international environment and the heavy tasks to maintain the domestic development, reform and stability, the Central Party Committee and the State Council led the people of all nationalities of China to seize the momentum of international and domestic development, adhere to the general tone of “moving forward while maintaining stability”, fully deepen the reform and opening up, focus on the innovation of macro control, tap into the vitality of the market and foster the driving force of innovation. As a result, the national economy performed steadily under the new normal with proactive structure adjustment, enhanced quality and improved people’s livelihood. The economy and society realized sustainable and stable development.
I. General Outlook
By the end of 2014, the total number of Chinese population at the mainland reached 1,367.82 million, an increase of 7.10 million over that at the end of 2013. Of this total, urban permanent residents numbered 749.16 million, accounting for 54.77 percent. The year 2014 saw 16.87 million births, a crude birth rate of 12.37 per thousand, and 9.77 million deaths, or a crude death rate of 7.16 per thousand. The natural growth rate was 5.21 per thousand. The number of population who live in places other than their household registration[2] reached 298 million, of which 253 million were floating population[3].
Table 1: Population and Its Composition by the end of 2014
| Item | Population (Year-end figure) (10,000 persons) | Proportion (%) |
| National Total | 136782 | 100.0 |
| Of which: Urban | 74916 | 54.77 |
| Rural | 61866 | 45.23 |
| Of which: Male | 70079 | 51.2 |
| Female | 66703 | 48.8 |
| Of which: Aged 0-15[4] (under the age of 16) | 23957 | 17.5 |
| Aged 16-59 (under the age of 60) | 91583 | 67.0 |
| Aged 60 and above | 21242 | 15.5 |
| Of which: Aged 65 and above | 13755 | 10.1 |
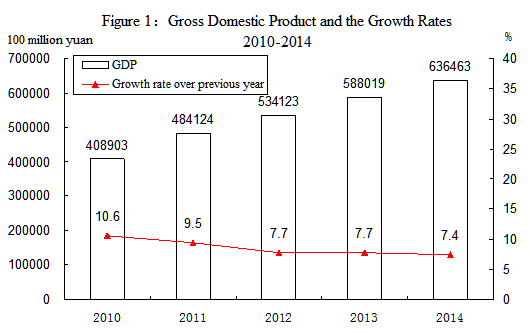
National economy maintained stable growth in 2014. According to preliminary accounting, the gross domestic product (GDP)[5] of the year was 63,646.3 billion yuan, up by 7.4 percent over the previous year. Of this total, the value added of the primary industry was 5,833.2 billion yuan, up by 4.1 percent, that of the secondary industry was 27,139.2 billion yuan, up by 7.3 percent and the tertiary industry was 30,673.9 billion yuan, up by 8.1 percent. The value added of the primary industry accounted for 9.2 percent of the GDP, that of the secondary industry accounted for 42.6 percent, and that of the tertiary industry accounted for 48.2 percent.
The employment continued to grow. At the end of 2014, the number of employed people in China was 772.53 million, and that in urban areas was 393.10 million. The newly increased employed people in urban areas numbered 13.22 million. The registered urban unemployment rate was 4.09 percent at the year end. The total number of migrant workers[6] in 2014 was 273.95 million, up by 1.9 percent over that of 2013. Of which, the migrant workers who left hometown and worked in other places were 168.21 million, increased by 1.3 percent, and those who worked in their own localities reached 105.74 million, up by 2.8 percent.

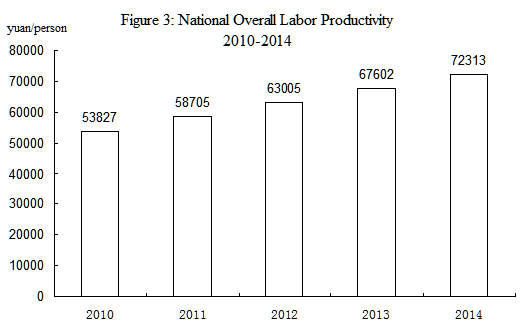
The labor productivity increased steadily. The overall labor productivity[7] was 72,313 yuan per person in 2014, an increase of 7.0 percent compared with that in 2013.
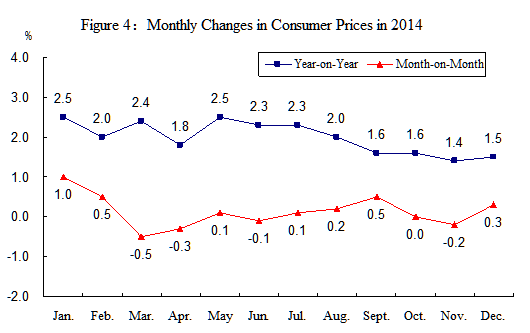
The prices increased slightly. The consumer prices in 2014 went up by 2.0 percent over the previous year. Of this total, the prices for food went up by 3.1 percent. The prices for investment in fixed assets increased by 0.5 percent. The producer prices and the purchasing prices for manufactured goods were down by 1.9 percent and 2.2 percent respectively. The producer prices for farm products[8] were down by 0.2 percent.
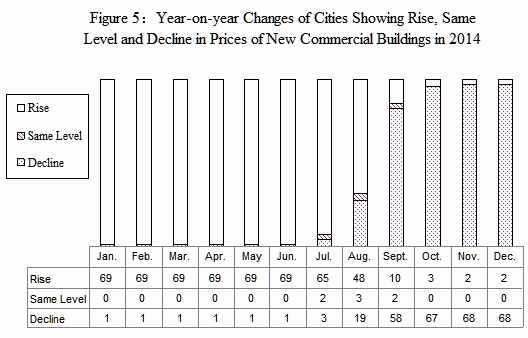
Out of the 70 large and medium-sized cities, the number of cities showed a year-on-year rise in sales prices of new commercial residential buildings in each month of the first half year was 69 and then decreased month by month in the second half. The number was 2 in December, whereas 68 cities experienced an annual decline.
| Table 2: Changes of Consumer Prices in 2014 | |||
| Unit: % | |||
| Item | National Average |
| |
| Urban | Rural | ||
| General level of consumer prices | 2.0 | 2.1 | 1.8 |
| Food | 3.1 | 3.3 | 2.6 |
| Tobacco, liquor and articles | -0.6 | -0.7 | -0.5 |
| Clothing | 2.4 | 2.4 | 2.4 |
| Household facilities, articles and maintenance services | 1.2 | 1.2 | 1.2 |
| Medical, health and personal articles | 1.3 | 1.2 | 1.5 |
| Transportation and telecommunications | -0.1 | -0.2 | 0.0 |
| Recreation, education, culture articles and services | 1.9 | 1.9 | 1.7 |
| Housing[9] | 2.0 | 2.1 | 1.9 |
The fiscal revenue grew steadily in 2014. The general public revenue reached 14,035.0 billion yuan, up by 8.6 percent or an increase of 1,114.0 billion yuan over that in the previous year. Of this total, the taxes collected in the whole year reached 11,915.8 billion yuan, up by 7.8 percent or an increase of 862.7 billion yuan over 2013.
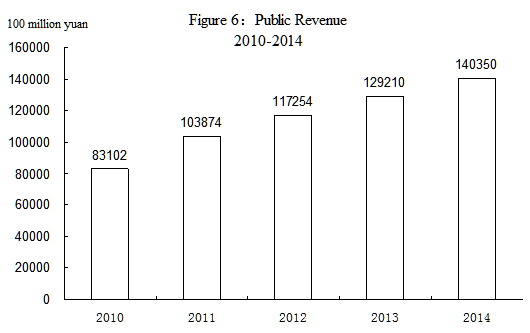
Note: Data for public revenue from 2010 to 2014 as shown in the figure were final accounts, and the revenue of 2014 was executive accounts.
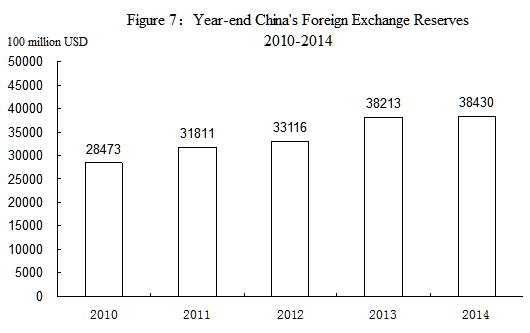
The foreign exchange reserves increased slightly. At the end of 2014, China’s foreign exchange reserves reached 3,843.0 billion US dollars, an increase of 21.7 billion US dollars as compared with that at the end of the pervious year. At the end of the year, the exchange rate was 6.1428 RMB to 1 USD, an appreciation by 0.8 percent over that of 2013.
II. Agriculture
In 2014, the sown area of grain was 112.74 million hectares, an increase of 780 thousand hectares compared with that in the previous year; the sown area of cotton was 4.22 million hectares, a decrease of 130 thousand hectares; the sown area of oil-bearing crops was 14.08 million hectares, an increase of 60 thousand hectares; the sown area of sugar crops was 1.91 million hectares, a decrease of 90 thousand hectares.
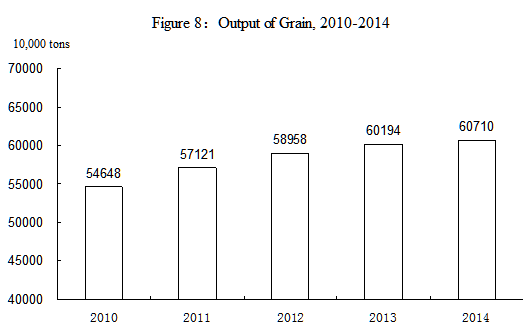
The year 2014 witnessed another harvest of grain. The total output of grain in 2014 was 607.10 million tons, an increase of 5.16 million tons or up by 0.9 percent over the previous year. Of this total, the output of summer crops was 136.60 million tons, increased by 3.6 percent, and that of the early rice was 34.01 million tons, down by 0.4 percent over the previous year. The output of autumn grain was 436.49 million tons, an increase of 0.1 percent. The output of cereal was 557.27 million tons, an increase of 0.8 percent, among which the output of rice was 206.43 million tons, up by 1.4 percent; that of wheat was 126.17 million tons, up by 3.5 percent; and that of corn was 215.67 million tons, down by 1.3 percent.
In 2014, the output of cotton was 6.16 million tons, a decrease of 2.2 percent over the previous year, that of oil-bearing crops was 35.17 million tons, the same as last year and that of sugar crops was 134.03 million tons, a decrease of 2.5 percent, and that of tea was 2.09 million tons, up by 8.7 percent.
The total output of meat for the year reached 87.07 million tons, up by 2.0 percent over the previous year. Of this total, the output of pork was 56.71 million tons, up by 3.2 percent; that of beef was 6.89 million tons, increased by 2.4 percent; and that of mutton was 4.28 million tons, an increase of 4.9 percent, and that of poultry was 17.51 million tons, a decrease of 2.7 percent. The total output of eggs was 28.94 million tons, up by 0.6 percent. The production of milk was 37.25 million tons, up by 5.5 percent. At the end of the year, 465.83 million pigs were registered in the total stocks, down by 1.7 percent, and 735.10 million pigs were slaughtered, up by 2.7 percent.
The total output of aquatic products was 64.50 million tons, up by 4.5 percent. Of this total, the output of cultured aquatic products was 47.62 million tons, up by 4.9 percent; and that of fished aquatic products was 16.88 million tons, up by 3.5 percent over the previous year.
The total production of timber for the year 2014 reached 81.78 million cubic meters, a decrease of 3.1 percent compared with last year.
Over 1.32 million more hectares of farmland were equipped with effective irrigation systems and another additional 2.23 million hectares of farmland was equipped with water-saving irrigation systems.
III. Industry and Construction
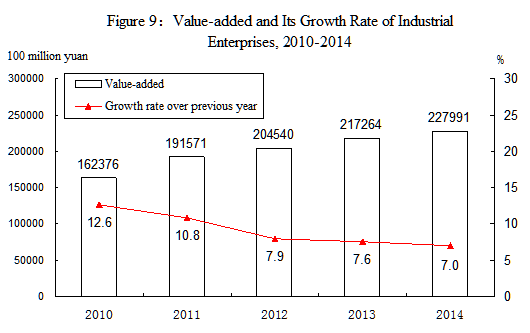
The industrial production grew steadily. In 2014, the total value added of the industrial sector was 22,799.1 billion yuan, up by 7.0 percent over the previous year. The value added of industrial enterprises above the designated size increased by 8.3 percent. Of the industrial enterprises above the designated size, in terms of ownership, the value added of the state-owned and state-holding enterprises grew by 4.9 percent, that of the collective enterprises went up by 1.7 percent, that of the share-holding enterprises increased by 9.7 percent, that of the enterprises by foreign investors and investors from Hong Kong, Macao and Taiwan soared by 6.3 percent and that of private enterprises grew by 10.2 percent. In terms of the sectors, the value added of the mining industry grew by 4.5 percent, that of manufacturing by 9.4 percent and that of the production and supply of electric power, heat power, gas and water by 3.2 percent.
In 2014, of the industrial enterprises above designated size, the growth of value added for processing of food from agricultural products was 7.7 percent over the previous year; for textile industry was 6.7 percent; for manufacture of general machinery 9.1 percent; for manufacture of special purpose machinery 6.9 percent; for manufacture of automobiles 11.8 percent; for manufacture of computers, communication equipment and other electronic equipment 12.2 percent and for manufacture of electrical machinery and equipment 9.4 percent. The growth of the value added for the major six high energy consuming industries was 7.5 percent, of which, that of the manufacture of non-metallic mineral products was 9.3 percent, manufacture of raw chemical materials and chemical products 10.3 percent, smelting and pressing of non-ferrous metals 12.4 percent, smelting and pressing of ferrous metals 6.2 percent, production and supply of electric power and heat power 2.2 percent and 5.4 percent for processing of petroleum, coking, processing of nuclear fuel. The value added growth for the high technology manufacturing industry[10] was 12.3 percent over the previous year, accounting for 10.6 percent of that of industrial enterprises above designated size. The value added growth for manufacturing of equipment[11] was 10.5 percent, accounting for 30.4 percent of that of industrial enterprises above designated size.
Table 3: Output of Major Industrial Products and the Growth Rates in 2014[12]
| Product | Unit | Output | Increase over 2013 (%) |
| Yarn | 10000 tons | 3379.2 | 5.6 |
| Cloth | 100 million meters | 893.7 | -0.4 |
| Chemical fibers | 10000 tons | 4389.8 | 5.5 |
| Sugar (final product) | 10000 tons | 1642.7 | 3.1 |
| Cigarettes | 100 million | 26098.5 | 1.9 |
| Color TV sets | 10000 | 14128.9 | 10.9 |
| Of which: LCD TV sets | 10000 | 13865.9 | 13.3 |
| Household refrigerators | 10000 | 8796.1 | -5.0 |
| Room air conditioners | 10000 | 14463.3 | 10.7 |
| Total primary energy production | 100 million tons of standard coal equivalent | 36.0 | 0.5 |
| Coal | 100 million tons | 38.7 | -2.5 |
| Crude oil | 100 million tons | 21142.9 | 0.7 |
| Natural gas[13] | 100 million cubic meters | 1301.6 | 7.7 |
| Electricity | 100 million kilowatt-hours | 56495.8 | 4.0 |
| Of which: Thermal-power | 100 million kilowatt-hours | 42337.3 | -0.3 |
| Hydro-power | 100 million kilowatt-hours | 10643.4 | 15.7 |
| Nuclear-power | 100 million kilowatt-hours | 1325.4 | 18.8 |
| Crude steel | 10000 tons | 82269.8 | 1.2 |
| Rolled steel[14] | 10000 tons | 112557.2 | 4.0 |
| Ten kinds of nonferrous metals | 10000 tons | 4380.1 | 7.4 |
| Of which: Refined copper (copper) | 10000 tons | 764.4 | 15.0 |
| Aluminum electrolyze | 10000 tons | 2435.8 | 10.3 |
| Aluminum oxide | 10000 tons | 4777.3 | 7.3 |
| Cement | 100 million tons | 24.8 | 2.3 |
| Sulfuric acid (100%) | 10000 tons | 8846.3 | 8.5 |
| Soda ash | 10000 tons | 2514.2 | 3.4 |
| Caustic soda (100%) | 10000 tons | 3059.0 | 4.5 |
| Ethylene | 10000 tons | 1696.7 | 6.1 |
| Chemical fertilizers (100 percent equivalent) | 10000 tons | 6887.2 | -2.0 |
| Power-generating equipment | 10000 kilowatts | 15053.0 | 6.0 |
| Motor vehicles | 10000 | 2372.5 | 7.3 |
| Of which: Basic passenger cars (cars) | 10000 | 1248.3 | 3.1 |
| Large & medium tractors | 10000 | 64.4 | -3.3 |
| Integrated circuits | 100 million pieces | 1015.5 | 12.4 |
| Program-controlled switchboards | 10000 lines | 3123.1 | 15.7 |
| Mobile telephones | 10000 | 162719.8 | 6.8 |
| Micro-computers | 10000 | 35079.6 | -0.8 |
By the end of 2014, the installed power generation capacity was 1,360.19 million kilowatts, up by 8.7 percent over that of the previous year, among which[15] the installed thermal power generation capacity was 915.69 million kilowatts, up by 5.9 percent; the installed hydropower generation capacity was 301.83 million kilowatts, up by 7.9 percent; the installed nuclear power generation capacity was 19.88 million kilowatts, up by 36.1 percent. The installed grid-connected wind power generation capacity was 95.81 million kilowatts, up by 25.6 percent and the installed grid-connected solar power generation capacity was 26.52 million kilowatts, an increase of 67.0 percent.
The profits made by the industrial enterprises above the designated size in 2014 were 6,471.5 billion yuan, an increase of 3.3 percent over the previous year. Of this total, the profits of the state-owned and state-holding enterprises were 1,400.7 billion yuan, down by 5.7 percent; that of the collective enterprises were 53.8 billion yuan, up by 0.4 percent; that of the share-holding enterprises 4,296.3 billion yuan, up by 1.6 percent; that of the enterprises by foreign investors and investors from Hong Kong, Macao and Taiwan 1,597.2 billion yuan, up by 9.5 percent; and that of private enterprises were 2,232.3 billion yuan, a rise of 4.9 percent.
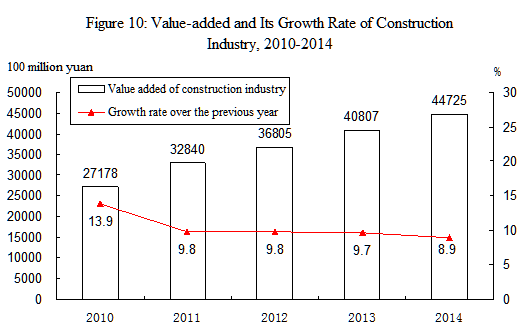
In 2014, the value added of construction enterprises in China was 4,472.5 billion yuan, up by 8.9 percent over the previous year. The profits made by construction enterprises qualified for general contracts and specialized contracts reached 691.3 billion yuan, up by 13.7 percent, of which the profits made by the state-owned and state-holding enterprises were 163.9 billion yuan, up by 11.7 percent.
IV. Investment in Fixed Assets
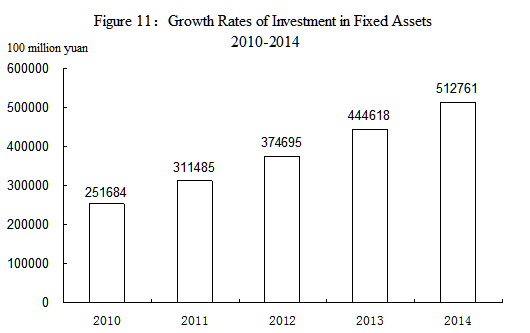
The growth of investment in fixed assets slowed down. The total investment in fixed assets of the country in 2014 was 51,276.1 billion yuan, up by 15.3 percent[16] over the previous year. The real growth was 14.7 percent after deducting the price factors. Of the total investment, the investment in fixed assets (excluding rural households) was 50,200.5 billon yuan, up by 15.7 percent; and the investment by rural households reached 1,075.6 billion yuan, up by 2.0 percent. The investment in eastern areas[17] was 20,645.4 billion yuan, up by 15.4 percent over the previous year, in central areas was 12,411.2 billion yuan, a growth of 17.6 percent, in western areas 12,917.1 billion yuan, a growth of 17.2 percent, and in northeastern areas 4,609.6 billion yuan, up by 2.7 percent.
In the investment in fixed assets (excluding rural households), the investment in the primary industry was 1,198.3 billion yuan, up by 33.9 percent; that in the secondary industry was 20,810.7 billion yuan, up by 13.2 percent; and that in the tertiary industry was 28,191.5 billion yuan, up by 16.8 percent. The private investment[18] in fixed assets was 32,157.6 billion yuan, an increase of 18.1 percent, accounting for 64.1 percent of the total investment in fixed assets (excluding rural households).
Table 4: Fixed Assets Investment (Excluding Rural Households) and Its Growth Rate by Sector in 2014
| Sector | Investment (100 million yuan) | Increase over 2013 (%) |
| Total | 502005 | 15.7 |
| Agriculture, Forestry, Animal Husbandry and Fishing | 14697 | 31.3 |
| Mining | 14681 | 0.7 |
| Manufacturing | 166918 | 13.5 |
| Production and Supply of Electricity, Heat, Gas and Water | 22916 | 17.1 |
| Construction | 4450 | 27.2 |
| Wholesale and Retail Trade | 15669 | 25.7 |
| Transport, Storage and Post | 42984 | 18.6 |
| Lodging and Catering Services | 6237 | 4.2 |
| Information Transmission, Computer Services and |
|
|
| Software | 4187 | 38.6 |
| Banking | 1360 | 10.5 |
| Real Estate[19] | 123690 | 11.1 |
| Leasing and Business Services | 7970 | 36.2 |
| Scientific Research and Technical Service | 4205 | 34.7 |
| Water Conservancy, Environment and Public Facilities Management | 46274 | 23.6 |
| Services to Households, Maintenance and Other Services | 2262 | 14.2 |
| Education | 6678 | 24.0 |
| Health and Social Work | 3983 | 27.6 |
| Culture, Sports and Entertainment | 6192 | 18.9 |
| Public Management, Social Security and Social Organization | 6652 | 13.6 |
Table 5: Newly Increased Production and Operation Capacity through Fixed Assets Investment in 2014
| Item | Unit | Volume |
| Newly increased power transformer equipment with a capacity of over 220 kilovolts | 10000 kilovolt-amperes | 22394 |
| New railways put into operation | kilometer | 8427 |
| Of which, high-speed railways[20] | kilometer | 5491 |
| Extended or new double-track railways put into operation | kilometer | 7892 |
| Electrified railways put into operation | kilometer | 8653 |
| New highways | kilometer | 65260 |
| Of which: Expressways | kilometer | 7394 |
| New cargo-handling capacity of berths for over 10,000-tonnage ships | 10000 tons | 43553 |
| New civil transportation airports | - | 9 |
| New lines of optical-fiber cables | 10000 km | 301 |
In 2014, the investment in real estate development was 9,503.6 billion yuan, up by 10.5 percent. Of this total, the investment in residential buildings reached 6,435.2 billion yuan, an increase of 9.2 percent, that in office buildings was 564.1 billion yuan, up by 21.3 percent, and that in buildings for commercial business was 1,434.6 billion yuan, up by 20.1 percent.
In 2014, 5.11 million apartments under the national urban affordable housing projects were completed and 7.40 million units were newly started.
Table 6: Main Indicators for Real Estate Development and Sales and Its Growth Rate in 2014
| Item | Unit | Volume | Increase over 2013 (%) |
| Value of Investment | 100 million RMB | 95036 | 10.5 |
| Of which: residential buildings | 100 million RMB | 64352 | 9.2 |
| Of which: 90 square meters and below | 100 million RMB | 20335 | 4.6 |
| Floor space of houses under construction | 10,000 square meters | 726482 | 9.2 |
| Of which: residential buildings | 10,000 square meters | 515096 | 5.9 |
| Floor space of houses newly started | 10,000 square meters | 179592 | -10.7 |
| Of which: residential buildings | 10,000 square meters | 124877 | -14.4 |
| Floor space of houses completed | 10,000 square meters | 107459 | 5.9 |
| Of which: residential buildings | 10,000 square meters | 80868 | 2.7 |
| Sales of commercial buildings | 10,000 square meters | 120649 | -7.6 |
| Of which: residential buildings | 10,000 square meters | 105182 | -9.1 |
| Sources of capital this year | 100 million RMB | 121991 | -0.1 |
| Of which: domestic loans | 100 million RMB | 21243 | 8.0 |
| individual mortgage | 100 million RMB | 13665 | -2.6 |
V. Domestic Trade
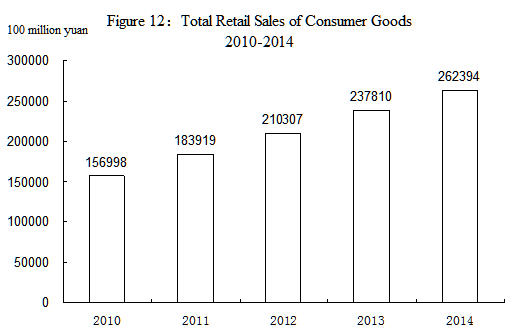
The domestic trade sustained stable growth. In 2014, the total retail sales of consumer goods[21] reached 26,239.4 billion yuan, a growth of 12.0 percent over the previous year, or a real growth of 10.9 percent after deducting price factors. An analysis on different areas showed that the retail sales of consumer goods in urban areas stood at 22,636.8 billion yuan, up by 11.8 percent, and that in rural areas reached 3,602.7 billion yuan, up by 12.9 percent. Grouped by consumption patterns, the retail sales of commodities was 23,453.4 billion yuan, up by 12.2 percent, and that of catering industry was 2,786.0 billion yuan, up by 9.7 percent.
Of the total retail sales of commodities by enterprises above designated size, the year-on-year growth of sales for grain, oil, food, beverage, tobacco and liquor was 11.1 percent, that for clothes, shoes, hats and textiles 10.9 percent, for cosmetics 10.0 percent. The retail sales of gold, silver and jewelry maintained the same level as last year. The growth of daily necessities was 11.6 percent, household appliances and audio-video equipments 9.1 percent, for traditional Chinese and western medicines 15.0 percent, for cultural and office appliances 11.6 percent, for furniture 13.9 percent, for telecommunication equipments 32.7 percent, for petroleum and petroleum products 6.6 percent, for building and decoration materials 13.9 percent and for motor vehicles 7.7 percent.
The online retail sales[22] were 2,789.8 billion yuan in 2014, an increase of 49.7 percent compared with last year. The online retail sales of enterprises above designated size were 440.0 billion yuan, an increase of 56.2 percent.
VI. Foreign Economic Relations[23]
The total value of imports and exports of goods in 2014 reached 26,433.4 billion yuan, up by 2.3 percent over the previous year. Of this total, the value of goods exported was 14,391.2 billion yuan, increased by 4.9 percent, and the value of goods imported was 12,042.3 billion yuan, down by 0.6 percent. The balance of imports and exports (exports minus imports) was 2,348.9 billion yuan, an increase of 739.5 billion yuan over the previous year.
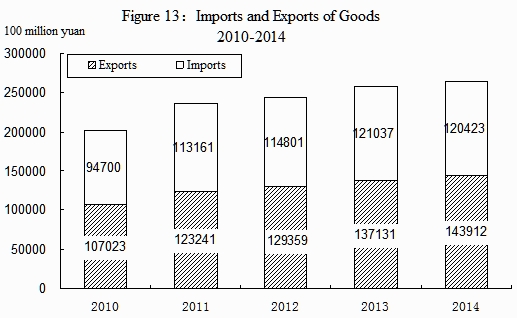
Table 7: Total Value of Import and Export of Goods and the Growth Rates in 2014
| Item | Value (100 million yuan) | Increase over 2013 (%) |
| Total import and export of goods | 264334 | 2.3 |
| Exports | 143912 | 4.9 |
| Of which: General trade | 73944 | 9.6 |
| Processing trade | 54320 | 1.8 |
| Of which: Mechanical and electronic products | 80527 | 2.6 |
| High & new technology products | 40570 | -1.0 |
| Imports | 120423 | -0.6 |
| Of which: General trade | 68162 | -1.0 |
| Processing trade | 32211 | 4.5 |
| Of which: Mechanical and electronic products | 52509 | 0.7 |
| High & new technology products | 33876 | -2.2 |
| Trade surplus (exports minus imports) | 23489 | — |
Table 8: Main Export Commodities in Volume and Value and the Growth Rates in 2014
| Item | Unit | Volume | Increase over 2013 (%) | Value (100 million yuan) | Increase over 2013 (%) |
| Coal (including lignite) | 10000 tons | 574 | -23.5 | 43 | -35.5 |
| Rolled steel | 10000 tons | 9378 | 50.5 | 4350 | 31.6 |
| Textile yarns and textile articles | ---- | — | — | 6888 | 3.8 |
| Clothes and clothing accessories | ---- | — | — | 11445 | 4.2 |
| Footwear | ---- | — | — | 3455 | 9.7 |
| Furniture and parts | ---- | — | — | 3195 | -0.7 |
| Automatic data processing machines and components | 10000 sets | 191836 | 2.6 | 11159 | -1.3 |
| Handheld mobiles and car telephones | 10000 sets | 131199 | 10.6 | 7085 | 20.2 |
| Containers | 10000 units | 302 | 12.1 | 553 | 13.0 |
| Liquid crystal display panels | 10000 units | 245080 | -25.0 | 1952 | -12.4 |
| Motor vehicles | 10000 sets | 90 | -2.8 | 770 | 3.5 |
Table 9: Main Import Commodities in Volume and Value and the Growth Rates in 2014
| Item | Volume (10000 tons) | Increase over 2013 (%) | Value (100 million yuan) | Increase over 2013 (%) |
| Cereals and cereal flour | 1951 | 33.8 | 382 | 20.7 |
| Soybean | 7140 | 12.7 | 2474 | 5.0 |
| Edible vegetable oil | 650 | -19.7 | 364 | -27.3 |
| Iron ore and concentrate | 93251 | 13.8 | 5748 | -12.8 |
| Aluminum oxide | 528 | 37.7 | 118 | 35.5 |
| Coal (including lignite) | 29122 | -10.9 | 1366 | -24.4 |
| Crude oil | 30838 | 9.5 | 14017 | 2.8 |
| Petroleum products refined | 3000 | -24.2 | 1439 | -27.7 |
| Plastics in primary forms | 2535 | 3.0 | 3167 | 4.0 |
| Paper pulp | 1796 | 6.6 | 741 | 4.9 |
| Rolled steel | 1443 | 2.5 | 1101 | 4.0 |
| Copper and copper alloys | 483 | 7.4 | 2188 | 0.8 |
Table 10: Imports and Exports by Major Countries and Regions and the Growth Rates in 2014
| Country or region | Exports (100 million yuan) | Increase over 2013 (%) | Imports (100 million yuan) | Increase over 2013 (%) |
| European Union | 22787 | 8.3 | 15031 | 9.7 |
| United States | 24328 | 6.4 | 9764 | 3.1 |
| ASEAN | 16712 | 10.3 | 12794 | 3.3 |
| Hong Kong, China | 22307 | -6.6 | 792 | -21.5 |
| Japan | 9187 | -1.4 | 10027 | -0.5 |
| Republic of Korea | 6162 | 8.9 | 11677 | 2.8 |
| Taiwan, China | 2843 | 12.7 | 9337 | -3.9 |
| Russia | 3297 | 7.2 | 2555 | 3.7 |
| India | 3331 | 10.7 | 1005 | -4.6 |
The total value of imports and exports of services[24] in 2014 was 604.3 billion US dollars, up by 12.6 percent. The export value of services was 222.2 billion US dollars, up by 7.6 percent. The import value of services was 382.1 billion US dollars, up by 15.8 percent. The deficit of exports minus imports of services was 159.9 billion US dollars.
The year 2014 witnessed the establishment of 23,778 enterprises with foreign direct investment in non-financial sectors, up by 4.4 percent over the previous year; and the foreign capital actually utilized was 736.4 billion yuan, or 119.6 billion US dollars, up by 1.7 percent.
Table 11: Total Value of Foreign Direct Investment in Non-financial Sectors and the Growth Rates in 2014
| Sector | Enterprises | Increase over 2013 (%) | Actually Utilized Value (100 million USD) | Increase over 2013 (%) |
| Total | 23778 | 4.4 | 1195.6 | 1.7 |
| Of which: Agriculture, Forestry, Animal Husbandry and Fishing | 719 | -5.0 | 15.2 | -15.4 |
| Manufacturing | 5178 | -20.4 | 399.4 | -12.3 |
| Production and Supply of Electricity, Gas and Water | 208 | 4.0 | 22.0 | -9.3 |
| Transport, Storage, Post and Telecommunication Services | 376 | -6.2 | 44.6 | 5.7 |
| Information Transmission, Computer Services and Software | 981 | 23.2 | 27.6 | -4.4 |
| Wholesales & Retail Trade | 7978 | 8.6 | 94.6 | -17.8 |
| Real Estate | 446 | -15.9 | 346.3 | 20.2 |
| Leasing and Business Services | 3963 | 18.0 | 124.9 | 20.5 |
| Services to Households and Other Services | 181 | 9.0 | 7.2 | 9.3 |
In 2014, the overseas direct investment (non-financial sectors) by Chinese investors was 632.1 billion yuan, or 102.9 billion US dollars, up by 14.1 percent over the previous year.
Table 12: Total Value of Overseas Direct Investment in Non-financial Sectors and the Growth Rates in 2014
| Sector | Overseas Direct Investment (100 million US dollars) | Increase over 2013 (%) |
| Total | 1028.9 | 14.1 |
| Of which: Agriculture, Forestry, Animal Husbandry and Fishing | 17.4 | 19.2 |
| Mining | 193.3 | -4.1 |
| Manufacturing | 69.6 | -19.8 |
| Production and Supply of Electricity, Gas and Water | 18.4 | 36.3 |
| Construction | 70.2 | 7.5 |
| Wholesale and Retail Sales | 172.7 | 26.3 |
| Transport, Storage, Post and Telecommunication Services | 29.3 | 17.2 |
| Information Transmission, Computer Services and Software | 17.0 | 100.0 |
| Real Estate | 30.9 | 45.8 |
| Leasing and Business Services | 372.5 | 26.5 |
In 2014, the accomplished business revenue through contracted overseas engineering projects was 874.8 billion yuan, or 142.4 billion US dollars, up by 3.8 percent, and the number of labor forces sent abroad through overseas labor contracts was 562 thousand, an increase of 6.6 percent.
VII. Transportation, Post, Telecommunications and Tourism
Transportation grew at a steady pace. The total freight traffic reached 43.9 billion tons, up by 7.1 percent over the previous year, and the freight flows were 18,461.9 billion ton-kilometers, grew by 9.9 percent. The volume of freight handled by ports above the designated size throughout the year totaled 11.16 billion tons, up 4.8 percent over the previous year, of which freight for foreign trade was 3.52 billion tons, up 5.9 percent. Container shipping of ports above the designated size reached 200.93 million standard containers, up by 6.1 percent.
Table 13: Freight Traffic by All Means of Transportation and the Growth Rates In 2014
| Item | Unit | Volume | Increase over 2013 (%) |
| Total freight traffic | 100 million tons | 439.1 | 7.1 |
| Railways | 100 million tons | 38.1 | -3.9 |
| Highways | 100 million tons | 334.3 | 8.7 |
| Waterways | 100 million tons | 59.6 | 6.4 |
| Civil aviation | 10 000 tons | 593.3 | 5.7 |
| Pipelines | 100 million tons | 6.9 | 5.2 |
| Freight flows | 100 million ton-kilometers | 184619.2 | 9.9 |
| Railways | 100 million ton-kilometers | 27530.2 | -5.6 |
| Highways | 100 million ton-kilometers | 61139.1 | 9.7 |
| Waterways | 100 million ton-kilometers | 91881.1 | 15.7 |
| Civil aviation | 100 million ton-kilometers | 186.1 | 9.3 |
| Pipelines | 100 million ton-kilometers | 3882.7 | 10.9 |
In 2014, the total passenger traffic reached 22.1 billion persons, up by 3.9 percent over 2013, and the passenger flows were 2,999.4 billion person-kilometers, grew by 8.8 percent.
Table 14: Passenger Traffic by All Means of Transportation and the Growth Rates in 2014
| Item | Unit | Volume | Increase over 2013 (%) |
| Total passenger traffic | 100 million persons | 220.7 | 3.9 |
| Railways | 100 million persons | 23.6 | 11.9 |
| Highways | 100 million persons | 190.5 | 2.8 |
| Waterways | 100 million persons | 2.6 | 12.3 |
| Civil aviation | 100 million persons | 3.9 | 10.6 |
| Passenger flows | 100 million person-kilometers | 29994.2 | 8.8 |
| Railways | 100 million person-kilometers | 11604.8 | 9.5 |
| Highways | 100 million person-kilometers | 11981.7 | 6.5 |
| Waterways | 100 million person-kilometers | 74.4 | 8.9 |
| Civil aviation | 100 million person-kilometers | 6333.3 | 12.0 |
The total number of motor vehicles for civilian use reached 154.47 million (including 9.72 million tri-wheel motor vehicles and low-speed trucks) by the end of 2014, up 12.4 percent, of which private-owned vehicles numbered 125.84 million, up 15.5 percent. The total number of cars for civilian use stood at 83.07 million, up 16.6 percent, of which private-owned cars numbered 75.90 million, up by 18.4 percent.
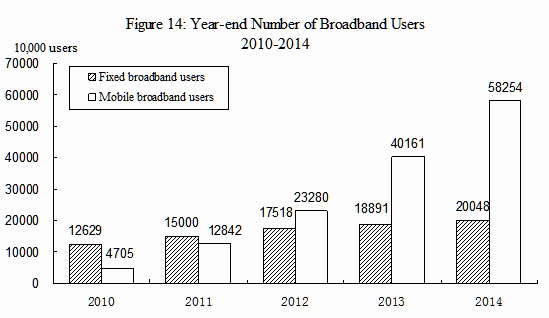
Post and telecommunication services grew fast. The turnover of post and telecommunication services[25] totaled 2,184.6 billion yuan, up 19.0 percent over the previous year. Of this total, post services amounted 369.6 billion yuan, up 35.6 percent, and telecommunication services 1,815.0 billion yuan, up 16.1 percent. In post services, the number of mail delivery reached 5.61 billion, parcel delivery 60 million and express delivery 13.96 billion. The revenue from express delivery reached 204.5 billion yuan. In telecommunication services, the newly increased capacity of mobile phone switchboard[26] was 79.80 million lines with the total capacity reaching 2,045.37 million lines. By the end of 2014, there were 1,535.52 million phone subscribers in China, of which 249.43 million were fixed telephone subscribers and 1,286.09 million were mobile phone users. Fixed telephone coverage went down to 18.3 sets per 100 persons, while mobile phone coverage rose to 94.5 sets per 100 persons. The number of fixed broadband users[27] reached 200.48 million, increased by 11.57 million over the previous year; while that of the mobile broadband users[28] was 582.54 million, an increase of 180.93 million. The number of Internet users was 649 million, grew by 31.17 million. Of the total, 557 million were mobile Internet surfers[29], an increase of 56.72 million. The coverage of Internet was 47.9 percent.
The year 2014 registered 3.61 billion domestic tourists, up 10.7 percent over the previous year. The revenue from domestic tourism totaled 3,031.2 billion yuan, up 15.4 percent. The number of inbound visitors to China totaled 128.49 million, a decrease of 0.5 percent. Of this total, 26.36 million were foreigners, up 0.3 percent; and 102.13 million were Chinese compatriots from Hong Kong, Macao and Taiwan, down by 0.6 percent. Of all the inbound tourists, overnight visitors counted 55.62 million, almost the same as that in the previous year. Foreign exchange earnings from international tourism topped 56.9 billion US dollars, up 10.2 percent. The number of China’s outbound visitors totaled 116.59 million, up 18.7 percent. Of this total, 110.03 million were on private visits, a year-on-year rise of 19.6 percent.
VIII. Financial Intermediation
The performance of the financial market was generally stable. By the end of 2014, money supply of broad sense (M2) was 122.8 trillion yuan, reflecting an increase of 12.2 percent. Money supply of narrow sense (M1) was 34.8 trillion yuan, up 3.2 percent. Cash in circulation (M0) was 6.0 trillion yuan, up 2.9 percent.
In 2014, the total social financing[30] reached 16.5 trillion yuan, decreased by 859.8 billion yuan over 2013 on a comparable basis. Savings deposit in Renminbi and foreign currencies in all items of financial institutions totaled 117.4 trillion yuan at the end of 2014, an increase of 10.2 trillion yuan. Of this total, the savings deposit in Renminbi stood at 113.9 trillion yuan, an increase of 9.5 trillion yuan. Loans in Renminbi and foreign currencies in all items of financial institutions reached 86.8 trillion yuan, an increase of 10.2 trillion yuan. Of this total, loans in Renminbi were 81.7 trillion yuan, an increase of 9.8 trillion yuan.
Table 15: Savings Deposit and Loans in RMB and Foreign Currencies in All Financial Institutions and the Growth Rates at the End of 2014
| Item | Year-end figure (100 million yuan) | Increase over 2013 (%) |
| Savings deposit | 1173735 | 9.6 |
| By households | 506890 | 8.9 |
| Deposits in RMB | 502504 | 8.9 |
| By non-financial enterprises | 400420 | 5.4 |
| Loans | 867868 | 13.3 |
| Domestic short-term loans | 336371 | 7.9 |
| Domestic medium and long-term loans | 471818 | 15.0 |
Loans in Renminbi from rural financial institutions (rural credit cooperatives, rural cooperation banks and rural commercial banks) totaled 10,574.2 billion yuan by the end of 2014, an increase of 1,410.5 billion yuan as compared with the beginning of the year. The loans in Renminbi for consumption use from all financial institutions totaled 15,366.0 billion yuan, an increase of 2,393.8 billion yuan. Of all consumption loans, short-term loans for individuals totaled 3,249.1 billion yuan, an increase of 590.2 billion yuan, and medium- and long-term loans for individuals reached 12,116.9 billion yuan, an increase of 1,803.7 billion yuan.
Funds raised in 2014 by enterprises through issuing stocks and share rights on stock market amounted to 839.7 billion yuan, an increase of 151.2 billion yuan from the previous year. Of this total, 125 A-shares were issued, receiving 66.9 billion yuan worth of capital altogether. The refinancing of A-shares (including rationing shares, public newly issued, nonpublic newly issued[31] and warrants) received 416.5 billion yuan worth of capital, an increase of 136.2 billion yuan from 2013. The listed companies financed 356.3 billion yuan through convertible bonds, bonds with attached warrants, corporate bonds and SME private placement bonds, a decrease of 51.9 billion yuan. A total of 51 growth enterprise board stocks were issued, receiving 15.9 billion yuan.
In 2014, 5.15 trillion yuan corporate debenture bonds[32] were issued, an increase of 1.48 trillion yuan over the previous year.
The premium[33] received by the insurance companies totaled 2,023.5 billion yuan in 2014, up 17.5 percent over the previous year. Of this total, life insurance premium amounted to 1,090.2 billion yuan, health and casualty insurance premium 213.0 billion yuan, and property insurance premium 720.3 billion yuan. Insurance companies paid an indemnity worth of 721.6 billion yuan, of which, life insurance indemnity was 272.8 billion yuan, health and casualty insurance indemnity 70.0 billion yuan, and property insurance indemnity 378.8 billion yuan.
IX. Living Conditions and Social Security
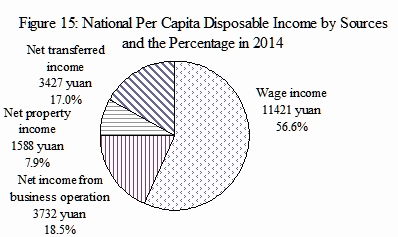
The income of urban and rural residents continued to rise. In 2014, the national per capita disposable income was 20,167 yuan, an increase of 10.1 percent or a real increase of 8.0 percent after deducting price factors. In terms of permanent residence, the per capita disposable income of urban households[34] was 28,844 yuan, up by 9.0 percent, or a real growth of 6.8 percent after deducting price factors. The median[35] of per capita disposable income of urban households was 26,635 yuan, up by 10.3 percent. The per capita disposable income of rural residents was 10,489 yuan, up by 11.2 percent, or 9.2 percent in real terms. The median of per capita disposable income of rural residents was 9,497 yuan, up by 12.7 percent. In 2014, the annual per capita net income of rural residents was 9,892 yuan. The national per capita consumption expenditure was 14,491 yuan, up by 9.6 percent, or a real growth of 7.5 percent after deducting price factors. In terms of permanent residence, the per capita consumption expenditure of urban households was 19,968 yuan, up by 8.0 percent, or 5.8 percent in real terms. The per capita consumption expenditure of rural residents was 8,383 yuan, up by 12.0 percent, or a real growth of 10.0 percent after deducting price factors.
Social security made new progress. By the end of 2014, a total of 341.15 million people participated in urban basic pension program for staff and workers, a year-on-year increase of 18.97 million. A total of 501.07 million people participated in basic pension insurance program for urban and rural residents, an increase of 3.57 million. A total of 597.74 million people participated in basic health insurance program, an increase of 27.02 million, of whom, 283.25 million people participated in basic health insurance program for staff and workers, a year-on-year increase of 8.82 million, and 314.49 million people participated in programs for residents, an increase of 18.20 million. Some 170.43 million people participated in unemployment insurance programs, an increase of 6.26 million. The number of people receiving unemployment insurance payment stood at 2.07 million. A total of 206.21 million people participated in work accident insurance, an increase of 7.03 million, of whom 73.62 million were migrant workers, an increase of 0.98 million. A total of 170.35 million people participated in maternity insurance programs, an increase of 6.43 million. According to the rural poverty line of annual per capita income of 2,300 yuan (at 2010 constant prices), the population in poverty in rural areas numbered 70.17 million in 2014, or 12.32 million less than that in 2013.
X. Education, Science & Technology and Culture & Sports
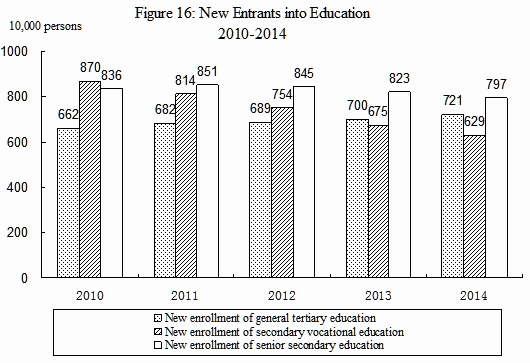
The education, science & technology and culture & sports undertakings developed at a rapid pace. In 2014, the post-graduate education enrollment was 1.848 million students with 621 thousand new students and 536 thousand graduates. The general tertiary education enrollment was 25.477 million students with 7.214 million new students and 6.594 million graduates. Vocational secondary schools[36] had 18.029 million enrolled students, including 6.289 million new entrants, and 6.330 million graduates. Senior secondary schools had 24.005 million enrolled students, including 7.966 million new entrants, and 7.996 million graduates. Students enrolled in junior secondary schools totaled 43.846 million, including 14.478 million new entrants, and 14.135 million graduates. The country had a primary education enrollment of 94.511 million students, including 16.584 million new entrants, and 14.766 million graduates. There were 395 thousand students enrolled in special education schools, with 71 thousand new entrants and 49 thousand graduates. Kindergartens accommodated 40.507 million children.
Expenditures on research and development activities (R&D) was worth 1,331.2 billion yuan in 2014, up 12.4 percent over 2013, accounting for 2.09 percent of GDP. Of this total, 62.6 billion yuan was appropriated for fundamental research programs. A total number of 3,997 projects under the National Key Technology Research and Development Program and 2,129 projects under the Hi-tech Research and Development Program (the 863 Program) were implemented. By the end of 2014, there were altogether 132 national engineering research centers and 154 national engineering laboratories. The number of state validated enterprise technical centers reached 1,098. Accumulatively, 213 venture investment enterprises were established under the support of State Venture Capital Investment Plans[37] for Emerging Industries, with a total fund size approaching 57.4 billion yuan, and an investment to 739 venture businesses. Some 2,361 thousand patent applications were accepted from home and abroad, and a total of 1,303 thousand patents were authorized. Till the end of year 2014, the number of patents in force was 4.643 million. A total of 297 thousand technology transfer contracts were signed, representing 857.7 billion yuan in value, up 14.8 percent over the previous year.
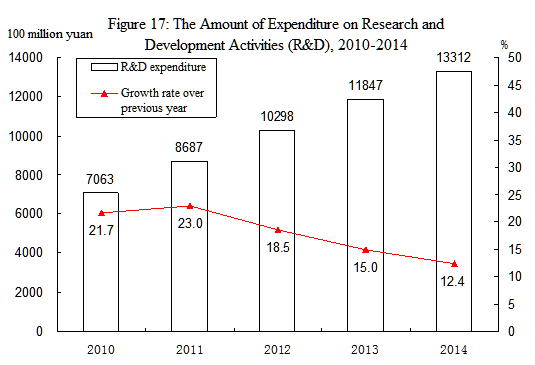
Table16: Number of Patents Application Accepted, Patents Authorized and Patents in Force in 2014
| Item | Patents (10,000) | Increase over 2013 (%) |
| Number of patent applications accepted | 236.1 | -0.7 |
| Of which: domestic | 218.6 | -1.0 |
| Of which: for new inventions | 92.8 | 12.5 |
| Of which: domestic | 79.0 | 13.9 |
| Number of patents authorized | 130.3 | -0.8 |
| Of which: domestic | 119.2 | -1.5 |
| Of which: for new inventions | 23.3 | 12.3 |
| Of which: domestic | 15.8 | 14.1 |
| Number of patents in force at the end of the year | 464.3 | 10.7 |
| Of which: domestic | 391.8 | 11.1 |
| Of which: for new inventions | 119.6 | 15.7 |
| Of which: domestic | 66.3 | 21.7 |
The year 2014 saw 16 times of successful launch of satellites. The reentry test of the third phase of lunar exploration project was completed successfully. Gaofen-2 satellite had a successful launch.
By the end of 2014, there were altogether 27,051 laboratories for product inspection, including 597 national inspection centers. There were 183 agencies for product quality and management system certification, which accumulatively certified products in 118,354 enterprises. There were 4,056 authorized measurement institutions in the year, enforcing compulsory inspection on 61.62 million measurement instruments. A total of 1,530 national standards were developed or revised in the year, including 1,067 new standards. There were 1,687 seismological monitor stations and 32 regional seismological monitor network stations. The number of oceanic observation stations was 79. Mapping and geographic information departments published 1,678 maps.
At the end of 2014, there were 2,008 art-performing groups and 2,760 museums in the cultural system throughout China. A total of 3,110 public libraries received[38] 522.52 million people. There were 3,311 culture centers. Subscribers to cable television programs and digital cable television programs numbered 231 million and 187 million respectively. Radio broadcasting and television broadcasting coverage rates were 98.0 percent and 98.6 percent respectively. Totally 15,983 episodes of 429 TV series and 138,496 minutes of TV cartoons were made in 2014. The country produced 618 feature movies and 140 science, educational, documentary, cartoon and special movies[39]. A total of 46.5 billion copies of newspapers and 3.2 billion copies of magazines were issued, and 8.4 billion copies of books were published. The average number of books possessed per person[40] was 6.12 copies. By the end of the year, there were 4,246 archives in China and 128.35 million documents were made accessible to the public.
According to the Sixth National Sports Fields Census[41], there were 1,695,000 sports fields in China covering 1.99 billion square meters of space[42]. In 2014, Chinese athletes won 98 world championships on 22 sports events and broke 10 world records. Chinese physically-challenged athletes won 122 world championships in 19 international sports competitions.
XI. Public Health and Social Services
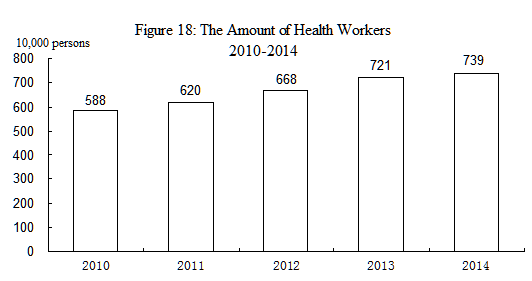
The public health and social services continued to make progress. By the end of 2014, there were 982,443 medical and health institutions in China, including 25,865 hospitals, 36,899 township health centers, 34,264 community health service centers, 188,415 clinics, 646,044 village clinics, 3,491 epidemic disease prevention centers and 2,975 health monitoring institutions. There were 7.39 million health workers in China, including 2.82 million practicing doctors and assistant practicing doctors and 2.92 million registered nurses. The medical and health institutions in China possessed 6.52 million beds, of which, hospitals possessed 4.84 million and township health centers had 1.17 million.
By the end of 2014, there were altogether 38 thousand social welfare institutions[43] of various types, of which 34 thousand were elder-caring organizations. The social welfare institutions provided 5.865 million beds[44], and 5.514 million of them were for old-age caring. A total of 3.046 million inmates were accommodated, of which 2.887 million were for old-age caring. There were 22 thousand community service centers and 114 thousand community service stations. Minimum living allowances were granted to 18.802 million urban residents and 52.090 million rural residents, and 5.295 million rural residents received five-guarantees supporting[45]. Another 13.109 million needy people in urban areas were financed to participate in urban medical insurance system, and 41.189 million needy people in rural areas were financed to participate in new rural cooperative medical care system.
XII. Resources, Environment and Work Safety
In 2014, the total supply of state-owned land for construction use[46] was 610 thousand hectares, a decrease of 16.5 percent over the previous year. Of this total, the supply for mining storage was 150 thousand hectares, down by 29.9 percent; that for real estate[47] was 150 thousand hectares, down by 25.5 percent; and that for infrastructure facilities was 310 thousand hectares, down by 1.9 percent.
The total stock of water resources in 2014 was 2,837.0 billion cubic meters. The annual average precipitation was 648 millimeters. At the end of 2014, the 609 large reservoirs covered by monitoring program in China stored 366.3 billion cubic meters of water, up by 7.0 percent. With an increase of 0.6 percent over 2013, the total water consumption reached 622.0 billion cubic meters, of which water consumption for living purposes rose by 2.7 percent, for industrial use increased by 1.0 percent, for agricultural use up by 0.1 percent, and for ecological water supplement grew by 0.6 percent. Water consumption for every 10 thousand yuan worth of GDP produced[48] was 112 cubic meters, a decline of 6.3 percent over the previous year. Water consumption for every 10 thousand yuan worth of industrial value added was 64 cubic meters, down by 5.6 percent. Per capita water consumption was 456 cubic meters, up by 0.1 percent.
In 2014, a total of 6.03 million hectares of forests were planted, of which 4.27 million hectares were afforested by manpower. Some 2.00 million hectares were afforested through key afforestation projects, accounting for 33.2 percent of the total planted area of the year. By the end of 2014, there were 2,729 natural reserves including 428 national ones. A total of 54 thousand square kilometers of eroded land was put under treatment programs, and 20 thousand square kilometers of land was closed for nurture and protection in areas suffering water and soil erosion.
The average temperature in 2014 was 10.1 centigrade. Typhoon hit China 5 times in 2014.
Preliminary estimation indicated that the total energy consumption in 2014 amounted to 4.26 billion tons of standard coal equivalent, up 2.2 percent over 2013. The consumption of coal declined by 2.9 percent; crude oil, up 5.9 percent; natural gas, up 8.6 percent; and electric power, up 3.8 percent. The consumption of coal accounted for 66.0 percent of the total energy consumption, while clean energy consumption, such as hydropower, wind power, nuclear power and natural gas, accounted for 16.9 percent. The national energy consumption per 10,000 yuan worth of GDP went down by 4.8 percent. The comprehensive energy consumption per ton crude copper of industrial enterprises went down by 3.76 percent year-on-year, that of per ton steel declined by 1.65 percent, per unit caustic soda, down by 2.33 percent, and per ton cement, down by 1.12 percent. The standard coal consumption per kilowatt-hour of thermal power generation reduced by 0.67 percent.
Monitoring of water quality on 702 sections of the 10 major river basins[49] in China showed that 71.2 percent of the sections met the national quality standard from Grade I to Grade III for surface water; and 9.0 percent were worse than Grade V. Generally, the water quality in the 10 major basins maintained stable with slight pollution.
Monitoring of oceanic water quality at 301 offshore monitoring stations indicated that oceanic water met the national quality standard Grade I and II in 66.8 percent of the stations; water quality at 7.0 percent of the stations met Grade III standard; and water of Grade IV or inferior quality was found at 26.2 percent of the stations.
Of the 161 cities monitored under the Ambient Air Quality Standards (GB3095-2012), 9.9 percent reached the standards, and 90.1 percent failed.
Of the 319 cities subject to noise monitoring program, 1.3 percent enjoyed fairly good environment, 70.8 percent had good environment, 27.3 percent had fair environment and 0.6 percent had poor environment in downtown areas.
At the end of 2014, the daily treatment capacity of city sewage reached 128.96 million cubic meters, up 3.5 percent over that at the end of 2013. City sewage treatment rate was 90.2 percent, up 0.8 percentage point. The floor space with central heating systems in urban area amounted to 5.91 billion square meters, up 3.3 percent. Greenery coverage reached 35.9 percent of the urban area, up 0.2 percentage point.
In 2014, natural disasters hit 24.89 million hectares of crops, of which 3.09 million hectares of crops were demolished. Flood and waterlog caused a direct economic loss of 103.0 billion yuan. Drought caused a direct economic loss of 83.6 billion yuan. Disasters from low temperature, frost and snow made a total direct economic loss of 12.9 billion yuan. Oceanic disasters caused a direct economic loss of 13.6 billion yuan. The country recorded 30 earthquakes with magnitude 5 and over, 10 of which caused disasters, causing a direct economic loss of 35.6 billion yuan. The year 2014 witnessed 3,703 forest fires, with 19 thousand hectares of forests damaged.
The death toll due to work accidents amounted to 68,061 people. The death toll from work accidents for every 100 million yuan worth of GDP was 0.107 people, a decline of 13.7 percent. Work accidents in industrial, mining and commercial enterprises caused 1.328 deaths out of every 100 thousand employees, down 12.9 percent. The road traffic death toll per 10 thousand vehicles was 2.22 persons, down 5.1 percent. The death toll for one million tons of coal produced in coalmines was 0.255 person, down 11.5 percent.
In case of any discrepancy between English translation and the original Chinese text, the Chinese edition shall prevail.
Note:
[1] All figures in this Communiqué are preliminary statistics. Statistics in this Communiqué do not include Hong Kong SAR, Macao SAR and Taiwan Province. Due to the rounding-off reasons, the subentries may not add up to the aggregate totals.
[2] Population who live in places other than their household registration refers to those whose current residences are different from the registered towns or streets from which they have been away for more than half a year.
[3] Floating population refers to the population who live in places other than their household registration, excluding those with current residence different from the place of their household registration in the same city. Population who live in places other than their household registration in the same city refer to those whose current residence are different from the registered towns or streets but in the same district or in different districts but in the same municipality or prefecture-level city.
[4] By the end of 2014, the population between 0 to 14 (including people not yet reaching the age of 15) were 225.58 million and that between 15 to 59 (including people not yet reaching the age of 60) were 929.82 million.
[5] Gross domestic product (GDP) and value added as quoted in this Communiqué are calculated at current prices whereas their growth rates are at constant prices. The data have been revised according to the results of the Third National Economic Census and Classification for Three National Economic Sectors developed by the National Bureau of Statistics in 2012.
[6] The number of migrant workers includes those who are employed outside their villages and towns for more than six months in the year and those who do non-agricultural work in their villages and towns for more than six months in the year.
[7] The overall labor productivity refers to the ratio between the GDP (at 2010 constant price) and the total number of persons employed.
[8] The producer prices for farm products refer to the prices of farm products sold directly by producers.
[9] The housing prices include prices for construction and decoration, rent, owner-occupied housing, water, electricity and fuel etc.
[10] High technology manufacturing industry includes manufacture of medicine, manufacture of aerospace vehicle and equipment, electronic and communication equipment, manufacture of computer and office equipment, manufacture of medical equipment, manufacture of measuring instrument and equipment and manufacture of photographic equipment.
[11] Manufacturing of equipment include manufacturing of metal products, general purpose equipment, special purpose equipment, motor vehicle, railway, ship, aerospace and other transport equipment, electrical machinery and apparatus, computer, communication and other electric equipment and measuring instrument and machinery as well as repair services of metal products, machinery and equipment.
[12] The data have been revised based on the results of the Third National Economic Census. The output of coal in 2013 has been revised from 3.68 billion tons to 3.97 billion tons.
[13] Natural gas includes natural gas from gas fields, natural gas from oil fields (gas from oil fields gas zones and dissolved gas associated with oil fields) and natural gas from coal mines (also called coal bed gas).
[14] The data include 334.00 million tons of steel which has been reprocessed among enterprises.
[15] A few installed power generation capacity was not listed (e.g. geothermal).
[16] The data for the investment in fixed assets in 2013 were revised based on the results of the third national economic census.
[17] The national total of fixed assets investment is larger than the aggregate sum by adding up the subtotals of fixed assets investment in the eastern areas, central areas, western areas and northeast areas due to the fact that some of the trans-regional investments are not covered by regional figures. The eastern areas include 10 provinces and municipalities: Beijing, Tianjin, Hebei, Shanghai, Jiangsu, Zhejiang, Fujian, Shandong, Guangdong and Hainan; central areas cover 6 provinces: Shanxi, Anhui, Jiangxi, Henan, Hubei and Hunan; western areas include 12 provinces, autonomous regions and municipality: Inner Mongolia, Guangxi, Chongqing, Sichuan, Guizhou, Yunnan, Tibet, Shaanxi, Gansu, Qinghai, Ningxia and Xinjiang; northeastern areas include 3 provinces: Liaoning, Jilin and Heilongjiang.
[18] Private investment in fixed assets refers to investment in the construction or purchase of fixed assets by domestic collective, private, individual-owned enterprises or organizations or their holding enterprises (including absolute and relative controlling).
[19] The investment in real estate includes the investment made in real estate development, construction of buildings for own use, property management, intermediary services and other real estate development.
[20] High-speed railways refer to railways with a highest operating speed reaching 200 km/h or above.
[21] The data for the total retail sales of consumer goods and other related data in 2014 were from annual reporting forms.
[22] Online retail sales refer to the retail sales of goods and services realized through internet trading platforms (including self-built websites and third-party platforms). The sales of services and a few other goods for production operation and resale are not covered by the total retail sales of consumer goods.
[23] According to related regulations, the trade of goods is calculated in RMB term. Trade of services, utilization of foreign investment, overseas investment and contracted overseas engineering projects are still in US dollar term because of technique issues.
[24] The imports and exports of services were calculated according to the sixth edition of Balance of Payments and International Investment Position Manual (BPM6) and did not cover government services and the growth rate was calculated on a comparable basis.
[25] The turnover of post and telecommunication services is calculated at constant prices of 2010.
[26] The capacity of mobile phone switchboard refers to the number of maximum concurrent users calculated by the mobile phone switchboard according to certain calling model and switchboard processing capacity.
[27] Fixed broadband users refer to those who make registration in the telecommunication enterprises and access the internet through xDSL, FTTx+LAN, FTTH/0 and other broadband access ways as well as dedicated lines at the end of the reporting period.
[28] Mobile broadband users refer to those who have records in the billing system and use 3G or 4G network resources at the end of the reporting period.
[29] The number of mobile Internet surfer refers to the number of Chinese residents aged 6 and above who connected to and surfed on the Internet via mobile phones in the past six months.
[30] Social financing refers to the total funds raised by real economy from the financial system over a period of time. It is an increment.
[31] Non-public new issue or targeted placement excludes assets subscription.
[32] Corporate debenture bonds include debt financing instruments of non-financial businesses, enterprise bonds, corporate bonds and convertible bonds.
[33] The original premium income received by the insurance companies refers to the premium income from original insurance contracts confirmed by the insurance companies.
[34] The per capita disposable income of urban households was 29,381 yuan according to the old definitions of urban household surveys before the integrated survey of urban and rural households.
[35] The median of per capita income refers to the per capita income of household lied in the middle of all surveyed households which are ranked from low to high (or high to low) based on per capita income level.
[36] Vocational secondary schools include regular specialized secondary schools, adult specialized secondary schools, vocational high schools and skilled workers schools. The data concerning skilled workers schools come from that of 2013.
[37] State venture capital investment plan for emerging industries refers to the activities in which the central government special funds, together with the local government funds and social funds set up venture investment enterprises, or invest in the venture businesses in the form of equity investment to foster or promote the development of emerging industries.
[38] The people received by the public libraries refer to the number of people who visit libraries and use library services in the year, including borrowing and reading books, consultation and attending readers’ programs.
[39] Special movies refers to those using different display modes in terms of projection techniques, equipment and program as compared with the ordinary cinemas, such as IMAX movies, 3D movies, 4D movies, multidimensional movies and full dome movies.
[40] The average number of books possessed per person refers to the average number of books published in the year that can be possessed per person in China.
[41] Data as of the end of 2013.
[42] Field space refers to the effective areas which can be used for training, competition and exercises. Apart from the playing area, it also includes necessary safety area, buffer area and barrier-free area.
[43] Based on the Third Economic Census, social welfare institutions and community service centers were reclassified and organized. Data in 2014 are adjusted accordingly.
[44] The beds provided by social welfare institutions include those provided by adoption agencies, aid agencies, community agencies, serviceman recreation habitation and military supply stations etc.
[45] Five-guarantees supporting in rural areas refers to villagers who are aged, disabled or under the age of 16 and have no ability to work, no source of income and no statutory obligors to provide for them, bring them up or support them, or whose statutory obligors have no ability to provide for them, bring them up or support them, shall enjoy life-care and physical care in terms of food, clothing, housing, medical care and funeral expenses.
[46] Total supply of state-owned land for construction use refers to the supply of state-owned land for construction use with the land-used right sold, allocated or leased to units or individuals by the municipal or county governments according to annual land supply plan and in line with relevant laws in the reporting period.
[47] Land used for real estate refers to the sum of land used for commercial service and for residence.
[48] The consumption of water and energy for producing 10 thousand yuan worth of GDP and water consumption for every 10 thousand yuan worth of industrial value added are calculated at 2010 constant prices.
[49] Ten major river basins include the Yangtze River, Yellow River, Pearl River, Songhua River, Huaihe River, Haihe River, Liaohe River, rivers in Zhejiang and Fujian Provinces, rivers in Northwest China and rivers in Southwest China.
Data Sources:
In this Communiqué, data of newly increased employed people, registered unemployment rate and social security in urban area are from the Ministry of Human Resources and Social Security; financial data are from the Ministry of Finance; data of foreign exchange reserves, exchange rate, monetary finance and corporate credit bonds are from the People’s Bank of China; data of output of aquatic products are from the Ministry of Agriculture; data of production of timber, forestry and forest fires are from the State Forestry Administration; data of areas with effective irrigation system and water resources are from the Ministry of Water Resources; data of newly increased power generating capacity and newly increased power transformer equipment with a capacity of over 220 kilovolts are from China Electricity Council; data of new railways put into operation, extended or new double-track railways put into operation, electrified railways put into cooperation and railway transportation are from China Railway Corporation; data of new highways, new cargo-handling capacity of berths for over 10000-tonnage ships, highway transportation, waterway transportation and volume of freight handled by ports are from the Ministry of Transport; data of new civil transportation airports and civil aviation are from Civil Aviation Administration of China; data of new lines of optical-fiber cables, new capacity of phone switchboards, the number of phone users, broadband users and internet users etc. are from the Ministry of Industry and Information Technology; data of affordable housing, treatment of city sewage, area with central heating systems and greenery coverage are from the Ministry of Housing and Urban-Rural Development; data of imports and exports of goods are from the General Administration of Customs; data of imports and exports of services, foreign direct investment, overseas direct investment, overseas contracted projects and overseas labor contracts are from the Ministry of Commerce; data of pipelines are from China National Petroleum Corporation, China Petrochemical Corporation and China National Offshore Oil Corporation; data of motor vehicles for civilian use and the road traffic death toll are from the Ministry of Public Security; Data of post services are from the State Post Bureau; data of tourism are from the National Tourism Administration and the Ministry of Public Security; data of listed companies are from the China Securities Regulatory Commission; data of insurances are from China Insurance Regulatory Commission; data of education are from the Ministry of Education; data of national technology research and development program and technology transfer contracts are from the Ministry of Science and Technology; data of national engineering research centers, enterprise technical centers and venture capital investment for boosting new emerging industries are from the National Development and Reform Commission; data of patents are from the State Intellectual Property Office; data of satellite launch are from the State Administration of Science, Technology and Industry for National Defense; data of quality inspection, development and revision of national standards are from the General Administration of Quality Supervision, Inspection and Quarantine; data of earthquakes are from the China Seismological Bureau; data of oceanic observation stations, direct economic loss caused by oceanic disasters are from the State Oceanic Administration; data of mapping are from the National Administration of Surveying, Mapping and Geoinformation; data of art-performing groups, museums, public libraries and culture centers are from the Ministry of Culture; data of radio, television, movies, newspapers, magazines and books are from the State Administration of Press, Publication, Radio, Film and Television; data of documents are from the State Archives Administration; data of sports are from the General Administration of Sport; data of physically-challenged athletes are from the China Disabled Persons’ Federation; data of health are from the National Health and Family Planning Commission; data of social services, minimum living allowances, five-guarantees supporting, areas of crops hit by natural disasters, direct economic loss caused by flood and waterlog, direct economic loss caused by drought, direct economic loss caused by low temperature, frost and snow are from the Ministry of Civil Affairs; data of supply of state-owned land for construction use are from the Ministry of Land and Resources; data of natural reserves and environment monitoring are from the Ministry of Environmental Protection; data of average temperature and typhoon are from the China Meteorological Administration; data of work safety are from the State Administration of Work Safety; all the other data are from the National Bureau of Statistics.