National Real Estate Development and Sales in 2011
1. The completion of real estate investment
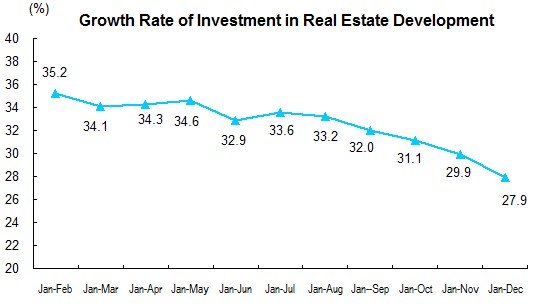
The total investment in real estate development in 2011 was 6,174.0 billion yuan, a nominal annual growth of 27.9 percent, 5.3 percentage points lower than that in the previous year, 2.0 percentage points lower than that in the first eleven months. In particular, the investment in residential buildings was 4430.8 billion yuan, up by 30.2 percent, 2.6 percentage points lower than that in the first eleven months, and accounted for 71.8 percent of real estate development investment.
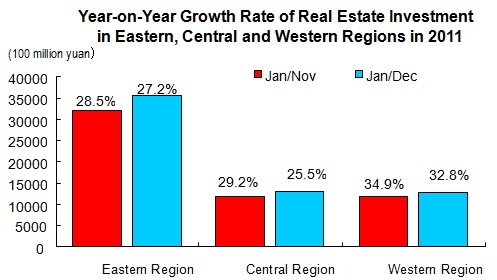
In 2011, the real estate investment in eastern region stood at 3,560.7 billion yuan, up by 27.2 percent over the previous year, the growth rate down 1.3 percentage points from January to November; the central region stood at 1,319.7 billion yuan, went up by 25.5 percent, and down by 3.7 percentage points; western region stood at 1,293.6 billion yuan, up 32.8 percent, and a decrease of 2.1 percentage points.
In 2011, the floor space under construction by the real estate development enterprises accounted for 5,080 million square meters, up by 25.3 percent over the previous year, down by 1.2 percentage points over the previous year, and decreased 2.6 percentage points over the first eleven months. Of which, the floor space of residential building construction area was 3,884 million square meters, up 23.4 percent. The floor space started this year was 1,901 millions square meters, up by 16.2 percent, and 24.4 percentage points lower than that in the previous year, 4.3 percentage points lower over the first eleven months. Specifically, the floor space of residential buildings started in the year amounted to 1460 million square meters, went up by 12.9 percent. The floor space of buildings completed stood at 892 million square meters, went up by 13.3 percent, 5.0 percentage points higher over the previous year, and 9.0 percentage points lower over the first eleven months, of which, the floor space completed of residential buildings stood at 717 million square meters, went up by 13.0 percent.
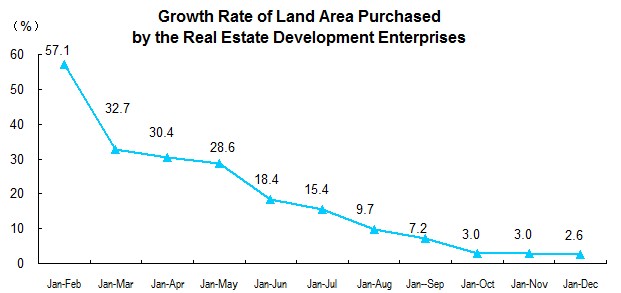
In 2011, the land area purchased by the real estate development enterprises totaled 410 million square meters, growing 2.6 percent, and 22.6 percentage points lower over the previous year, and a decline of 0.4 percentage points over the first eleven months. The total transaction of land topped 804.9 billion yuan, decreased 1.9 percent, while the figure of the previous year was 59.3 percent increase, and the figure for the first eleven months was 4.3 percent increase.
2. Sales of Commercial Buildings
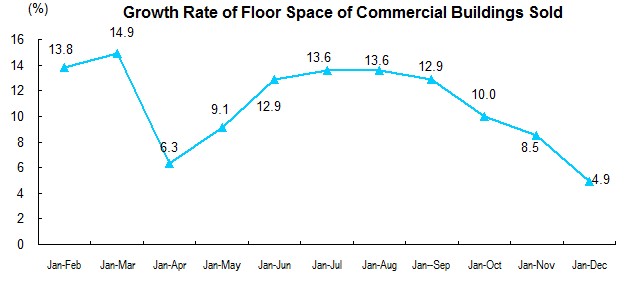
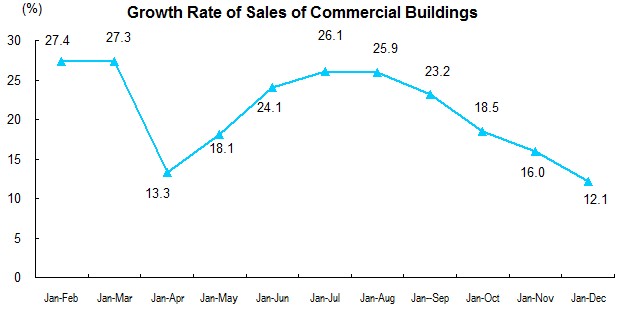
In 2011, the floor space of commercial buildings sold stood at 1099 million square meters, increased 4.9 percent over previous year, a decrease of 5.7 percentage points over the previous year, and and a decrease of 3.6 percentage points, and over the first eleven months. Of the total, the floor space of residential buildings increased 3.9 percent, office building increased 6.2 percent, and buildings for business use increased 12.6 percent. The sales of commercial buildings amounted to 5,911.9 billion yuan, an increase of 12.2 percent, and 6.8 percentage points over the previous year, and 3.9 percentage points decrease over the first eleven months. Specifically, the sales of residential buildings went up by 10.2 percent, office buildings up by 16.1 percent, buildings for commercial business up by 23.7 percent.
In 2011, the sale of floor space of commercial buildings in eastern region amounted to 511 million square meters, an increase of 0.1 percent over the previous year, and 4.6 percentage points decrease over the first eleven months. The amount of sales stood at 3,462.8 yuan, rising 3.8 percent, and 4.3 percentage points lower over the previous year. The sale of floor space of commercial buildings in central region amounted to 293 million square meters, an increase of 11.3 percent over the previous year, and 2.8 percentage points lower over the first eleven months. The amount of sales stood at 1,189.5 yuan, surged 29.4 percent, and 2.7 percentage points lower over the first eleven month. The sale of floor space of commercial buildings in western region amounted to 296 million square meters, an increase of 8.0 percent over the previous year, and 2.7 percentage points decrease over the first eleven months. The amount of sales stood at 1,259.6 yuan, surged 23.9 percent, and 4.4 percentage points lower.
At the end of 2011, the floor space of commercial housing for sale reached 271.94 million square meters, increasing 17. 63 million square meters compared with that at the end of November. Of which, the residential buildings for sale grew 13.22 million square meters, office buildings, grew 1.15 million square meters, buildings for business use grew 2.03 million square meters.
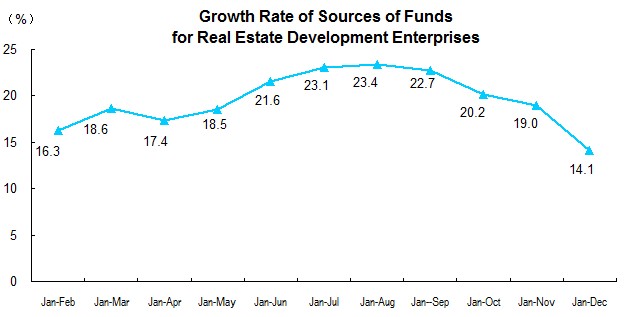
3. Sources of Funds for Real Estate Development Enterprises
In 2011, the sources of funds for real estate development enterprises reached 8,324.6 billion yuan, up by 14.1 percent, 12.1 percentage points lower than that in the previous year, and 4.9 percentage points over the first eleven months. Specifically, the domestic loans stood at 1,256.4 billion yuan, remained the same as that in the previous year, foreign investment stood at 8.14 billion yuan, up by 2.9 percent, self-raising funds stood at 3,409.3 billion yuan, up by 28.0 percent, and other sources stood at 3,577.5 billion yuan, up by 8.6 percent. Among the other sources of funds, deposits and advance payments totaled 2,161.0 billion yuan, climbed 12.1 percent, personal mortgage loans totaled 836.0 billion yuan, declined 12.2 percent.
4. National Real Estate Climate Index
In December of 2011, the national real estate climate index was 98.89, declined 0.98 points month-on-month.
|
Investment in Real Estate Development | ||
|
Indicators |
Absolute Value |
Growth Rate Year-on-Year (%) |
|
|
|
|
|
|
|
|
|
Investment in Real Estate (100 million yuan) |
61740 |
27.9 |
|
Of which: Residential Buildings |
44308 |
30.2 |
|
Office Buildings |
2544 |
40.7 |
|
Buildings for Commercial Business |
7370 |
30.5 |
|
Floor Space under Construction (10,000 sq.m) |
507959 |
25.3 |
|
Of which: Residential Buildings |
388439 |
23.4 |
|
Office Buildings |
15950 |
31.3 |
|
Buildings for Commercial Business |
56278 |
26.1 |
|
Floor Space of Houses Newly Started (10,000 sq.m) |
190083 |
16.2 |
|
Of which: Residential Buildings |
146035 |
12.9 |
|
Office Buildings |
5361 |
46.2 |
|
Buildings for Commercial Business |
20671 |
18.3 |
|
Land Acquisition Area (10,000 sq.m) |
40973 |
2.6 |
|
Value of Land Transactions (100 million yuan) |
8049 |
-1.9 |
|
Floor Space of Buildings Completed (10,000 sq.m) |
89244 |
13.3 |
|
Of which: Residential Buildings |
71692 |
13.0 |
|
Office Buildings |
2179 |
20.0 |
|
Buildings for Commercial Business |
9045 |
9.2 |
|
Floor Space of Commercial Buildings Sold (10,000 sq.m) |
109946 |
4.9 |
|
Of which: Residential Buildings |
97030 |
3.9 |
|
Office Buildings |
2008 |
6.2 |
|
Buildings for Business Use |
7878 |
12.6 |
|
Sales of Commercial Buildings (100 million yuan) |
59119 |
12.1 |
|
Of which: Residential Buildings |
48619 |
10.2 |
|
Office Buildings |
2502 |
16.1 |
|
Buildings for Commercial Business |
6702 |
23.7 |
|
Floor Space of Commercial Housing for Sale (10,000 sq.m) |
27194 |
26.1 |
|
Of which: Residential Buildings |
16904 |
35.8 |
|
Office Buildings |
1230 |
10.8 |
|
Buildings for Commercial Business |
5895 |
11.9 |
|
Sources of Funds for Real Estate Development Enterprises (100 million yuan) |
83246 |
14.1 |
|
Of which: Domestic Loans |
12564 |
0.0 |
|
Foreign Investment |
814 |
2.9 |
|
Self-raising Funds |
34093 |
28.0 |
|
Other Sources |
35775 |
8.6 |
|
Of Which: Deposits and Advantage Payments |
21610 |
12.1 |
|
Personal Mortgage Loans |
8360 |
-12.2 |
|
|
|
|
|
Real Estate Investment in Eastern, Central and Western Regions in 2011 | ||||
|
Regions |
Investment (100 million yuan) |
|
Growth Rate Y/Y (%) |
|
|
Residential Buildings |
Residential Buildings | |||
|
|
|
|
|
|
|
National Total |
61740 |
44308 |
27.9 |
30.2 |
|
Eastern |
35607 |
25215 |
27.2 |
31.1 |
|
Central |
13197 |
9832 |
25.5 |
25.3 |
|
Western |
12936 |
9262 |
32.8 |
33.3 |
|
|
|
|
|
|
|
Sales of Commercial Buildings in Eastern, Central and Western Regions in 2011 | ||||
|
Regions |
Floor Space of Commercial Buildings Sold |
Sales of Commercial Buildings | ||
|
Absolute Value |
Growth Rate Y/Y (%) |
Absolute Value |
Growth Rate Y/Y (%) | |
|
|
|
|
|
|
|
National Total |
109946 |
4.9 |
59119 |
12.1 |
|
Eastern |
51052 |
0.1 |
34628 |
3.8 |
|
Central |
29312 |
11.3 |
11895 |
29.4 |
|
Western |
29581 |
8.0 |
12596 |
23.9 |
|
|
|
|
|
|
Annotations:
1. Explanation of Indicator.
The total investment in real estate development this year: refers to the investment of all construction projects for housing, land development projects, public welfare construction and land acquisition costs in the reporting period. The index is cumulatively statistical data based on the principle of image progress.
Area of commercial buildings sold: refer total areas sold of new commercial buildings in the contract during the reporting period (i.e. area of floor spaces designated in the formal contract signed by both sides). The indicator is cumulative data.
Value of commercial buildings sold: refers to the total contracted vale of new commercial buildings for sale during the reporting period (i.e. the total value of sales for selling of commercial building as designated in the formal contract signed by both sides). This indicator is cumulative data, as well as the sale of floor space of commercial buildings.
The sources of funds for real estate development enterprises in the year: refers to various currencies and sources of real estate development funds actually available by the real estate development enterprises in the reporting period. Specifically, it includes domestic loans, foreign investment, self-raised funds and other funds. The index is cumulative data.
Floor space of buildings under construction: refers to the total floor space of all buildings by the real estate development enterprises during the reference time. Including floor space newly started in current year, floor space of continued construction of the building from the former period, floor space of stopped or postponed in the previous period but recovered in current year, floor space completed during current year, and newly started floor space in current year but postponed. Floor space under construction of multi-storey buildings refers to the total floor space of all storey.
Floor space of houses newly started: refers to floor space of houses newly started by the e real estate development enterprises during the reference time, the unit project as the accounting object. Not including continued construction area of housing which started in the previous period, and restarted construction area in the current year but stopped or postponed in the pervious period. Specific due date is subject to starts to housing officially began ground-breaking gouge (ground treatment or permanent piles). Floor space of houses newly started refers to the entire floor spaces of whole building; the calculation can not be separated.
Floor space of buildings completed: refers to housing construction during the reporting period have been completed in accordance with design requirements, achieved to living and conditions of use, acceptance of accreditation standards or to the final acceptance, total building areas could formally handed over to be used.
Land acquisition area: refers to land area by the real estate development enterprises in the year through variety of ways to obtain land.
Value of land transactions: refers to final amount of transactions of land use rights by the real estate development enterprises. In the primary land market, refers to the final section of land allocation, "auction" price and sale price; the secondary land market, refers to the finalize the contract price on land transfer, lease, mortgage, etc.. Price of land transactions and land acquisition area are the same scope, may calculate the average purchase price of land.
2. Statistics coverage: all real estate development and corporate business units.
3. Survey methods: collected monthly with complete enumeration (no report in January).
4. Brief description on national real estate climate index
National real estate climate index fluctuations follow by the economic cycle theory, according to the business cycle theory and business cycle analysis, based on the use of time series, multivariate statistical, econometric analysis, use the real estate development and investment as the benchmarks, selected related indicators such as real estate investment, capital, area, sales, conducted by the seasonal factors and random factors, adopting the growth rate cycle method. National real estate index selected year 2000 as the base year, its growth rate set at 100. Typically, the most appropriate level of national real estate climate index is 100, the moderate level is between 95-105, the lower level is below 95, and the higher level is above 105.
5. Division on Eastern, Central and Western Regions.
Eastern region includes Beijing, Tianjin, Hebei, Liaoning, Shanghai, Jiangsu, Zhejiang, Fujian, Shandong, Guangdong, and Hainan. Central region includes Shanxi, Jilin, Heilongjiang, Anhui, Jiangxi, Henan, Hubei, and Hunan. Western region includes Inner Mongolia, Guangxi, Chongqing, Sichuan, Guizhou, Yunnan, Tibet, Shaanxi, Gansu, Qinghai, Ningxia, and Xinjiang.
6. Real estate development and investment growth compared with the previous year, according to the data of 2010 annual report for comparison.