Statistical Communiqué of the People's Republic of China on the 2004 National Economic and Social Development
STATISTICAL COMMUNIQUÉ OF
THE PEOPLE'S REPUBLIC OF
ON THE 2004 NATIONAL
ECONOMIC AND SOCIAL DEVELOPMENT
NATIONAL BUREAU OF STATISTICS OF
In 2004, under the correct leadership of the Central Party Committee and the State Council, and guided by Deng Xiaoping Theory and the important thought of “Three Represents”, people of all nationalities of China thoroughly implemented the spirit of the 16th National Congress of CPC and the Third Plenary Session and the Fourth Plenary Session of the 16th CPC Central Committee, fulfilled the scientific concept of development strategy in full swing and carefully carried out various measures set by the central government aiming at enhancing and improving macroeconomic regulation which led to remarkable achievements. Unstable and unhealthy factors in the economic performance were put under control. Those weak links existing in agriculture, infrastructure construction and social undertakings had been strengthened. Favorable turn was seen in agricultural production. The excessive investment growth in some industries had been curbed initially. Reform in various fields progressed steadily and
I. General Outlook
Preliminary estimation indicated that the gross domestic product (GDP) of the year was 13,651.5 billion yuan, up by 9.5 percent over the previous year at comparable prices. The value-added of the primary industry was 2,074.4 billion yuan, up by 6.3 percent. The value-added of the secondary industry was 7,238.7 billion yuan, up by 11.1 percent. The value-added of the tertiary industry was 4,338.4 billion yuan, up by 8.3 percent. The contribution rates of the primary and the tertiary industries toward GDP growth were 9.2 percent and 29.0 percent respectively, or 5.2 and 2.8 percentage points higher as compared with that in the previous year.
The general level of consumer prices in
Table 1: Change in Consumer Prices in 2004 over 2003 (%) Item National average Urban Rural General level of consumer prices 3.9 3.3 4.8 Food 9.9 9.1 11.5 Of which: grain 26.4 25.7 27.7 Tobaccos and alcohols 1.2 1.2 1.3 Clothing -1.5 -1.5 -1.6 Household appliances and services -1.4 -1.9 -0.3 Medical, health and personal articles -0.3 -0.8 0.5 Transportation and telecommunications -1.5 -2.1 -0.2 Recreational, educational, cultural articles and services 1.3 0.8 2.1 Housing 4.9 4.3 5.8
In 2004, about 9.8 million new jobs were provided to urban residents, 800,000 more than the expected target, and 5.1 million laid-off workers were re-employed. Urban registered unemployment rate was 4.2 percent at the end of 2004, or 0.1 percentage point lower than that in 2003.
By the end of 2004,
Tax income of various forms for the whole year reached 2,571.8 billion yuan (excluding tariffs and agricultural taxes), up by 25.7 percent, an increase of 525.6 billion yuan over the previous year. The profits made by industrial enterprises above designated sized stood at 1,134.2 billion yuan, an increase of 38.1 percent over the previous year.
Main problems that existed in the economic and social development included: the unstable basis for agriculture, the difficulties in keeping the growth of grain production and rural household income; large number of newly started projects or projects under construction, high impulse of blind or overspread investment; high price rise for energy and raw materials; the tight relation between the supply and demand of energy and transportation, the occasional occurrence of severe accidents in production; the prominent phenomenon of resource waste and environmental pollution, and the relatively difficult life of some households.
II. Agriculture
In 2004, the sown areas of grain was 101.61 million hectares, an increase of 2.20 million hectares as compared with that in the previous year, and the sown areas of cotton was 5.69 million hectares, an increase of 580,000 hectares. The sown areas of oil-bearing crops was 14.52 million hectares, a decline of 470,000 hectares, the sown areas of sugar crops was 1.57 million hectares, a decrease of 90,000 hectares; and that for vegetables stood at 17.67 million hectares, a decline of 290,000 hectares.
The total output of grain in 2004 was 469.47 million tons, up by 38.77 million tons or 9.0 percent over the previous year. The output of cotton was 6.32 million tons, an increase of 30.1 percent; that of oil-bearing crops was 30.57 million tons, up by 8.8 percent. The output of sugar crops was 95.28 million tons, a decrease of 1.2 percent. Steady progress was seen in vegetable and fruits production due to expanded use of high quality varieties (Table 2).
Table 2: Output of Major Farm Products, 2004
|
Item |
Output (10,000 tons) |
Increase over 2003(%) |
|
Grain |
46947 |
9.0 |
|
Summer crops |
10104 |
4.8 |
|
Early rice |
3208 |
8.8 |
|
Autumn crops |
33635 |
10.3 |
|
Oil-bearing crops |
3057 |
8.8 |
|
Peanuts |
1431 |
6.6 |
|
Rapeseed |
1304 |
14.2 |
|
Cotton |
632 |
30.1 |
|
Sugar crops |
9528 |
-1.2 |
|
Sugarcane |
8948 |
-0.8 |
|
Beetroot |
580 |
-6.1 |
|
Cured tobacco |
214 |
6.2 |
|
Tea |
84 |
8.7 |
|
Fruits |
15243 |
5.0 |
|
Vegetables |
54927 |
1.7 |
The total output of meat for the year reached 72.60 million tons, up by 4.7 percent. Of this total, the output of beef and mutton was up 7.9 percent and 10.6 percent. The total output of aquatic products was 48.55 million tons, up by 3.2 percent.
Over 980,000 hectares of land were converted into farmland with effective irrigation system, another 1.30 million hectares of land were guaranteed by water-saving irrigation system.
III. Industry and Construction
In 2004, the total value-added of the industrial sector was 6,281.5 billion yuan, up by 11.5 percent over the previous year. The value-added of industrial enterprises above designated size was 5,480.5 billion yuan, up by 16.7 percent (Table 3). The sales ratio of industrial enterprises was 98.1 percent, or 0.2 percentage points higher than that in the previous year.
Table 3: Value-added of Industrial Enterprises above Designated Size, 2004
|
Item |
Value-added (100 million yuan) |
Increase over 2003(%) |
|
Value-added of industrial enterprises above designated size |
54805 |
16.7 |
|
Of which: State-owned and state-controlled enterprises |
23213 |
14.2 |
|
Of which: Collective enterprises |
2877 |
9.9 |
|
Share-holding enterprises |
24054 |
16.5 |
|
Enterprises invested by foreigners or investors from Of which: Private enterprises |
15241 8290 |
18.8 22.8 |
|
Of which: Light industry |
17762 |
14.7 |
|
Heavy industry |
37043 |
18.2 |
In 2004, the total output of primary energy reached 1,846 million tons of standard coal equivalent, up by 15.2 percent over the previous year. The electricity generated for the whole year was 2,187.0 billion kilowatt-hours, up by 14.5 percent. The output of coal was 1,956 million tons, up by 17.3 percent. The output of crude oil reached 175 million tons, up by 2.9 percent.
In 2004, the value-added of the smelting and pressing of ferrous metals was up 26.8 percent over the previous year; that of the nonferrous metals was up 22.4 percent; that of the raw chemical materials and chemical products and that of non-metal mineral products was up 18.2 and 19.9 percent respectively. Among major raw material products, the output of crude steel stood at 273 million tons, up by 22.7 percent; that of rolled steel was 297 million tons, up by 23.3 percent. The output of cement was 970 million tons, up by 12.5 percent. The production of 10 kinds of nonferrous metals went up by 16.4 percent; that of sulfuric acid, soda ash, caustic soda, ethylene and major chemical products increased from 2.4 percent to 18.5 percent.
In 2004, the value-added of the general equipment manufacturing industry was up by 22.2 percent over the previous year. The growth of electronic machinery and equipment manufacturing industry was 17.7 percent, and that of the transport equipment manufacturing industry was 14.0 percent. The production of large and medium-size tractors was up by 101.4 percent, and that of the power generating equipment was up by 92.9 percent. The total output of motor vehicles reached 5,074,000, an increase of 14.2 percent, of this total, the production of cars reached 2,314,000, up by 11.7 percent.
The value-added of high-tech industry was up 23.1 percent over the previous year. Of the high-tech industry, the growth of telecommunication equipment, computers and other electronic equipment was 26.9 percent. Of this total, the output of optical telecommunications facilities, program-controlled switchboards, mobile telephones and microcomputers rose by a range of 14.7 percent to 40.3 percent (Table 4).
Table 4: Output of Major Industrial Products, 2004
|
Product |
Unit |
Output |
Increase over 2003 (%) |
|
Yarn |
10000 tons |
1120.00 |
13.9 |
|
Cloth |
100 million meters |
420.00 |
18.8 |
|
Chemical fibers |
10000 tons |
1424.54 |
20.6 |
|
Machine-made sugar |
10000 tons |
1017.61 |
-6.1 |
|
Cigarettes |
100 million |
18744.13 |
6.5 |
|
Color TV sets |
10000 |
7328.80 |
12.0 |
|
Household refrigerators |
10000 |
3033.38 |
35.3 |
|
Room air conditioners |
10000 |
6646.22 |
37.9 |
|
Total primary energy production |
100 million tons of standard coal equivalent |
18.46 |
15.2 |
|
Coal |
100 million tons |
19.56 |
17.3 |
|
Crude oil |
100 million tons |
1.75 |
2.9 |
|
Electricity |
100 million kilowatt-hours |
21870.00 |
14.5 |
|
Crude steel |
10000 tons |
27279.79 |
22.7 |
|
Rolled steel |
10000 tons |
29723.12 |
23.3 |
|
Ten kinds of nonferrous metals |
10000 tons |
1430.00 |
16.4 |
|
Of which: Copper |
10000 tons |
217.00 |
18.0 |
|
Aluminum oxide |
10000 tons |
699.00 |
14.7 |
|
Cement |
100 million tons |
9.70 |
12.5 |
|
Sulfuric acid |
10000 tons |
3994.24 |
18.5 |
|
Soda ash |
10000 tons |
1302.46 |
14.9 |
|
Caustic soda |
10000 tons |
1060.26 |
12.2 |
|
Ethylene |
10000 tons |
626.58 |
2.4 |
|
Chemical fertilizers (100 percent equivalent) |
10000 tons |
4469.47 |
15.2 |
|
Power-generating equipment |
10000 kilowatts |
7137.88 |
92.9 |
|
Motor vehicles |
10000 |
507.41 |
14.2 |
|
Of which: Cars |
10000 |
231.40 |
11.7 |
|
Large & medium tractors |
10000 |
9.83 |
101.4 |
|
Integrated circuits |
100 million pieces |
211.46 |
42.6 |
|
Program-controlled switchboards |
10000 lines |
8464.78 |
14.7 |
|
Mobile telephones |
10000 |
23344.58 |
28.1 |
|
Fax machines |
10000 |
1380.43 |
84.9 |
|
Micro-computers |
10000 |
4512.41 |
40.3 |
|
Optical telecommunications facilities |
10000 sets |
13.96 |
28.0 |
Among the industrial enterprises above designated size, the profits of state-owned and state-controlled enterprises stood at 531.2 billion yuan, up by 42.5 percent; that of the collective enterprises was 51.2 billion yuan, up by 31.3 percent. The profits made by share-holding enterprise reached 544.8 billion yuan, up by 39.4 percent; that of foreign invested enterprises and enterprises invested by investors from
In 2004, the value-added of construction enterprises in
IV. Investment in Fixed Assets
The completed investment in fixed assets of the country in 2004 was 7,007.3 billion yuan, up by 25.8 percent over the previous year, or 1.9 percentage points lower as compared with the growth in 2003. Of the total investment, that in urban areas was up by 27.6 percent, and that in rural areas grew by 17.4 percent (Table 5).
In terms of investment in different areas, the investment in eastern region was 4,024.2 billion yuan, up by 24.8 percent; that in central region was 1,512.6 billion yuan, up by 30.2 percent and that in western region was 1,374.9 billion yuan, up by 26.6 percent (Table 5).
Table 5: Investment in Fixed Assets, 2004
|
Item |
Value(100 million yuan) |
Increase over 2003(%) | ||
|
Investment in fixed assets |
70073 |
|
25.8 |
|
|
By urban/rural areas: |
|
|
|
|
|
Urban areas |
58620 |
|
27.6 |
|
|
Of which: By state-owned and state-controlled enterprises |
33713 |
|
14.5 |
|
|
Rural areas |
11452 |
|
17.4 |
|
|
By region: |
|
|
|
|
|
Eastern |
40242 |
|
24.8 |
|
|
Central |
15126 |
|
30.2 |
|
|
Western |
13749 |
|
26.6 |
|
Of the investment in urban areas, the investment in the primary industry rose by 20.3 percent as compared with a 19.6 percent decline in 2003. The investment in the secondary industry grew by 38.3 percent, 8 percentage points lower as compared with that in the previous year, and that of the tertiary industry was up by 21.6 percent, or 0.5 percentage points lower.
Of all projects over 5 million yuan worth of investment in urban areas, the investment in the production of steel was up by 32.3 percent, it was 63.9 percentage points lower as compared with that in the previous year; that in aluminum production was down by 1.8 percent, as compared with a 86.6 percent growth in the previous year. The investment in cement went up by 43.3 percent, or 70.1 percentage points lower; vehicles, 53.5 percent, or 24.3 percentage points lower; textiles, 30.3 percent, or 56.4 percentage points lower over the previous year.
In 2004, the investment in real estate development was 1,315.8 billion yuan, up by 28.1 percent. The total sales of commercial buildings for the whole year reached 1,037.6 billion yuan, up by 30.3 percent. Of this total, the sales to individuals went up by 30.0 percent, accounting for 93.3 percent of the total sales of commercial buildings.
Major production capacity continued to increase (Table 6).
Table 6: Newly Increased Production Capacity through Investment in Capital Construction, 2004
|
Item |
Unit |
Value |
|
Newly increased power generating capacity |
10,000 kw |
5055 |
|
Power transformer equipment with a capacity of over 110,000 kilovolts |
10,000 kilovolt-amperes |
14996 |
|
New trunk railways put into operation |
Kilometer |
1433 |
|
Double-track railways put into operation |
Kilometer |
352 |
|
Electrified railways put into operation |
Kilometer |
409 |
|
New highways |
Kilometer |
46411 |
|
Of which: Expressways |
Kilometer |
4476 |
|
Newly increased cargo-handling capacity of 10000-ton berths at harbors |
10,000 tons |
11958 |
|
Newly installed capacity of telephone switchboards |
10,000 gates |
7020 |
|
Newly increased length of optical-fiber cables |
10,000 km |
65 |
|
Newly installed capacity of digital cellular mobile phone, switchboards |
10,000 |
6049 |
The total completed investment in the Three Gorges Project stood at 111.4 billion yuan, putting 11 power generators into operation with newly increased power generating capacity reaching 7.70 million kilowatts. The total completed investment in Qinghai-Tibet railway was 19.8 billion yuan, with completed length of the railway extending to 743 kilometers. By the end of 2004, the piping work for the west-east natural gas transmission project was put into commercial operation. The eastern and central routes of the south-to-north water diversion project started with total completed investment in five sub-projects reaching to 2.1 billion yuan. With the financial support from the central government, a total length of 150,000 kilometers of county and rural highways were reconstructed; the difficulty in getting access to drinking water for about 50.20 million rural population were solved; a total number of 163 projects of medical aid system were in place for emergent public health events, and another 1,296 projects of national disease prevention and control network were basically completed.
V. Domestic Trade
In 2004, the total retail sales of consumer goods reached 5,395.0 billion yuan, up by 13.3 percent over the previous year, or a real growth of 10.2 percent if price factors were deducted. Of this total, the retail sales of consumer goods in urban areas reached 3,557.3 billion yuan, up by 14.7 percent, and the retail sales of consumer goods at and below county level was 1,837.7 billion yuan, up by 10.7 percent. In terms of different sectors, the sales of the wholesale and retail industry reached 4,484.0 billion yuan, up 12.5 percent, the sales of the catering industry was 748.6 billion yuan, up 21.6 percent, and the sales of other industries was 162.4 billion yuan, up 1.5 percent.
Of the total retail sales by wholesale and retail enterprises above designated size, the sales of cultural and office goods was up by 22.7 percent; that of the telecommunication equipment was up by 41.7 percent; that of electric and electronic appliances for household use and audio-video equipment was up by 13.7 percent; that of the building and decoration materials went up by 27.1 percent; that of furniture was up 21.8 percent; that of food, beverages, tobacco and liquor grew by 17.9 percent; that of clothing, shoes, hats, knitwear and textiles was up by 18.7 percent; that of motor vehicles was up by 23.4 percent and that of petroleum and related products was up by 45.9 percent.
VI. Foreign Economic Relations
Total value of import and export in 2004 reached 1,154.8 billion US dollars, up 35.7 percent over the previous year. Of this total, the value of export was 593.4 billion US dollars, up 35.4 percent, and the value of import was 561.4 billion US dollars, up 36.0 percent (Table 7).
Table 7: Import and Export by Major Categories, 2004
|
Item |
Value (100 million USD) |
Increase over 2003 (%) | |
|
Total import and export |
11548 |
|
35.7 |
|
Export |
5934 |
|
35.4 |
|
Of which: General trade |
2436 |
|
33.9 |
|
Processing trade |
3280 |
|
35.7 |
|
Of which: Mechanical and electronic products |
3234 |
|
42.3 |
|
Of which: High and new-tech products |
1655 |
|
50.2 |
|
Import |
5614 |
|
36.0 |
|
Of which: General trade |
2482 |
|
32.3 |
|
Processing trade |
2217 |
|
36.1 |
|
Of which: Mechanical and electronic products |
3019 |
|
34.2 |
|
Of which: High and new-tech products |
1614 |
|
35.3 |
Fast growth was recorded in import and export with major trade partners (Table 8).
Table 8: Import and Export by Major Countries and Regions, 2004
|
|
Export (100 million USD) |
Increase over 2003 (%) |
Import (100 million USD) |
Increase over 2003 (%) |
|
Hong Kong SAR ASEAN European Union |
1009 735 278 429 1072 91 1249 |
32.3 23.7 38.4 38.7 36.9 51.0 35.1 |
118 944 622 630 701 121 447 |
6.1 27.3 44.3 33.1 28.8 24.7 31.9 |
The year 2004 witnessed the approval of establishment of 43,664 foreign direct invested enterprises in
Table 9: Foreign Direct Investment by Sectors, 2004
Value in 100 million US dollars
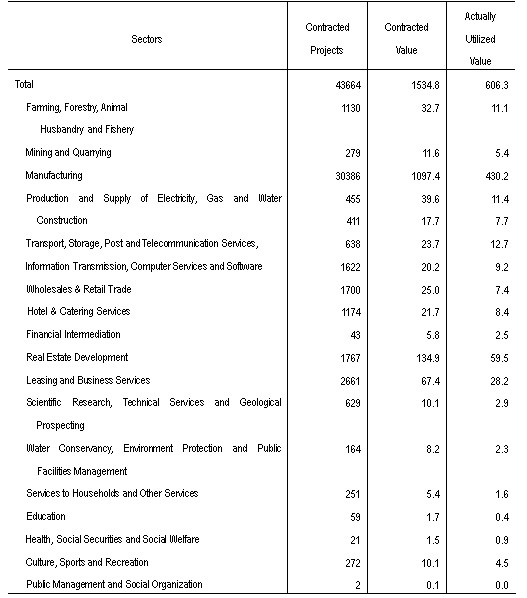
In 2004, the accomplished business revenue through contracted overseas engineering projects was 17.5 billion US dollars, up by 26.0 percent, and the business revenue through overseas labor contracts was 3.8 billion US dollars, up by 13.4 percent.
VII. Transportation, Post, Telecommunications and Tourism
The value-added of the transportation, post and telecommunications sectors reached 777.7 billion yuan in 2004, up by 14.9 percent over the previous year.
The freight turnover by all means of transportation reached 6,669.8 billion ton-kilometers, up by 23.8 percent over the previous year. Of the total, the freight turnover by railways was 1,928.9 billion ton-kilometers, up 11.8 percent; that by highways 759.6 billion ton-kilometers, up 7.0 percent; that by waterways 3,897.3 billion ton-kilometers, up 35.7 percent; that by civil aviation 7.2 billion ton-kilometers, up 24.0 percent; and that by pipelines 76.8 billion ton-kilometers, up 3.9 percent.
The passenger flow by all means of transportation reached 1,632.4 billion passenger-kilometers, up 18.2 percent over the previous year, of which, passenger flow by railways was 571.2 billion passenger-kilometers, up 19.3 percent; that by highways 876.5 billion passenger-kilometers, up 13.9 percent; that by waterways 6.5 billion passenger-kilometers, up 3.3 percent; and that by civil aviation 178.2 billion passenger-kilometers, up 41.1 percent.
The volume of freight handled by ports throughout the country totaled 4 billion tons, up 21.3 percent over the previous year, of which, freight for foreign trade accounted for 1.15 billion tons, up 18.4 percent. Container shipping handled 61.5 million standard containers.
The total number of motor vehicles for civilian use reached 27.42 million by the end of year 2004, up 15.0 percent year-on-year, of which, that of private-owned vehicles was 13.65 million, up 12.0 percent. The number of civilian cars was 9.2 million, of which, private cars accounted for 6 million.
The business transactions of postal and telecommunication services totaled 979.1 billion yuan, up 34.9 percent over the previous year. Of this total, postal services accounted for 56.6 billion yuan, up 4.4 percent; telecommunication services 922.5 billion yuan, up 37.4 percent. By the end of 2004, the total capacity of office exchanges reached 420 million gates, with 70.2 million newly installed exchanges. The year 2004 saw 49.7 million new telephone subscribers to bring the total number of telephone subscribers to 312.44 million at the end of the year. This included 210.85 million urban subscribers and 101.59 million rural subscribers. Mobile phone users numbered 334.83 million by the end of 2004, with 64.87 million new subscribers. In total, the number of telephone and mobile phone users reached 647.27 million, an increase of 114.57 million as compared with the end of 2003. On the average, there were 51 telephones or mobile phones per 100 persons in
In 2004, a total of 109.04 million international visitors came to
VIII. Banking, Security and Insurance
By the end of 2004, the money supply of broad sense (M2) was 25.3 trillion yuan, reflecting a year-on-year increase of 14.6 percent. Money supply of narrow sense (M1) was 9.6 trillion yuan, up 13.6 percent. Cash in circulation (M0) was 2.1 trillion yuan, up 8.7 percent. Savings deposit in Renminbi and foreign currencies in all financial institutions totaled 25.3 trillion yuan at the end of 2004, up 15.3 percent. Loans in Renminbi and foreign currencies by all financial institutions reached 18.9 trillion yuan, up 14.4 percent (Table 10).
The loans in Renminbi by rural credit cooperatives stood at 1.9 trillion yuan, an increase of 253.2 billion yuan. The loan for consumption in Renminbi by all financial institutions totaled 2 trillion yuan, an increase of 432.7 billion yuan, of which, the loan for individual housing was 1.6 trillion yuan, an increase of 407.3 billion yuan.
Table 10: Savings Deposit and Loans in Renminbi and Foreign Currencies
in All Financial Institutions, 2004
|
Item |
Year-end figure (100 million yuan) |
Increase over 2003 (%) | ||
|
Savings deposit |
253188 |
|
15.3 |
|
|
Of which: By enterprises |
89438 |
|
16.4 |
|
|
By urban and rural residents |
126196 |
|
14.0 |
|
|
Of which: Deposits in Renminbi |
119555 |
|
15.4 |
|
|
Loans |
188566 |
|
14.4 |
|
|
Of which: Short-term |
90808 |
|
7.4 |
|
|
Medium and long-term |
81010 |
|
22.1 |
|
Funds raised through issuing stocks and share rights on stock market were 151.1 billion yuan, an increase of 15.3 billion yuan over the previous year. Of this total, 123 companies issued A shares (including newly issued and convertible loan stock) and another 23 companies issued A share rights, with 83.6 billion yuan of capital paid in, an increase of 1.6 billion over 2003. The issue of 28 B and H shares raised another 67.5 billion yuan worth of foreign capital, an increase of 13.7 billion yuan. The number of listed companies (with A or B shares) on China stock market rose from 1,287 at the end of 2003 to 1,377 at the end of 2004, worth of 3,705.6 billion yuan in value, a shrink of 12.7 percent over the previous year.
The premium of domestic and foreign insurance companies totaled 431.8 billion yuan, up 11.3 percent over the previous year. Of this total, life insurance premium was 285.1 billion yuan, health and casualty insurance premium 37.7 billion yuan, and property insurance premium 109 billion yuan. The insurance companies paid an indemnity of 100.4 billion yuan, of which, life insurance indemnity was 30.8 billion yuan, health and casualty insurance indemnity 12.9 billion yuan, and property insurance indemnity 56.8 billion yuan.
IX. Education, Science and Technology
In 2004, the country had an enrollment of 820,000 postgraduate students, including 326,000 new entrants, and 151,000 graduates. The enrollment of regular undergraduates was 13,335,000, including 4,473,000 new entrants, and 2,391,000 graduates. Vocational secondary schools of various types had an enrollment of 13,679,000 students, with 5,481,000 new entrants, and 3,510,000 students graduated. Regular senior secondary schools had 22,204,000 enrolled students, including 8,215,000 new entrants, and 5,469,000 graduates. Students enrolled in junior secondary schools totaled 64,750,000, including 20,782,000 new entrants, and 20,704,000 graduates. Regular primary schools had an enrollment of 112,462,000 students, including 17,470,000 new entrants, and 21,352,000 graduates. There were 372,000 students in special education schools, with 51,000 new entrants. Kindergartens accommodated 20,844,000 children.
The expenditure on research and development activities (R&D) in the whole country was 184.3 billion yuan, up 19.7 percent over 2003, accounting for 1.35 percent of GDP. Of this total, 10.2 billion yuan was appropriated for basic researches. The number of professionals and technicians of all specializations working in state-owned enterprises and institutions stood at 27,163,000 at the end of the year.
By the end of year 2004, there were altogether 18,983 institutions for inspection of manufactured goods, including 263 national inspection centers. There were 169 institutions for certification of product quality and systems, which accumulatively certified products in 31,000 enterprises. A total of 4,098 authorized measurement institutions enforced compulsory inspection on 34 million measurement instruments, and 893 national standards were formulated or revised in the year, including 458 new standards. The country had 255 meteorological observatories with radar installations, 382 satellite cloud map receiving stations, 1,253 seismological monitoring stations and 30 remote monitoring network stations. The number of marine observation and monitoring spots reached 2,706. Mapping departments published 1,767 maps and 430 mapping books.
X. Culture, Public Health and Sports
At the end of 2004, there were 2,599 art-performing groups, 2,858 culture centers, 2,710 public libraries and 1,509 museums in
By the end of 2004, there were 277,000 health care institutions in
In 2004, Chinese athletes won 106 world championships on 27 sports. Seven athletes and 2 teams broke 16 world records on 16 occasions. With 32 gold medals, 17 silver medals and 14 bronze medals,
XI. Population, People’s Life and Social Securities
At the end of 2004, the total population of
Table 11: Composition of Population, 2004
10,000 persons
|
|
Population (year-end figure) |
Percentage (%) | |||
|
National Total |
129988 |
|
100.0 |
| |
|
Of which: |
Urban |
54283 |
|
41.8 |
|
|
|
Rural |
75705 |
|
58.2 |
|
|
Of which: |
Male |
66976 |
|
51.5 |
|
|
|
Female |
63012 |
|
48.5 |
|
|
Of which: |
0-14 years |
27947 |
|
21.5 |
|
|
|
15-64 years |
92184 |
|
70.9 |
|
|
|
65 years and over |
9857 |
|
7.6 |
|
In 2004, the per capita annual net income of rural households was 2,936 yuan. It registered the highest growth since 1997 with a real increase of 6.8 percent after price factors were deducted. The per capita disposable income of urban households was 9,422 yuan, a real increase of 7.7 percent. The Engel coefficients (which refers to the proportion of expenditure on food to the total expenditure of households) were 47.2 percent for rural households and 37.7 percent for urban households. The population in absolute poverty in rural areas (with annual per capita net income below 668 yuan) was 26.1 million at the end of 2004, a decline of 2.9 million over the previous year. The low-income population in rural areas (with annual per capita net income between 669 and 924 yuan) was 49.77 million, a decline of 6.4 million.
By the end of 2004, 163.42 million people participated in the basic pension programs, a year-on-year increase of 8.36 million. Among them, 122.42 million were staff and workers, and 41 million were retirees. A total of 105.84 million people participated in unemployment insurance programs, an increase of 2.11 million. The population covered by basic health insurance programs was 123.86 million, a year-on-year increase of 14.84 million. Among them, 90.33 million were staff and workers, and 33.53 million were retirees. All of the 37.7 million enterprise retirees who participated in basic pension programs received full pensions on time by the end of the year. There were still 1.53 million laid-off workers from state-owned enterprises at the end of 2004. All of the laid-off workers in re-employment centers received their full subsistence allowances on time, and their social security payment were paid by the centers. The number of people who received unemployment insurance payment stood at 4.19 million, maintaining the same level as that of the previous year. A total of 22.01 million urban residents received the government minimum living allowance, 460,000 less than the previous year.
Social welfare institutions of various types possessed 1,330,000 beds by the end of 2004, accommodating 1,023,000 inmates. Some 174,000 community service facilities in urban areas were set up, including 9,888 integrated community service centers. In 2004,
XII. Resources and Environment
With the implementation of scientific concept of development strategy, 2004 saw enhanced input in resources and environment protection. Some progress was made in effective utilization of resources and protection of environment. Nevertheless, there was increasing pressure of environment protection as high consumption and huge waste of resources became increasingly noticeable to impede the economic development.
Achievement was made in strengthening land resource management. Administration and consolidation of land market revealed unreported use of 148,000 hectares of farmland for construction purpose in the past. The whole year saw 145,000 hectares of farmland appropriated for actual construction, down by 37.0 percent over the previous year. Some 63,000 hectares of cultivated land were destroyed by disasters. A total of 733,000 hectares of farmland were converted into land for ecological preservation. Structural adjustment in agriculture production led to a reduction of 205,000 hectares of cultivated land. On the other hand, land reclamation and re-development projects added over 346,000 hectares of cultivated land. As a result, the year 2004 saw a net reduction of 800,000 hectares of cultivated land.
The water resource per capita was 2,040 cubic meters in 2004, down by 4.0 percent as compared with 2003. The annual average precipitation was 620 millimeters, down by 2.8 percent. The 422 large reservoirs in
The sixth enumeration of the nation’s forest resources (1999-2003) demonstrated that the total forest area was 175 million hectares, and the forest coverage rate was 18.21 percent. The total standing stock volume was 13.62 billion cubic meters, and the stock volume of the forest was 12.46 billion cubic meters.
National land and resources surveys and geological explorations discovered a total of 205 new mineral deposits in large or medium size, including 24 energy mineral deposits, 66 metal mines, 113 non-metal mines and 2 water or gas minerals deposits. Increased reserves were found for 56 minerals, including 1,098 million tons of crude oil, 380.2 billion cubic meters of natural gas and 9,654 million tons of coal.
Preliminary estimation indicated that the total energy consumption in 2004 amounted to 1,970 million tons of standard coal equivalent, up by 15.2 percent over 2003. Of this total, the consumption of coal was 1,870 million tons, up 14.4 percent, the consumption of crude oil was 290 million tons, up 16.8 percent, that of natural gas 41.5 billion cubic meters, up 18.5 percent, that of hydro-electric power 328 billion kilo-watt hours, up 15.6 percent, and that of nuclear power 50.1 billion kilo-watt hours, up 15.6 percent. The consumption of major raw materials included 310 million tons of rolled steel, up 15.1 percent; 12.84 million tons of aluminum oxide, up 9.7 percent; and 960 million tons of cement, up 12.4 percent. Energy consumption for producing 10,000 yuan worth of GDP was 1.58 tons of standard coal equivalent, up 5.3 percent.
Monitoring of water quality on 413 sections of the 7 major water systems in China showed that 41.6 percent of sections satisfied the national quality standard of Grade III for surface water, up 3.5 percentage points over the previous year; 30.5 percent met the quality of Grade IV or V, down by 1.7 percentage points; and 27.9 percent were below Grade V, down by 1.8 percentage points.
Monitoring of marine water quality at 246 offshore monitoring stations indicated that the marine water met the national quality standard Grade I and II in 49.6 percent of stations, maintaining the same level as in the previous year; it met Grade III in 15.4 percent of the stations, down by 4.4 percent; and marine water with Grade IV or inferior was found in 35.0 percent of stations, up by 5 percentage points. A total of 169,000 square kilometers of seawater did not meet the quality standard of clean seawater, up by 19.0 percent over the previous year. Of this total, seriously polluted sea area accounted for 32,000 square kilometers. Monitoring in 15 marine ecology monitoring zones showed that major thalassic, estuarine and wetlands ecosystem were in quasi-healthy or unhealthy conditions.
The daily municipal sewage treatment capacity reached 74.02 million cube meters, up 11.7 percent. The central heating areas amounted to 2.05 billion square meters, up 8.4 percent.
Steady progress was made in ecologic environment construction. Water break has not occurred for the fifth consecutive year on the
Notes:
1) All figures in the Communiqué are preliminary statistics.
2) Statistics in the Communiqué do not include figures for Hong Kong SAR, Macao SAR and
3) Figures in value terms on gross domestic product and value-added quoted in the Communiqué are at current prices, whereas growth rates are calculated at comparable prices.
4) Fruit production in Table 2 includes melons and gourds consumed as fruits.
5) The output and consumption of rolled steel includes some duplicated counting in producing rolled steel using other types of rolled steel as intermediate input.
6) Investment in fixed assets in eastern, central and western regions as shown in Table 5 do not add up to the total investment, because investment that could not be classified by region is not included.
7) The number of switchboards is counted in the calculation of telephone possession rate.
8) The value of business transactions of post and telecommunication services is calculated at constant prices of 2000.
9) The total forest area and forest coverage rate as mentioned in the sixth enumeration of nation’s forest resources includes newly grown shrubberies as specified by the state in the interval between the enumerations.