Developing Business Demographic Measures of Industry and Size
Richard Clayton(United States)
Amy Knaup, David Talan, and Akbar Sadeghi
US Bureau of Labor Statistics
In the fall of 2003, the BLS began publishing measures of business demography from its universe frame. BLS publishes these measures under the title of Business Employment Dynamics (BED). The BED program is being expanded in a step wise fashion to cover the full range of measures covering births, deaths, industry, size, survival and other measures at various geographical levels ¨C national, state and county.
Data Sources and Longitudinal database: The data are derived from the Quarterly Census of Employment and Wages program. The QCEW is based on the state Unemployment Insurance (UI) system. Under the UI system in each state, businesses must report each quarter the number of employees each month and the total wages paid, among other information. The BLS funds the States to draw from the UI system, edit, review and analyze these data. The QCEW is further enhanced by quarterly collections of data for each individual establishment under each multi-unit business. An annual collection provides updates to industry, address and other contact information
These measures are possible due to the completion in 2001 of the linked longitudinal database. Covering 1990 to the present, it is a growing database of over 352 million quarterly records.
Annual data is usually available from national tax records, however, the quarterly feature of the QCEW provide more time sensitive measures. The quarterly measures provide a much more clear picture of the business cycle than the annual measures.
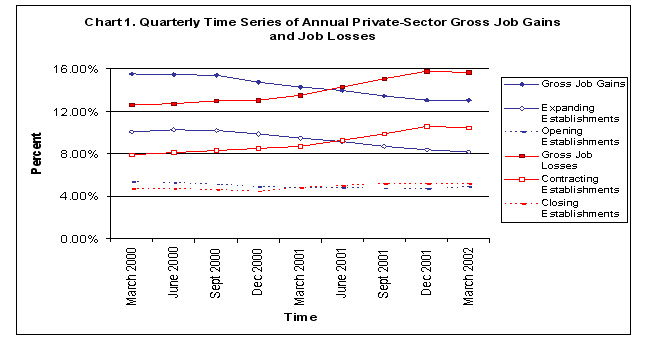
Annual gross flows will exhibit lower magnitudes compared to the quarterly flows because these flows ignore the quarterly seasonality that is present in the quarterly flows (chart 1). Many business establishments have production schedules throughout the year and the quarterly flows capture this dynamic. Since the annual flows compare the same month to a year ago, the build-up and layoffs that establishments typically exhibit is hidden with the annual data, while the quarterly flows reveal this churn. In this way, the quarterly data provides a better picture of the business cycle compared to annual flows, since these data allow for more timely and frequent analysis.
Existing measures: The QCEW began publishing national level data covering basic data types. The lowest level data are openings, closings, expansion, contractions. Adding these together provides gross job gains and losses (also known as job creation and job destruction). The data are published for both units and employment.
These measures provide the public and policymakers with new insights into business dynamics. The turn ¡°churning¡± is increasingly seen in economic writings using both the BLS BED and also the BLS monthly Job Openings and Labor Turnover (JOLTS) data.
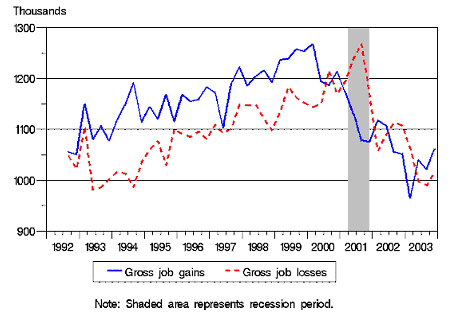
New Measures in Publication - Industry: In May 2003, BLS released its first high level industry data. These measures cover the NAICS supersectors (see Charts 2-4).
Chart 2. Time Series of Quarterly Gross Job Gains and Losses
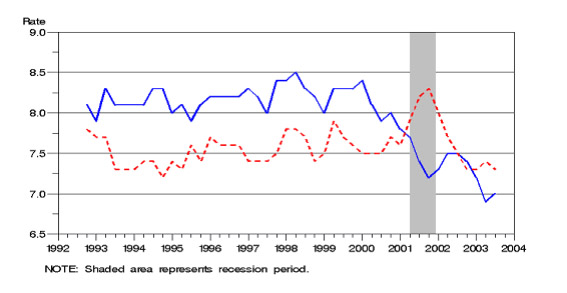
Chart 3. Manufacturing Sector Gross Job Gains and Losses, Seasonally Adjusted
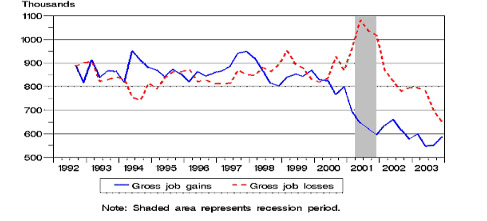
Chart 4. Retail Trade Sector Gross Job Gains and Losses, Seasonally Adjusted
New Measures under development:
State and county level data: As BLS develops and publishes increasingly detailed BED measures, it is critically important to profile the data in several ways before publishing. These measures are directly affected by identifying business linkages. Churning at a high level is the combination of the many business decisions and events. The most critical event to capture is the merging and splitting of business units.
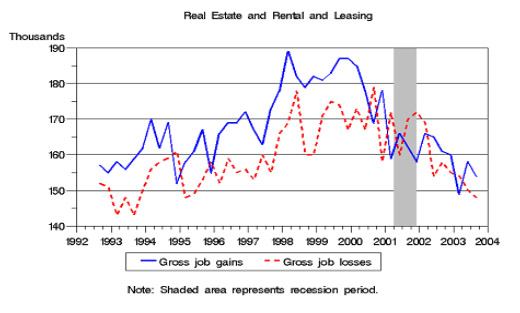
Detailed Industries: Business Employment Dynamics data are begin developed for lower levels of detail. Upon review, validation and seasonal adjustment, these data can be released as workload permits (see Charts 5 and 6).
Predecessor and successor link are drawn from several sources. The dominant source is from the UI system. The UI laws require that businesses report the buying of business units so that UI tax liability can follow the buyer.
Chart 5. Selected Industry Gross Flows Data Before Review
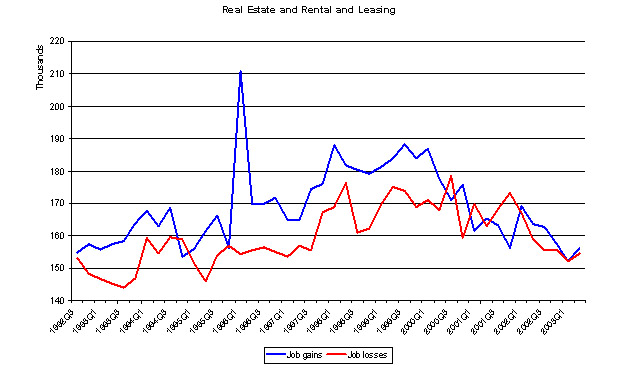
Chart 6. Selected Industry Gross Flows Data After Review
Size Class: One of the most popular economic topics is the question of what kinds of businesses create/destroy the most jobs. Most measures show that small businesses create the most jobs. The methodology for calculating these measures is a very difficult and sensitive issue. Recently, BLS published an article that compared the results of three methods for a short time period. BLS is developing the full 14-year history using each of these three methods
The new BLS measures of gross job gains and gross job losses provide a more thorough understanding of the employment decisions of the millions of business establishments in the U.S. economy. Examining establishment level employment changes will allow economists and policymakers to analyze the large gross job flows that underlie the substantially smaller net employment changes, as well as analyze the establishment level employment dynamics across various stages of the business cycle.
This article begins with a definition of gross job gains and gross job losses. This is followed by a description of the source data used by BLS to generate estimates of quarterly gross job gains and gross job losses, and an explanation of the methodology for longitudinally linking establishment records. The heart of this article is the presentation of the new BLS business employment dynamics data series, with an analysis of the levels and movements of gross job gains and gross job losses during the past ten years. This article concludes with a summary of ongoing work and future enhancements to the gross job gains and gross job loss statistics at the BLS.
Concepts and Definitions: A change in aggregate employment from one quarter to the next is the net result of the millions of business establishments in the U.S. economy changing their specific employment levels. While this aggregate net change identifies the overall growth or decline of the labor market, it does not summarize the underlying heterogeneity of the many establishments opening and expanding, or the many establishments contracting or closing. Statistics on gross job gains and gross job losses aggregate the establishment-level employment changes in such a way that one can observe and assess the underlying dynamics[1].
An example can help define the concepts of gross job gains and gross job losses. In March 2003 (referring to non-seasonally adjusted data), there were 105,079,625 jobs, and in June 2003 there were 107,615,979 jobs. Employment increased (on a non-seasonally adjusted basis) by 2,536,354 jobs during the second quarter of 2003. This employment growth can be decomposed into expanding, opening, contracting, and closing establishments. Employment in expanding establishments grew by 7,229,797 jobs, and employment in opening establishments grew by 1,754,671 jobs. The level of gross job gains was 8,984,468 jobs during the second quarter of 2003, a rate of 8.5 percent. Employment in contracting establishments declined by 5,093,167 jobs, and closing establishments accounted for the loss of 1,354,947 jobs. The level of gross job losses was 6,448,114 jobs during the second quarter of 2003, a rate of 6.1 percent. The difference between the gross job gains and the gross job losses is the net employment increase of 2,536,354 jobs, a rate of 2.4 percent.
Longitudinal Establishment Microdata:
The Source Data: The source of the data used for constructing the new BLS business employment dynamics data series is the Quarterly Census of Employment and Wages (QCEW), also known as the ES-202 program. The data gathered in the QCEW program are a comprehensive and accurate source of employment and wages, and provide a virtual census (98%) of employees on nonfarm payrolls. In the second quarter of 2003, the QCEW statistics show an employment level of 129.2 million, with 8.2 million establishments in the U.S. economy. The QCEW data are derived from quarterly Unemployment Insurance (UI) administrative microdata. All employers subject to state UI laws are required to submit quarterly contribution reports detailing their monthly employment and quarterly wages to the State Employment Security Agencies. After the microdata are edited and, if necessary, corrected by the State Labor Market Information staff, the states submit these data and other business identification information to the Bureau of Labor Statistics as part of the federal-state cooperative QCEW program.
Since the gross job gains and gross job loss statistics are defined from the establishment level employment changes, it is important to mention the definitions of establishments and employment in the QCEW program. An establishment is defined as an economic unit that produces goods or services, and an establishment is usually a physical location engaged in one or predominantly one type of economic activity. This definition of an establishment is different from the definition of a firm or a company which may consist of one or more establishments at several locations. The BLS, in cooperation with the States, takes many steps to ensure that employers with multiple establishments in the state report employment and wage data for specific establishments. Employment is defined as the number of covered workers (whose wages are subject to UI taxes) who earned wages during the pay period which includes the 12th of the month. The quarterly UI microdata contain information on monthly employment; the gross job gains and gross job loss statistics use employment in the third month of the quarter as the measure of the establishment¡¯s quarterly employment.
The gross job gains and gross job loss statistics published by the BLS are derived from a subset of the establishments in the QCEW data for the private sector at this point.
The Linkage Methodology: Following establishments across time using administrative UI microdata is a complex and challenging exercise. Creating the business employment dynamics data series requires a thorough understanding of how businesses operate and how they file their UI tax forms. The manner in which businesses report administrative changes and ownership changes can result in establishments changing UI identifiers even though no economic changes occurred. Failing to capture and link such non-economic changes would result in an overstatement of establishment openings and closings, and thus an overstatement of job turnover in the economy. The BLS has developed a multi-step process to accurately link business establishment data over time[2]. This linkage process consists of four steps: two distinct administrative matches, a probability-based weighted match, and an analyst intervention match.
The linkage process is based on the unique establishment identifier maintained by the States. The first step is to link establishments that maintain the same identifier across quarters. This is followed by a match using predecessor and successor information that identifies distinct establishments as continuous across quarters in situations where the UI establishment identifier changes as a result of a change in ownership or a change in the reporting configuration of a multi-establishment company. In most cases, businesses buying another business must report the assumption of liability for UI taxes to the State. These reported linkages are the vast majority of predecessor and successor linkages; others are identified by the State Labor Market Information Staff. The third step in the linkage process, conducted by the BLS, is a probability-based weighted match process. This probability-based weighted match uses information such as establishment name, street address, and telephone number to link, as continuous, a closing establishment in the previous quarter with an opening establishment in the current quarter. The final step in the matching process is an analyst review and possible manual linkage of selected large unmatched records. Further research is underway to better identify predecessors using improved techniques and training and other data sources including UI wage records. Wage records are provided by employers for each individual employee and their quarterly wages. These UI wage records can be a tool to aid in the identification of potential predecessors by tracking large movements of the same workers fom one business to another. These employee movements are another key to potential predecessor/successor linkages in the same way as business names, addresses and phone numbers. Research has shown that mere automated links using wages records cannot be used without the expert review of trained analysts.
Gross Job Gains and Gross Job Losses: Cross-Sectional Results
The seasonally adjusted time series of gross job gains and gross job losses are presented in Table 1. Focusing on the second quarter of 2003, we see that the economy lost 180,000 jobs (seasonally adjusted). This employment decline is the net result of two components: the jobs gained by opening and expanding establishments, and the jobs lost by closing and contracting establishments. Opening and expanding establishments gained 7.5 million jobs in the second quarter of 2003, while closing and contracting establishments lost 7.7 million jobs. The gross job gains of 7.5 million and the gross job losses of 7.7 million are substantially larger than the net employment change statistic, which illustrates the sizable amount of job churning that occurs in the U.S. economy each quarter.
Gross job gains result from expanding and opening establishments. How large are these two components relative to each other? In table 1, again focusing on the second quarter of 2003, we see that employment in expanding establishments grew by 6.0 million jobs and employment in opening establishments grew by 1.5 million jobs. These statistics indicate that expanding establishments account for 80 percent of quarterly gross job gains, whereas opening establishments account for 20 percent of quarterly gross job gains. With regard to gross job losses, employment in contracting establishments declined by 6.1 million jobs, and closing establishments accounted for the loss of 1.6 million jobs. Thus, contracting establishments account for 80 percent of quarterly gross job losses, whereas closing establishments account for 20 percent of quarterly gross job losses. Expanding and contracting establishments account for most jobs gained and lost when measured on a quarterly frequency.
When measured in percentages rather than levels, the gross job gains rate in the U.S. private sector economy was 7.0 percent between March 2003 and June 2003, and the gross job loss rate for the quarter was 7.3 percent. These statistics are reported in table 2. The interpretation of these statistics is that the jobs gained in opening and expanding establishments are 7.0 percent of the total number of jobs, and the jobs lost from closing and contracting establishments are 7.3 percent of the total number of jobs. The negative 0.3 percent difference between the gross job gains rate and the gross job loss rate is the net employment growth rate, seasonally adjusted, between March 2003 and June 2003.
An important component of the business employment dynamics data series is the establishment counts underlying the gross job gains and gross job losses. These establishment counts, on a seasonally adjusted basis, are reported in table 3, with rates given in table 4. Looking at the second quarter of 2003, there were 1.5 million expanding establishments (22.6 percent of all active establishments), and 1.5 million contracting establishments (22.9 percent) during the quarter. There were 332,000 establishments (5.2 percent) opening during the quarter, and 337,000 establishments (5.3 percent) closing during the quarter. The difference between the number of opening and closing establishments (-5,000) is the net change in the number of active establishments during the quarter[3].
The statistics from tables 1 and 3 indicate that the average expanding establishment added 4.1 jobs during the quarter (5.988 million jobs divided by 1.451 million establishments) and the average contracting establishment lost 4.2 jobs during the quarter (6.140 million jobs divided by 1.465 million establishments). A similar calculation shows that the average opening establishment starts with 4.6 employees in its first quarter of positive employment, and the average closing establishment is responsible for the loss of 4.6 employees in its final quarter with employees.
These business employment dynamics data add to the labor market statistics currently available from the Bureau of Labor Statistics. The traditional measure of net employment change produced by the BLS indicates that employment fell by 180,000 jobs during the second quarter of 2003 (seasonally adjusted). The gross job gains and gross job loss statistics indicate that this net employment loss is the result of 6.0 million jobs added at 1.5 million expanding establishments, 1.5 million jobs added at 332,000 opening establishments, 6.1 million jobs lost at 1.5 million contracting establishments, and 1.6 million jobs lost at 337,000 closing establishments. These large gross job flows underlie the substantially smaller net employment change statistic, and were calculated from the same administrative UI microdata without additional data collection efforts or additional respondent burden.
The quarterly net employment growth rate from the new BLS business employment dynamics data series is shown in Chart 1. This chart merely plots the time series of the net change statistics from Table 2. The recent recession, which was dated by the National Bureau of Economic Research (NBER) as occurring between March 2001 to November 2001, is clearly evident in this chart. Prior to the recession, between the third quarter of 1992 and the first quarter of 2000, net employment growth had been positive every quarter and averaging 0.7 percent per quarter. But then during the recession, as seen in chart 1, net employment growth was negative for all quarters of 2001, with a low of -1.1 percent in the third quarter of 2001.
The seasonally adjusted gross job gains and gross job loss rates are plotted in Chart 2. As explained earlier, the difference between the gross job gains rate and the gross job loss rate in Chart 2 is the familiar net employment change rate depicted in Chart 1. When gross job gains are above gross job losses, there are net employment gains; when gross job losses exceed gross job gains, there are net employment losses.
The most recent business cycle is evident in chart 2. Between the third quarter of 1992 and the first quarter of 2000, the gross job gains rate is relatively constant, averaging 8.2 percent per quarter, and the gross job loss rate is also relatively constant, averaging 7.5 percent per quarter. The gross job gains rate started to decline in 2000, and dropped substantially in 2001 (to 7.2 percent in the third quarter of 2001). The gross job loss rate increased substantially in 2001, rising to a high of 8.3 percent in the third quarter of 2001. Thus the declining net employment growth rate during the first three quarters of 2001 is characterized by both a falling gross job gains rate and a rising gross job loss rate.
As the official NBER-dated recession ended in late 2001, the gross job loss rate decreases considerably, and by early-to-mid 2002 has returned to a rate comparable to its pre-recessionary rates. The same cannot be said for the gross job gains rate following the recession. In calendar year 2002, the gross job gains rates remains in the range of 7.2 to 7.5 percent, which is substantially lower than its pre-recessionary rates.
Openings and Closings Compared to Births and Deaths: The new Business Employment Dynamics data series produced by BLS classifies establishments as expanding, contracting, opening, or closing (or not changing their employment level). The definitions of establishment openings and closings differs from definitions of establishment births and deaths. It is not possible to define business deaths on a contemporaneous basis. Businesses in the Unemployment Insurance system are allowed to, and often do, report zero employment for several quarters after they have effectively closed. This undoubtedly occurs when a business owner temporarily shuts down but anticipates starting up the business again when economic conditions improve. By reporting zero employment and wages on the quarterly contributions form, the business owner can keep his UI account active. This results in many observed business closings, but which of these closings will start up again and which will die is not observed for several more quarters.
Although deaths cannot be defined contemporaneously, we can define births and deaths in the historical data. A business birth is defined as an opening establishment which did not have any positive employment during the previous four quarters (thus differentiating seasonal openings from business births). Births are a subset of openings. Likewise, a business death is defined as a closing establishment that does not have positive employment during the subsequent four quarters. Deaths are a subset of closings.
Ongoing Work and Future Enhancements: The BLS has created new quarterly data on business employment dynamics. These data quantify the sizable number of jobs that appear and disappear in the U.S. economy each quarter. These data also show that the 2001 recession is characterized by a decline in gross job gains accompanied by an increase in gross job losses, and the several quarters following the end of the recession are characterized by a gross job loss rate that returned to pre-recessionary levels and a gross job gains rate that has not returned to pre-recessionary levels.
Characteristics of Survival: Longevity of Business Establishments
It seemed every sector of our society was growing apace in the 1990s whether through mergers, buy-outs, or new openings. Most of us noticed the changing signs on our hometown bank and the new construction going on in our neighborhoods. In addition to new homes going up, new businesses were moving in to take advantage of the growing wealth in the U.S. In an age where it seemed that everyone was succeeding, did some nevertheless, fail?
Our understanding of new businesses has been largely limited to the manufacturing sector and to the scale of the firm and not the establishment (For example, Dunne, Roberts, and Samuelson, 1988; Baldwin and Gorecki, 1991; Mata and Portugal, 1994; Audretsch, 1991; Audretsch and Mahmood, 1995). The main reason was limitations of the data available for such study. In many countries, including the U.S. until recently, manufacturing was the only sector for which data was compiled on a regular basis and provided the ability to link firms across time, in order to create a history of firm behavior. These studies have been mainly concerned with firm behavior even when the unit of collection is the establishment.
This study characterizes business survival by looking at all establishments that started in the U.S. in the late nineties, when the boom was not yet showing signs of weakness. This study builds on and extends a report from the Minnesota Department of Economic Security (MDES) on business churning from 1993-1995 (May 1997), which profiled births, their survival rates, and deaths during the early nineties, when the boom years were just starting. These businesses are followed into the recession of 2001 to see how they fared once the economy turned sour. The analysis follows a birth cohort from second quarter of 1998 through the following 16 quarters, differing from previous studies in both focus and time frame. This study focuses only on those entrants that are completely new, that is, only new firms that open a single establishment, and expands the analysis to all sectors in the economy. Survival rates of establishments along with several measures of employment are reported and compared across sectors.
Births are defined as those establishments that are new to the QCEW longitudinal database in the relevant quarter. Births had not reported positive employment for the previous four quarters. The data was tested for four quarters prior to the relevant quarter to eliminate seasonal establishments and establishments re-opening after a temporary shutdown from showing up in the birth cohort. Furthermore, these new establishments have no ties to any establishment(s) that existed prior to the relevant quarter. This eliminates changes in ownership from the cohort as well as new locations of existing firms that might be expected to behave differently from independent establishments. Another reason for not including new locations of existing firms is that often these are administrative changes in the data, rather than actual new locations. To include them would risk skewing the data in both the rates of survival and average employment. The resulting cohort contained 212,182 new establishments across the nation for the second quarter of 1998.
Births were tracked across 16 quarters from March 1998 to March 2002 by a unique identifier. Establishments are the same as firms in the birth quarter. In subsequent quarters, establishments are allowed to be acquired or merged with another firm, or to spin off a subsidiary or open additional locations. Those establishments that were involved in such succession relationships (0.16% of the cohort or 341 establishments) were also tracked across time by following the succeeding establishments. The data of these succeeding establishments was aggregated and assigned a unique identifier that was linked to the original birth establishment. In this way data was not lost for those establishments that were presumably the most successful.
Two-digit NAICS codes are used to group the establishments into ten sectors: Natural Resources (NAICS 11 and 21), Construction (23), Manufacturing (31-33), Trade Transportation and Utilities (22, 42, 44-45, 48-49), Information (51), Financial Activities (52-53), Professional and Business Services (54-56), Education and Health Services (61-62), Leisure and Hospitality (71-72), and Other Services (81). This grouping facilitates comparison of survival rates between industry sectors along with the employment contributions in the initial quarter and over the subsequent four years. Average employment in the initial quarter is compared to average employment in subsequent quarters as well as the highest employment attained by an establishment, on average, during the four years. That is, peak employment, which can be attained by an establishment during any quarter of the time period, is compared to average initial employment for each industry sector.
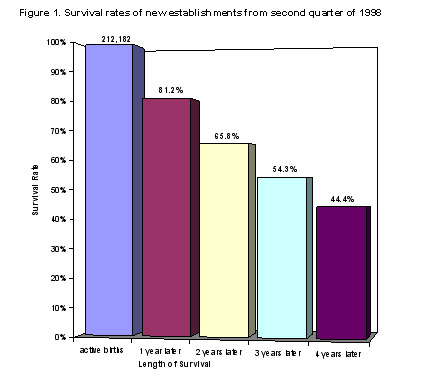
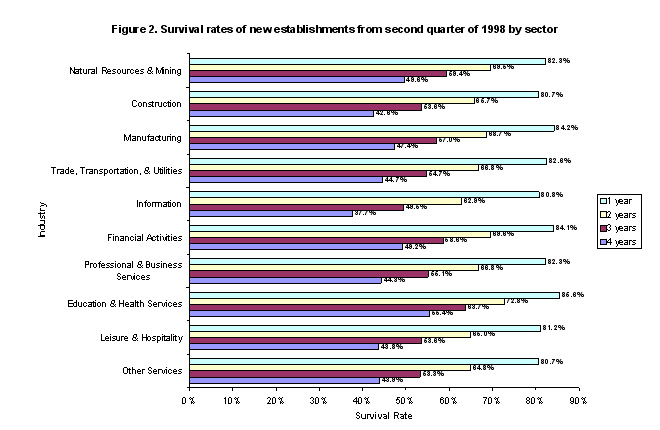
Survival Results: The data show that across sectors, 66% of new establishments were still in existence two years later, and 44% were in existence four years later (Figure 1). It is not surprising that most of the establishments disappeared within the first two years, and then only a smaller percentage disappeared in the subsequent two years. These survival rates do not vary much by industry (Figure 2). Despite the amazing success stories of the ¡®90s dot-coms, Information had the lowest two and four year survival rates, 63% and 38% respectively. Education and Health Services had the highest two and four year survival rates, 73% and 55%. As the conventional wisdom goes, restaurants should bring down the averages for the sector that includes them, because they are constantly starting and failing. However, Leisure and Hospitality¡¯ two and four year survival rates at 65% and 44% are only slightly below average, despite including restaurants.
Converting these survival rates into exit rates used by previous studies, we can see that the results are similar. In particular, comparing the manufacturing sector to previous results, we get a four year exit rate of 52%[4] , while Dunne, Robertson, and Samuelson found a five year exit rate of 62% on average for the three cohorts that they followed. Baldwin and Gorecki have slightly lower four and five year exit rates, at 35% and 41% respectively. And Audretsch¡¯s four year survival rate (77.4%) converts to an exit rate closer to that of Baldwin and Gorecki than to the numbers found here.
One can also look at survival rates by asking how many establishments were in operation in the second, third, and fourth years, conditional on being operational in the previous year. In other words, how many of the establishments which survived the first year were still in business at the end of the second year, how many that made it to the third still existed in the fourth year, and so forth. One might expect that survival to the previous year might be a good indicator as to the odds of surviving to the next, but at the national level these conditional survival rates are fairly stable, increasing somewhat in the third year, but declining again in the fourth (Table 1). Only three sectors show a tendency toward increasing survival, Natural Resources and Mining, Education and Health Services, and Other Services. Information shows a trend in the opposite direction, but most of the sectors show no tendencies at all.
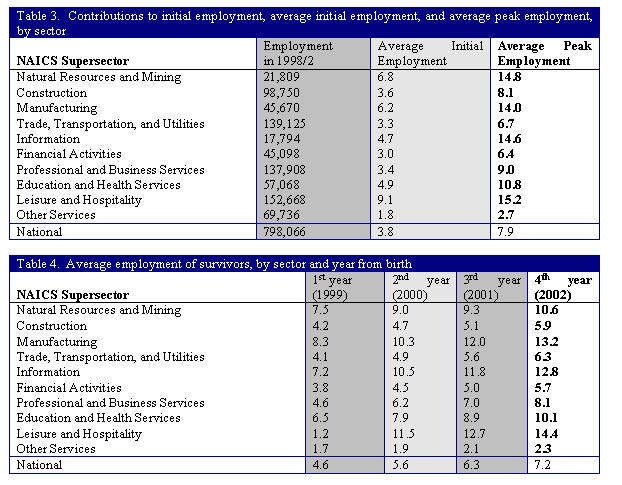
The largest contributor to opening employment for the cohort as a whole was the Leisure and Hospitality sector. The smallest was the Information sector. This result is not surprising when looking at average initial employment in the sectors. Leisure and Hospitality also had the largest average initial employment, with 9 employees per establishment, but its establishments grew by one of the smallest amounts (67%), attaining a high of 15 employees on average at their peak during the time period. Information began with an average initial employment of 5, but grew by 211%, to almost match average peak employment of Leisure and Hospitality. While this growth is phenomenal, it must be measured against the number of establishments in each sector. Leisure and Hospitality has approximately 5 establishments for every one establishment in Information in each quarter (Table 2). Thus, the employment in the Leisure sector is at least 5 times that of the Information sector (Table 4).
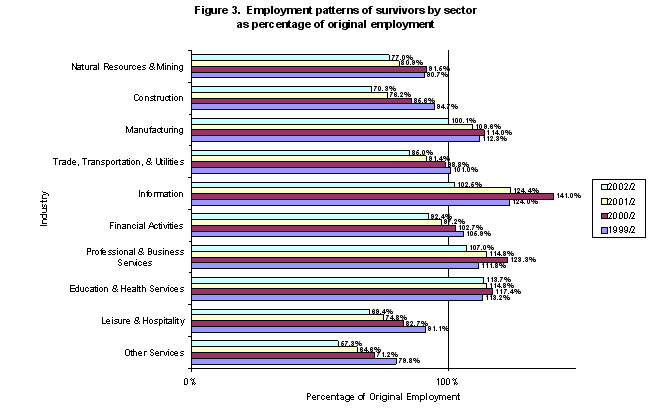
Looking closer at the growth of the birth cohort, we see a wide variation in the growth of employment in each sector in contrast to the fairly stable measures of establishment survival across sectors. Information, Professional and Business Services, Education and Health Services, and Manufacturing stay at or above their opening employment for the four years of this study. All other sectors experience continual decreases in employment in successive years. Thus, looking at employment patterns slightly changes the picture of what a thriving industry sector is. While from the number of establishments and average employment Leisure and Hospitality appears to be the thriving sector, employment patterns show that the surviving establishments are not as successful overall as some other sectors (Figure 3).
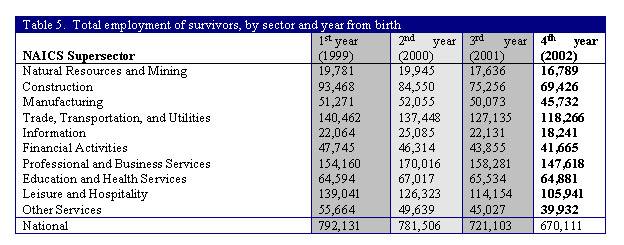
One of the surprises of the data is that Manufacturing, thought to be a beleaguered sector, is still starting new businesses. Its survival rates are above average and its employment stays above initial employment until the fourth year, when it falls back to its 1998 level (Figure 3). This shows that despite closing plants, employment has increased in the surviving establishments keeping employment levels stable for the birth cohort of this sector. Another sector of interest is the Professional and Business Services, with average two and four year survival rates, but one of the best four year employment patterns (Figures 2 and 3). While the strong employment pattern of the Information sector is attenuated by its small employment size (17,794), the Professional and Business Services sector was one of the largest contributors to opening employment (137,908) (Tables 3 and 5).
Most sectors see a greater decline in employment in the fourth year, during which the recession occurred (Figure 3). The lead up to the recession may also be the cause behind the shift from increasing employment in the second year to decreasing employment in the third year. This contrasts with the increase in the average size of surviving establishments (Table 4).
What emerges from this characterization of the 1998/2 birth cohort is that for most sectors of the economy, those businesses that manage to survive grow and add more to employment in that sector than did their entire birth cohort. While establishment survival rates are fairly consistent across sectors, the contributions to employment of those surviving establishments varies widely. Some sectors experience consistent decreases in overall employment from year to year, while others are increasing their employment levels in the more prosperous sectors.
Conclusion: These new gross job gains and gross job loss statistics will help economists, policy makers, and business leaders better understand the labor market and the U.S. economy. The data described in this article represent just the start of new data series flowing from the Business Employment Dynamics program. In addition to the national level data described in this article, BLS is also preparing additional data series at more detailed levels. The BLS plans to release gross job gains and gross job loss statistics for industries and geographies, although confidentiality restrictions will determine how much detail can be published. The BLS is also working on gross job gains and gross job loss data by size class, which will enable answers to the commonly asked question ¡°who creates the most jobs?¡± The statistics presented in this article are all at the establishment level; the BLS is working on gross job gains and gross job loss statistics at the firm level. And finally, the BLS is also working on annual, rather than quarterly, gross job gains and gross job loss statistics, and related issues such as business survival rates.
The development of business employment dynamics is a continous process. With national data expanding to high industry level, further development is targeted for size class, data for states and counties and further industry detail.
References:
Audretsch, David B., ¡°New-Firm Survival and the Technological Regime,¡± The Review of Economics and Statistics, August 1991, 441-450.
Audretsch, David B. and Talat Mahmood, ¡°New-Firm Survival: New Results Using a Hazard Function,¡± The Review of Economics and Statistics, February 1995, 97-103.
Baldwin, John R., and Paul K. Gorecki, ¡°Firm Entry and Exit in the Canadian manufacturing sector, 1970-1982,¡± Canadian Journal of Economics, May 1991, 300-323.
Dunne, Timothy, Mark J. Roberts, and Larry Samuelson, ¡°Patterns of firm entry and exit in U.S. manufacturing industries,¡± RAND Journal of Economics, Winter 1988, 495-515.
Mata, Jose, and Pedro Portugal, ¡°Life Duration of New Firms,¡± Journal of Industrial Economics, September 1994, 227-245.
Spletzer, James R., R. Jason Faberman, Akbar Sadeghi, David M. Talan, and Richard L. Clayton, ¡°Business Employment Dynamics: new data on gross job gains and losses,¡± Monthly Labor Review, April 2004, 29-42.
¡°Business Births and Deaths: The Dynamics of Business Churning in Minnesota,¡± Research and Statistics Office, Minnesota Department of Economic Security, May 1997.

Disclaimer: All empirical work in this paper is based on the authors¡¯ calculations. Any views expressed in this paper are those of the author and do not necessarily reflect the policies of the BLS or the views of other BLS staff members.
|