Quality in the Swedish Business Database
The Quality Survey 2004
Bjom Thomadtsson
Quality Indicators in the Swedish Business Database
1. Quality Concepts for Official Statistics in Sweden
At Statistics Sweden a quality concept for official statistics was revised in 2001. The quality philosophy in the concept is based on the approach, total quality, formulated in the following central points:
Ø The user shall be in focus. A product¡¯s quality is determined by the users¡¯ opinions of the product and its fitness for their poses.
Ø Quality refers to all aspects of a product which are of relevance for how well it meets users¡¯ needs and expectations.
The last point can be re-formulated to better apply to the product ¡°statistics¡± or ¡°Business Registers¡±, which leads to following definition:
¡°Quality of statistics (Business Register) refers to all aspects of statistics (Business Register), which are relevant for how well they meet users¡¯ needs for statistical (Business Register) information.¡±
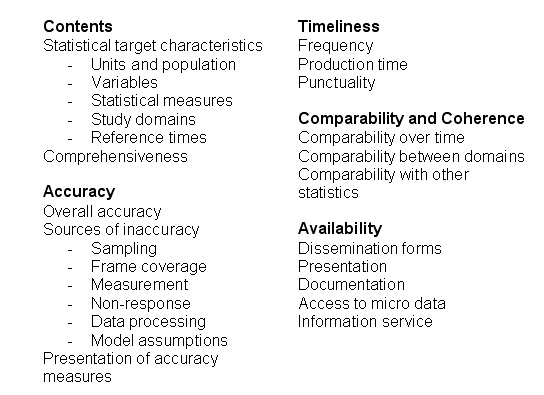
The quality concept used for official statistics in Sweden consists of five main components:
Ø Contents, which concerns the target characteristics.
Ø Accuracy, concerning sources of inaccuracy and their effects on statistics (Business Register).
Ø Timeliness, concerning time aspects of relevance for how well the statistics (Business Register) describe the ¡°now¡± situation.
Ø Coherence especially comparability, concerning possibilities to make comparisons, over time and between groups, and to use the statistics (register information) from other sources.
Ø Availability and clarity, concerning physical availability of the statistics (Business Register) and their understand ability.
The five components are structured by main components and sub-components, showed in the table below:
The components broken down into sub-components are constructed to cover all type of different statistics, especially sample-based statistics. Therefore all of the sub-components are not relevant for a quality declaration of a register. Most of them are possible to use in the form they were intended and in some cases adjusted to be suitable for registers. The knowledge about a quality component can vary and could be ranked in one of the following levels:
Ø No knowledge about the quality component.
Ø Vague knowledge about the presence of errors
Ø Good descriptions of the processes, which make it possible to have a picture of the reliability
Ø Vague quality indicators, which are based on remarks made by users.
Ø Quantitative indicators on example coverage and corrections made
Ø Estimated errors by means of systematic observations, evaluations etc.
It is important that the users are aware of the knowledge level. The quality declarations for the Swedish Business Database has covered levels 1-5 and has taken a big step towards level 6 by making the quality survey that is presented later on in this paper.
2 Construction of the quality survey
2.1 The needs of a quality survey
Nearly all inputs to the Swedish Business Database are from administrative sources outside of Statistics Sweden. Our Local Unit questionnaire is the head source for some data and a marginal part is from feedback from users and from the ordinary contacts in the register maintenance. By analysing the inputs, the use of the register, the feedback from users and the ways of dissemination it is possible to have quality indicators in 4 of 5 head components of Statistics Sweden¡¯s quality concept. For the fifth, accuracy, it is not possible to make adequete estimates without a quality questionnaire.
2.2 Construction of the questionnaire
The pre-survey discussions were concentrated on two options of the ways to accomplish the survey:
Ø Sending out a questionnaire with quality questions directly to the Enterprises.
Ø Sending out pre-printed information of the data included in the Business Database asking the Enterprises to correct and make complements to existing data. The information could later be coded to quality information at Statistics Sweden.
The decision was to carry out the survey according to the second option. The decision also included that the Local Unit would be the sample unit. This decision were based on:
- For Enterprises with more than one Local Unit the information in many cases, concerning the Enterprise, is aggregated from the Local Unit. Example of aggregated information are the number of employees (size class) and the activity code (NACE).
- For Enterprises with one Local Unit the information for the Local Unit and for the Enterprise are the same. This is also the case for the ¡°head¡± Local Unit for Enterprises with more than one Local Units.
- To measure quality on geographical location and location codes the only option is to have the Local Unit as the sample unit
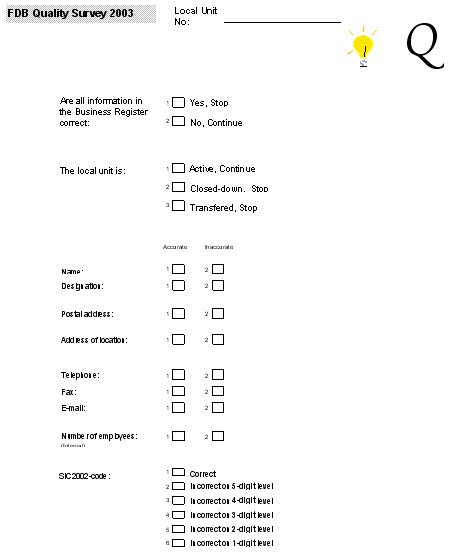
The pilot survey had high priority on measuring the quality of the activity, contact and stratifying variables. The variables in the questionnaire were (see also appendix 2):
- State of activity (Active or not)
- Name
- Postal address
- Address of location
- Telephone
- Fax
- E-mail
- Number of Employees (Interval)
- Activity code (SNI2002, which are on 4-digit level corresponding with NACE rev1.1)
The survey also measured over coverage and the keys between the Enterprise and the Local Units belonging to the Enterprise by analysing the state of activity.
As earlier described, pre-printed information was sent out to the Enterprises that the Local Unit belonged to. For Local Units belonging to Enterprises with more than one Local Unit the ordinary register update survey was used. The Enterprises were asked to check the information, to correct erroneous information and to make completions and send the form back to Statistics Sweden. After the return the information was coded (activity code) and transferred to the quality survey (annex 1) by the maintenance staff at the Swedish Business Database.
The coding approach was pragmatic. Small spelling failures were not classified as faults. The approach in example:
Ø The postal address was correct if a letter would reached right address
Ø The location address was correct if the information was enough to find the place if you needed to visit the Local Unit.
For numeric codes, in example the activity code, in contrary the code needed to be exactly
2.3 Construction of the sample
The assumptions to construct the sample were:
Ø The sample unit should be the Local Unit
Ø The only thing the survey would measure were if the information either were right or wrong
Ø A ruff breakdown by activity code and by size-class was requested
Ø The total size of the sample should be around 2000 Local Units, because of limited budget.
The sample was stratified in seven groups of activity code (SNI2002) and three size-classes of employees. Good approximation of the precision, when you want to measure ¡°¡±right or wrong¡±, depends mostly of the size of the sample when the frame is as large it is in this case. Therefore it was natural to have same sample size on all the groups that the result would be reported on. The most cost efficient size of the sample was estimated to be nearly 2000. A larger sample should off course have given better precision, but the cost should not motivate it. The size of the frame and the sample are described in, table 1, appendix 1.
The answering rate of the survey was 81 per cent. The variation of the answers was generally between 90 ¨C 99 per cent that the information in the Business Database was correct. Table 2, appendix 1, describe the confidence intervals if 95 per cent of the Local Units said that the variable is correct.
3 Result of the quality survey
3.1 State of Activity
State of activity implies if a Local Unit is active or not. The questionnaire was sent out very shortly after the sample was drawn and the ambition was to monitor the activity at ¡°sample-time¡±. To be included in the frame the Local Units had to be active, in other words the results is monitoring the over covering.
Table 3, appendix 1, describes the result. The third column ¡°transferred¡± shows the share of active Local Units that belonged to another Enterprise than the Business Database showed. This column monitor incorrect keys between the Enterprise and the Local Unit. The correct share of still active Local Units is at total level 97.9 + 0.8 = 98.7 per cent.
Trade and restaurants (50-55) were the NACE divisions that showed the highest rate of incorrectness. Other divisions and the breakdown by size-class shows similar shares of activity, nearly 99 per cent or a over coverage around one per cent.
3.2 The SNI2002 code
Table 4, appendix 1, presents a picture of the quality of existing SNI2002 codes. Overall 95 percent of the codes apprehended correctly. Divided in different divisions of SNI2002 the lowest level of correct codes were for Local Units in the group 50-55 (Motor, wholesale and retail trade + hotels and restaurants). It is more incorrect codes for Local Units with no employees than with employees.
The incorrect codes appear in all levels of code structure. Most of the incorrectness are on the fifth digit of the code (Table 5, appendix 1). Around 2.3 per cent of the 5.0 per cent are derived from the Swedish national level (5-digit). At NACE level the share of incorrect codes are 2.7 per cent.
A large share of all the Local Units in the Business Database have no SNI2002 code at all. If we include all of those, the total share of incorrect and no codes increase to nearly 13 per cent. Nearly all of those Local Units without code are Enterprises with no employees. Other studies have also shown that they in general have very small turnover and have a marginal impact on the economic statistics even if they in number are many.
3.3 Size class by employees
The size-class variable is a compulsory variable in the Business Database. The share of Local Units with correct employee size-class range from 88.8 to 96.6 per cent (Table 6, appendix 1). The average (total) share is 93.9 per cent and the activity codes that includes public sector in large extent (Division 75-85) shows the lowest share. In contrary to other variables, the quality is better for the smallest Local Units, i.e. Local units with no employees, than those with employees.
One explanation to the large share of incorrect size-classes on the public sector is the big extent of non-permanent staff (people working on different places) in the municipalities. Why quality was so much lower for the largest Enterprises have to be analysed more in detail.
3.4 Addresses
There are two types of addresses in the Business Database for a Local Unit. The postal address, i.e. the address the post would be sent to, and the location address, i.e. the street address where the Local Unit physical is settled.
The variable Postal Address is obligatory in the Swedish Database. 94 per cent of all postal addresses was correct (Table 7, appendix 1). The variation between divisions of SNI2000 was from 90.9 to 97.1 per cent. Larger Local Units have a higher share of correct postal addresses than small.
Not all of the Local Units have a location address and the quality of the address on those who has it is lower than for the postal address (Table 8, appendix 1). Approximately 4.5 percent of the Local Units are missing the variable and 8.7 per cent of those Local Units, which have the variable have an incorrect one.
If incorrect location address are combined with no location address; more than 87 per cent of the Local Units have a location address that are registered and correct.
3.5 Phone number
For 83 per cent of the Local Units in the Business Database the variable phone number has a value. A little more than 81 per cent of these phone numbers are correct. (Table 9, appendix 1).
The incorrectness of the code are of different types. For the smallest Enterprises, ex. sole proprietorships, most of the incorrect numbers are home numbers and not the number to the Local Unit. For Local Units belonging to Enterprises with more than one Local Unit the number often goes to the head-office and not to the Local Unit surveyed.
If incorrect phone numbers and no phone numbers are combined; 31 per cent of the Local Units either have none or incorrect phone number.
3.6 Other variables
Table 10, appendix 1, describes the result for the other variables included in the quality survey, not described above.
Ø All Local Units have a name (obligatory variable) and all Local Units in the survey also had correct names.
Ø Nearly 10 per cent of the Local Units have a designation (mostly in the public sector) and of them 93.1 per cent was correct.
Ø Approximately 7.5 per cent of the Local Units have information on fax number included. More than 97 per cent of the fax numbers were correct.
Ø Only 2.8 of the Local Units have information on e-mail address. Over 98 per cent of those who had them,were correct.
4 Evaluation of the survey results
4.1 Evaluation of the Survey Method
The method and the pragmatic approach used in the quality survey was a very cost efficient method both for the Enterprises and the costs at Statistics Sweden. The Enterprises that answered only had to check and correct the information for the variables. All of the variables included in the survey are public information in the public business register, also administrated at Statistics Sweden. Therefore the Enterprises are interested that the information in the register is correct and the Enterprises did not have the feeling that the response burden were high. The translation of the information to quality information was also an easier task than expected. The only variable that caused some problems was the classification of new activity code, but the staff making the translation had a long experience classifying activity codes.
The reliability of the result from the survey could be split in two groups:
Ø Because of the reason that the Enterprises are keen on keeping the information in the public business register correct, the reliability of the answers on contact variables (name, addresses, phone, etc) is high. This is also in line with the expectations and earlier experience. The ¡°questionnaire¡± was sent to the unit at the Enterprise that is responsible for salaries and labour force. Therefore should also the answers on the number of employees (size-class) have a high reliability.
Ø For the activity code classification it could be questioned that the method is good enough. One reason of this doubt is that the respondent at the Enterprise did not have enough knowledge about coding and the classification to decide if the code is correct or not. This could indicate, especially for small Local Units, that the number of incorrectly classified Local Units is underestimated. But on other hand, this is also a public variable and it is very important to have a correct code for a majority of the Enterprises. To have a better reliability on the activity classification the method should be adjusted and should be completed with for example more information, help to check if the code is correct and to search for new codes.
4.2 Comparison of the SNI2002 code with the subject matter statistics
4.2.1 Comparison with Service Statistics
The Service Statistic Unit at Statistics Sweden carries out surveys in different activity codes in the service sector with a frequency of 3-5 years. The main purpose with the surveys is to make breakdowns of turnover and costs. In these surveys they also ask if the SNI2002 code is correct or not. For 2003 the result of incorrect SNI2002 codes was:
Ø 63.3, Travel agencies and tour operators
12.8 percent of the codes were incorrect compared to the result in the quality survey; 1.8 percent total in the activities 60-64
Ø 70 excl. 70.3, Real estate activities, ex real estate activities on fee and contract basis
3.3 percent of the codes were incorrect compared to the result in the quality survey; 2.8 percent and total in the activities 64-70
Ø 70.3, Real estate activities on fee and contract basis
6.8 percent of the codes were incorrect compared to the result in the quality survey; 2.8 percent and total in the activities 64-70
Ø 93, Other service activities
3.9 percent of the codes were incorrect compared to the result in the quality survey; 1.0 percent and total in the activities 90-99
It is difficult to compare the Business Database quality survey and the service statistics for different reasons, ex;
- the unit in the surveys is the Local Unit in the quality survey and the Enterprise in service statistics
- the detail level of activities is different
- the two surveys have different puposes
But, with a very high probability this comparison indicate a low share of incorrect activities in the Business Database quality survey.
4.2.2 Comparison with the Occupation Register
The Swedish Occupation Register is under construction. In this work the Occupation Register is sending out questionnaires to Enterprises and asking for their staff¡¯s occupation. During the late spring of 2004 a questionnaire was sent to all Enterprises with one employee in the sections A (Agriculture etc), B (Fishing) and F (Construction). In this questionnaire the Enterprise was asked to only write down by words what they were doing and the staff at Statistics Sweden coded it without knowing anything about the present code for the Enterprise in the Business Database. The result was that 12 per cent of the Enterprises had incorrect codes in the Business Database and this also indicate a low share of incorrect activities in the Business Database quality survey.
5 Future quality work in the Swedish Business Database
The quality work at the Swedish Business Database is carried out with the user perspective in focus. To have this perspective as priority one it is very important that the users and the staff working at Statistics Sweden have the same idea of what good quality is. To reach this conformity it is important to have good relations with the users and to have good quality indicators, which in prolongation gives a good knowledge about the quality both by the users and the staff working at Statistics Sweden. The short term plans at Statistics Sweden to draw nearer this goal are:
Ø Continue to work on good relations with both users and the sources (Register holders of administrative registers)
Ø Continue the work to implement short term and annual quality indicators.
Ø Making the Business Database quality survey to a annual survey.
Ø Making an annual publication that, based on Statistics Sweden¡¯s quality concept, describes the quality and the quality changes in the Business Database.
Appendix 1: Tables of result
Table 1: Size of the frame and sample
Number of Local Units in the Swedish Business Database, equal to the frame and the sample for the quality survey.
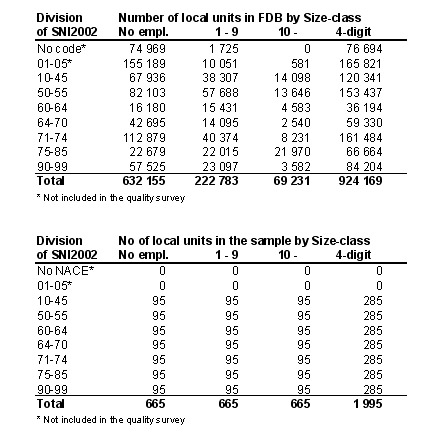
Table 2: Confidence interval
Confidence interval for the activity code question (SNI2002) in the quality survey.
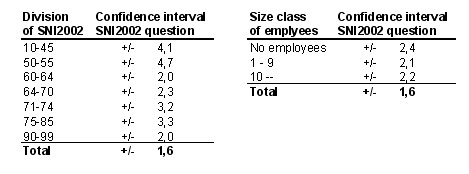
Table 3: Share of correct classified State of Activity
Share of correct classified State of activity for Local Units in the Swedish Business Database
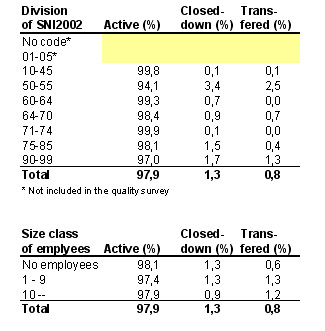
Table 4: Share of correct classified activity code, SNI2002
Share of correct classified activity code for Local Units (SNI2002 on 4-digit level NACE rev 1.1) in the Swedish Business Database
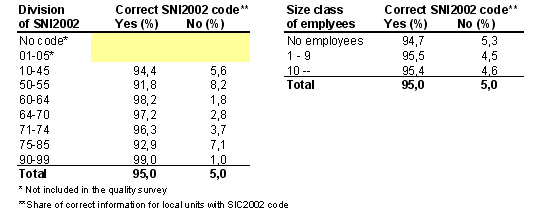
Table 5: Share of incorrect classified activity codes on digit level
Share of incorrect classified activity codes for Local Units on different digit levels (SNI2002 on 4-digit level NACE rev 1.1) in the Swedish Business Database
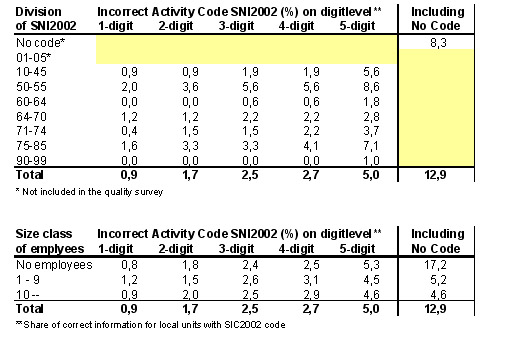
Table 6: Share of correct size-class
Share of correct size-class by employees for Local Units in the Swedish Business Database
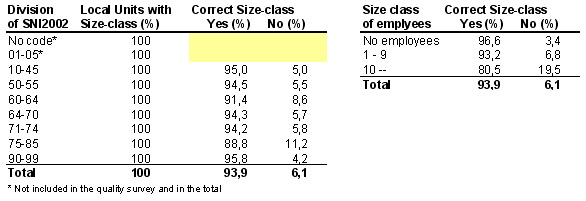
Table 7: Share of correct Postal Addresses
Share of correct Postal Addresses for Local Units in the Swedish Business Database
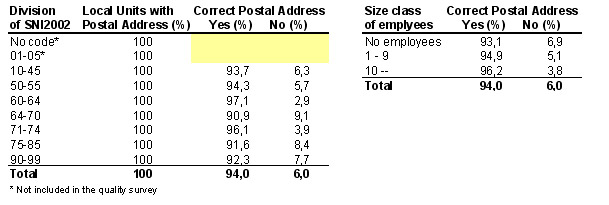
Table 8: Share of correct Location Addresses
Share of correct Location Addresses for Local Units in the Swedish Business Database
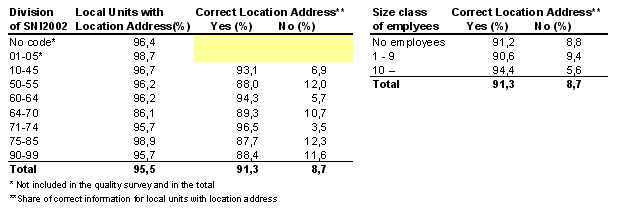
Table 9: Share of correct Phone Numbers
Share of correct Phone Numbers for Local Units in the Swedish Business Database
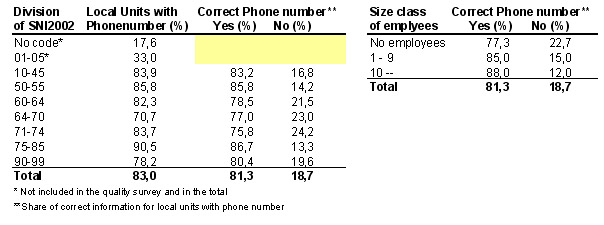
Table 10: Share of correct information for other variables
Share of correct information for variables included in the quality survey, not presented above

Appendix 2: Quality Questionnaire
|